U.S. Dept. of Commerce / NOAA / OAR / PMEL / Publications
On the Variability of Winds, Sea Surface Temperature, and Surface Layer Heat Content
in the Western Equatorial Pacific
Michael J. McPhaden and Stanley P. Hayes
NOAA/Pacific Marine Environmental Laboratory, Seattle, Washington
Journal of Geophysical Research, 96, supplement, 3331-3342 (1991)
This paper is not subject to U.S. copyright. Published in 1991 by the American Geophysical
Union.
5. Surface Turbulent Fluxes, Vertical Advection, and Entrainment
Figure 7 shows time series of wind speed (|U|),
zonal wind pseudostress (|U|U ),
and pseudowork (|U|
 ) from the mooring
at 0°, 165°E for December 1986 to October 1987. In each case, estimates were
first computed from hourly data, then averaged to daily values. Ignoring the
weak wind speed dependence of C
 and C
and C for the range of
speeds shown in Figure 7, turbulent air-sea heat
exchange will be proportional to |U|, Ekman pumping proportional to |U|U
 ,
and wind work proportional to |U|
 .
The SST and 50-m temperature from the equatorial mooring are also shown in Figure
7.
If your browser cannot view the following table correctly,
click this link for a GIF image of Table 1.
TABLE 1. Summary of Means and Standard Deviations for Wind Speed,
Zonal Wind
Pseudostress, Pseudowork, and Sea Surface Temperature From the Current Meter
Mooring at 0°, 165°E for the Period From December 13, 1986, to October 14,
1987
|
|
Wind |
Zonal |
|
|
|
|
Speed |
Pseudostress, |
Pseudowork, |
SST, |
T(50 m), |
|
m s |
m² s |
m³ s |
°C |
°C |
|
| Mean |
4.5 |
9.7 |
184 |
29.2 (29.2) |
(29.0) |
| Standard deviation |
2.0 |
24.8 |
227 |
0.31 (0.22) |
(0.11) |
|
Numbers in parentheses for SST and T(50
m) are statistics for December 13, 1986 to May 31, 1987,
when the surface layer extended to at least 50-m depth. |
Table 1 summarizes
the means and standard deviations of the time series in Figure
7. The mean wind speed is only 4.5 m s and the mean zonal pseudostress is eastward at 9.7 m
 s
s (for a constant C
 of 1.2 × 10
 , this pseudostress translates
into a mean zonal stress of about 0.014 N m
 ).
Standard deviations in both of these variables are also small: 2.0 m s
 for |U| and 24.8 m
 s
s for |U|U
 (equivalent to
0.036 N m
 ). SST is high on average (29.2°C),
with a standard deviation of 0.31°C. Temperature at 50 m is 29.0°C on average,
with a standard deviation two times smaller than the SST standard deviation
during the first part of the record, when 50 m is located in the surface layer.
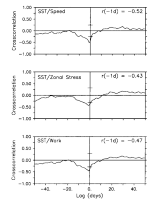
Fig. 8. Cross correlations between SST and wind speed, zonal wind pseudostress,
and wind pseudowork. Cross correlation extrema (r) and the lag (in days)
at which they occur are shown. In each case, the lag indicates that cold SST
follows high winds by 1 day. The 95% confidence limits for the null hypothesis
of uncorrelated variability are indicated by horizontal bars on the abscissa.
Figure 8 indicates the cross correlations of
the three wind constructs with SST are significantly nonzero at the 95% level
of confidence and range between -0.43 (for zonal pseudostress) and -0.52 (for
wind speed). The negative correlation indicates that high wind speed, high wind
work, and westerly wind stress (relative to the mean) are associated with cool
SST; low wind speed, low wind work, and easterly wind stress (relative to the
mean) are associated with warm SST. In each case the maximum cross correlation
occurs with SST lagging the winds by 1 day, consistent with the atmosphere forcing
the ocean on these time scales. Although not presented, the magnitude of the
cross correlation between meridional wind pseudostress and SST is generally
 0.2 over the range of lags shown in Figure
8.
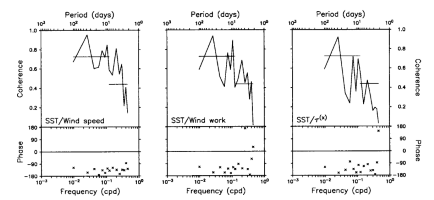
Fig. 9. Coherence and phase spectra for SST and wind speed, zonal wind pseudostress,
and wind pseudowork at 0°, 165°E for the period December 13, 1986, to October
14, 1987. Positive phase indicates that high winds lead high SST, and negative
phase indicates that high winds lead low SST. Horizontal lines superimposed
on coherence estimates indicate 95% confidence limits for the null hypothesis
of incoherent variability, based on five (15) frequency band averages at periods
longer (shorter) than about 8 days.
Another way to view these relationships is in the frequency domain. Figure
9 shows the coherence and phase as a function of frequency between the three
wind constructs and SST. Two bands of high and statistically significant coherence
are evident. These are at periods between approximately 3-8 days and 30-60 days;
to a lesser extent, variations at 10-20 days are also coherent. Consistent with
the cross-correlation statistics, the phase in most frequency bands is between
-90° and -180°, implying that maxima in the winds are followed by cold SST and
minima are followed by warm SST. Coherence at periods shorter than 20 days may
be related to westerly wind burst activity. Coherence at periods of 30-60 days
could be related to atmospheric fluctuations associated with Madden
and Julian [1972] waves.
Note that although there are differences between the coherence and phase diagrams
in Figure 9 and the cross-correlation analysis
summarized in Figure 8, the statistical relationships
of the three wind constructs with SST share many similarities; indeed, wind
speed, zonal wind pseudostress, and wind work are highly correlated among themselves
(0.61-0.90). Hence without further analysis one cannot unambiguously identify
which of the processes related to the wind field are most important in affecting
SST.
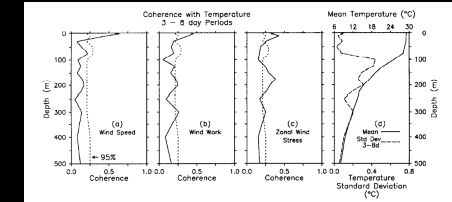
Fig. 10. Coherence amplitude as a function of depth averaged over periods
of approximately 3-8 days (encompassing 36-65 frequency bands depending on depth)
for SST and wind speed, zonal wind pseudostress, and wind pseudowork at 0°,
165°E. The 95% confidence limits for the null hypothesis of incoherent variability
are indicated by the dashed lines. Note that the temperature record lengths
for this analysis were chosen such that the statistics were stationary; for
example, the period June-October 1987 was excluded at 50 m and 75 m. Shown on
the right are the mean temperature profile (solid curve) and the standard deviation
of temperature variations at periods of approximately 3-8 days (dashed curve)
for December 13, 1986, to October 14, 1987.
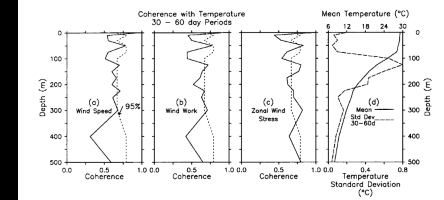
Fig. 11. Coherence amplitude as a function of depth averaged over periods
of approximately 30-60 days (that is 4-6 frequency bands, depending on depth)
for SST and wind speed, zonal wind pseudostress, and wind pseudowork at 0°,
165°E. The 95% confidence limits for the null hypothesis of incoherent variability
are indicated by the dashed lines. Shown on the right are the mean temperature
profile (solid curve) and the standard deviation of temperature variations at
periods of approximately 30-60 days (dashed curve) for December 13, 1986, to
October 14, 1987.
Figure 10 shows coherence amplitude as a function
of depth in the 3- to 8-day period band. Also shown in Figure
10 is the mean temperature profile for December 1986 to October 1987. Wind
speed, wind stress, and wind work are all significantly coherent with temperature
variations between 1 and 10 m. Coherence drops rapidly below these depths, however,
and is statistically insignificant at the 95% level in the lower part of the
surface layer between 50 and 75 m. In the thermocline, wind speed and wind work
are generally incoherent with temperature fluctuations; on the other hand, zonal
pseudostress shows a clear pattern of coherence between 125 and 300 m. The coherence
profiles for the 10- to 20-day and 30- to 60-day period bands are generally
similar to those shown in Figure 10. Figure
11, for example, shows the coherence as a function of depth for wind speed,
zonal pseudostress, and wind work in the 30- to 60-day band. In each case the
coherence is high at the surface, then falls off rapidly to relatively low and/or
insignificant values. Only in the case of zonal pseudostress does significantly
nonzero coherence appear consistently in the thermocline.
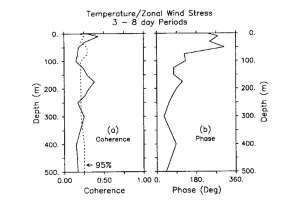
Fig. 12. Coherence amplitude and phase as a function of depth averaged over
periods of approximately 3-8 days (encompassing 36-65 frequency bands, depending
on depth) for SST and zonal wind pseudostress at 0°, 165°E. The 95% confidence
limits for the null hypothesis of incoherent variability are indicated by the
dashed curve.
Figure 12 shows that the phase of zonal pseudostress
coherence in the 3- to 8-day band is such that warm thermocline temperatures
lag relative westerly winds by about 90° and cold thermocline temperatures lag
relative easterly winds by the same amount. This is consistent with the Ekman
pumping hypothesis for thermocline variations discussed in section 4. However,
phase changes by 180° across the base of the surface layer, indicating that
temperature variations are of opposite sign in the surface layer and thermocline.
A similar phase change occurs at lower frequencies as well. Vertical advection
from the thermocline is therefore not likely to be the principal mechanism controlling
SST on these time scales, as was earlier suggested in the discussion of Figure
5a. Likewise, the rapid decrease in coherence with depth below 10
m in Figures 10 and 11
suggests that entrainment from the thermocline is not, in general, important
in controlling SST. One would expect coherence between temperature and |U| to be much higher at 50-75 m if the thermocline were the source of cold water
for the surface layer. This leaves turbulent surface fluxes proportional to
|U| as the most likely candidate for affecting SST and surface layer
heat content.
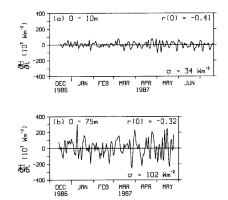
Fig. 13. Time series of  H/
H/ t
for depth ranges of (a) 0-10 m for the period December 13, 1986, to July
20, 1987, and (b) 0-75 m for the period December 13, 1986, to May 31,
1987. The standard deviation of heat content variations (
 )
and cross correlation with wind speed at zero lag (r) are shown.
Further evidence to support the role of wind-related surface turbulent heat
flux variations can be found in an examination of upper ocean heat content (defined
as H = pC hT) from
the 0°, 165°E mooring. Figure 13 shows time series
of
  H/
H/ t
estimated using centered differences over two depth ranges: 0-10 m (where coherence
with the wind speed is highest) and 0-75 m (the average depth of the surface
layer). The calculation for 0-75 m is shown only through the end of May 1987,
because of the nonstationarity of the time series during the second half of
the record when the upper portion of the thermocline reaches depths of 50-75
m (see Figures 3 and 7).
The standard deviation of
t
estimated using centered differences over two depth ranges: 0-10 m (where coherence
with the wind speed is highest) and 0-75 m (the average depth of the surface
layer). The calculation for 0-75 m is shown only through the end of May 1987,
because of the nonstationarity of the time series during the second half of
the record when the upper portion of the thermocline reaches depths of 50-75
m (see Figures 3 and 7).
The standard deviation of  H/
H/ t(
t( )
and the cross correlation at zero lag (r) of
  H/
H/ t
and |U| also appear in Figure 13. For
both depth ranges the cross correlations are significantly nonzero (with 95%
confidence) and are higher than for either pseudostress or for wind work.
Variations in heat content within the 0- to 75-m layer are 102 W m .
Multiplying this number by 0.32, that is, the magnitude of the correlation between
 H/
H/ t and
|U|, indicates that heat content changes of approximately 33 W m
 in the upper 75-m surface layer are due to wind speed variations. This estimate
is comparable to what would be expected for latent heat flux variations based
on (2a) and typical observed parameter
values. Specifically, Q
 35 W m
 for wind speed variations of 2.0 m s
 (Table
1), C
 , of 1.2 × 10
 [Large
and Pond, 1982] and a typical
  q
of 5 g kg
 [Reed,
1985; Liu,
1988].
For comparison, the magnitude of variations in entrainment mixing due to wind
work can be estimated from (1) and (5),
using a scale analysis similar to that for latent heat flux. For |U| of 227 m
 s
s (Table 1), m
= 0.4 [Davis
et al., 1981; McPhaden,
1982], (
 T/
T/ p)
p) = 3°C m
 kg
kg at the base of the surface layer (determined from conductivity-temperature-depth
(CTD) casts near 0°, 165°E), and h = 75 m, we find that
 C
C w
w
 T
T =5 W m
 . Other choices of m, h,
and (
 T/
T/ p)
p) would result in different
estimates of entrainment from the thermocline; however, it is unlikely that
a reasonable combination of these parameters would increase our 5 W m
 estimate by an order of magnitude. Thus we conclude that latent heat flux variations
are significantly more important than wind work-related entrainment fluxes from
the thermocline in controlling SST and surface layer heat content during the
time period of this study.
A comparison of heat content variations over the 0- to 10-m layer and the 0-
to 75-m layer indicates that surface cooling associated with Q converges nonlinearly in the upper 75 m. The product of |r| and
  over the two depth ranges in Figure 13 implies
a standard deviation of 14 W m
 and 33 W m
 for wind-related heat content variations in the upper 10 m and 75 m, respectively.
The 19 W m
 difference between these two
flux estimates represents variability in the depth range 10-75 m. Thus 14 W
m
 (42% of the total) converges in the upper
10 m (13% of the 75-m layer depth) whereas 19 W m
 (58% of the total) converges between 10 and 75 m (87% of the surface layer depth).
Using an integral time scale (t
 )
for wind-speed-related temperature variations of 3-4 days (based on the cross-correlation
analysis in Figure 8) and a
  H/
H/ t
of 14 W m
 (0-10 m) and 19 W m
 (10-75 m), we find the expected magnitude of temperature variations (T ~
t
 r/
r/ C
C h)
associated with latent heat flux variations in each of these depth ranges to
be about 0.1°C and 0.02°C, respectively. The latter temperature is close to
the instrumental accuracy of our temperature sensors [e.g.,
McPhaden et al., 1990] and probably accounts for the insignificant
temperature and wind coherences on a pointwise basis for depths greater than
10 m in the surface layer.
Go to previous or next section
Return to Abstract
PMEL Outstanding Papers
PMEL Publications Search
PMEL Homepage
 ),
and pseudowork (|U|
 ) from the mooring
at 0°, 165°E for December 1986 to October 1987. In each case, estimates were
first computed from hourly data, then averaged to daily values. Ignoring the
weak wind speed dependence of C
 and C
and C for the range of
speeds shown in Figure 7, turbulent air-sea heat
exchange will be proportional to |U|, Ekman pumping proportional to |U|U
 ,
and wind work proportional to |U|
 .
The SST and 50-m temperature from the equatorial mooring are also shown in Figure
7.


 s
s
 0.2 over the range of lags shown in


 H/
H/ )
and cross correlation with wind speed at zero lag (r) are shown.

 35 W m
 q
of 5 g kg
 = 3°C m
 C
C w
w )
for wind-speed-related temperature variations of 3-4 days (based on the cross-correlation
analysis in