U.S. Dept. of Commerce / NOAA / OAR / PMEL / Publications
Variability in the Eastern Equatorial Pacific Ocean During 1986-1988
Michael J. McPhaden and Stanley P. Hayes
NOAA/Pacific Marine Environmental Laboratory, Seattle, Washington
Journal of Geophysical Research, 95(C8), 13,195-13,208 (1990)
Not subject to U.S. copyright. Published in 1990 by the American Geophysical Union.
We examine variability in the eastern equatorial Pacific during 1986-1988
using conductivity-temperature-depth data, velocity and temperature data from
equatorial moorings between 110°W and 140°W, and wind data from a basin scale
zonal array of islands and moorings between 110°W and 165°E. The period studied
coincides with the El Nińo/Southern Oscillation (ENSO) event of 1986-1987 and
a subsequent cold event in 1988. Weak warm sea surface temperature anomalies
first appeared in the eastern equatorial Pacific in mid-1986 and increased to
>1°C in September-November 1986 in association with a 30 cm s weakening of the South Equatorial Current and a 20- to 40-m depression of the
thermocline. These warm anomalies lasted until early 1988, after which a large-scale
shoaling of the thermocline led to sea surface temperatures more than 3°C colder
than climatology. Year-to-year fluctuations in the eastern Pacific were related
primarily to zonal wind variations in the central and western Pacific. Westerly
wind stress anomalies of 0.02-0.05 N m
weakening of the South Equatorial Current and a 20- to 40-m depression of the
thermocline. These warm anomalies lasted until early 1988, after which a large-scale
shoaling of the thermocline led to sea surface temperatures more than 3°C colder
than climatology. Year-to-year fluctuations in the eastern Pacific were related
primarily to zonal wind variations in the central and western Pacific. Westerly
wind stress anomalies of 0.02-0.05 N m were
observed between 140°W and 165°E from the latter half of 1986 until the end
of 1987; these were replaced by easterly wind anomalies of similar magnitude
between 157°W and 165°E in 1988. Energetic intraseasonal fluctuations with periods
of 2-3 months were also prominent in zonal current, temperature, and dynamic
height time series. These fluctuations propagate eastward at approximately first
baroclinic mode Kelvin wave phase speeds and are forced west of the date line
by episodes of westerly winds. Extrema in several oceanic variables occurred
in association with these waves, though their precise dynamical link to the
ENSO cycle is unclear from our data. Sea surface temperature and thermocline
depth anomalies at 0°, 110°W were less pronounced during the 1986-87 ENSO than
during the 1982-1983 ENSO; the Equatorial Undercurrent, though weaker than normal
in early 1987, did not disappear as it did in early 1983.
were
observed between 140°W and 165°E from the latter half of 1986 until the end
of 1987; these were replaced by easterly wind anomalies of similar magnitude
between 157°W and 165°E in 1988. Energetic intraseasonal fluctuations with periods
of 2-3 months were also prominent in zonal current, temperature, and dynamic
height time series. These fluctuations propagate eastward at approximately first
baroclinic mode Kelvin wave phase speeds and are forced west of the date line
by episodes of westerly winds. Extrema in several oceanic variables occurred
in association with these waves, though their precise dynamical link to the
ENSO cycle is unclear from our data. Sea surface temperature and thermocline
depth anomalies at 0°, 110°W were less pronounced during the 1986-87 ENSO than
during the 1982-1983 ENSO; the Equatorial Undercurrent, though weaker than normal
in early 1987, did not disappear as it did in early 1983.
1. Introduction
Kousky
and Leetmaa [1989] have described the planetary scale evolution of the
1986-1987 El Nińo/Southern Oscillation (ENSO) event using satellite data and
general circulation model analyses. Warm sea surface temperature (SST) anomalies
began to develop in the equatorial Pacific Ocean in mid-1986, indicating the
onset of the event. These anomalies persisted throughout 1987, during which
the trade winds weakened in the central and western Pacific and anomalous deep
atmospheric convection developed near the date line. The southern oscillation
index (SOI), which is a measure of the driving force for the Pacific trade winds,
reached its second lowest value in nearly 20 years in mid-1987. (The SOI was
lower only in 1982-1983 during the most intense ENSO of the century.) The 1986-1987
ENSO was over by early 1988, after which the ocean-atmosphere system rebounded
with the coldest equatorial SST anomalies and the highest SOI values since the
mid-1970s [Climate
Analysis Center, 1988].
Plate 1 illustrates the interannual changes
in SST in the tropical Pacific from near-normal conditions in the central and
eastern Pacific in June 1986 (patchy SST anomalies along the equator typically
<1°C in magnitude) to warm ENSO conditions in June 1987 (basin scale warm
SST anomalies of >1°C) to colder than normal conditions in June 1988 (SST
anomalies of -3°C in the eastern equatorial Pacific). The occurrence of warm
ENSO SST anomalies in the equatorial Pacific is associated with a characteristic
global pattern of climatic variability [Ropelewski
and Halpert, 1986, 1987],
and in many respects the global effects of the 1986-1987 ENSO fit this pattern
[Kousky
and Leetmaa, 1989]. In addition, the cold equatorial SST anomalies following
the 1986-1987 ENSO were believed to contribute in part to the severe North American
drought during the summer of 1988 [Trenberth
et al., 1988; Palmer
and Brankovic, 1989]. Understanding the mechanisms responsible for equatorial
SST anomalies is therefore one of the central themes of the Equatorial Pacific
Ocean Climate Studies (EPOCS) program [Hayes
et al., 1986] and the Tropical Ocean-Global Atmosphere (TOGA) program
[National
Academy of Sciences, 1988].
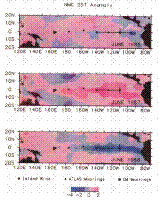
Plate 1. Sea surface temperature anomalies for June 1986, June 1987, and
June 1988 based on analyses from the National Meteorological Center Climate
Analysis Center [Reynolds,
1988]. Superimposed are the locations of time series measurements from current
meter moorings (squares), ATLAS moorings (diamonds), and island wind stations
(circles). Also shown are the locations of CTD sections along the equator and
along 110°W.
The purpose of this study is to describe oceanic variability in the eastern
equatorial Pacific during 1986-1988 using in situ measurements of wind, current,
temperature, and salinity from moored buoys, islands, and research vessels.
It is possible from this description to provide a preliminary, qualitative evaluation
of processes responsible for some of the interannual changes in the current
and hydrographic structure of the eastern equatorial Pacific. A complementary
study [McPhaden
et al., 1990a] discusses variability in the western equatorial
Pacific during 1986-1988.
The paper is organized as follows. Data sources and processing are described in section
2. Some details dealing with data gaps, gridding, and the estimation of mean seasonal
cycles are relegated to appendices for the sake of brevity. Section 3 discusses the
regional scale hydrography of the eastern equatorial Pacific during 1986-1988. Time series
variability at 110°W and 140°W is then described in section 4, and the extent to which
this variability may be remotely versus locally forced is discussed in section 5. Section
6 compares variability in the eastern equatorial Pacific during the 1982-1983 ENSO and the
1986-1987 ENSO, using long time series from 0°, 110°W (Plate
2). The paper concludes with a summary and discussion of the most relevant results in
section 7.
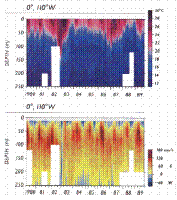
Plate 2. Contour plots of temperature (in degrees Celsius) and zonal velocity
(in centimeters per second) for 1980-1989. Daily data have been gridded according
to procedures described in Appendix A and smoothed to approximately monthly
means using a 51-day filter [Bendat
and Piersol, 1971].
2. Data
The moored time series used in this study consist of current, temperature,
and wind data from the locations shown in Plate
1. These measurements were made from taut wire surface mooring at depths
ranging from 3 to 5 km. The lengths of the moored time series and depths instrumented
for the period 1986-1988 are shown in Figure 1.
The number of depths instrumented with current meters was reduced from seven
to five in boreal fall 1987 in response to changing scientific priorities. Typically,
six additional depths were instrumented with SeaData temperature recorders (TRs).
Data gaps during 1986-1988 were filled where appropriate according to procedures
outlined in Appendix A in order to facilitate analysis. The data distribution
for times prior to 1986 (used to generate Plate
2 and to compile mean seasonal cycles, as discussed in Appendix B) is given
by Halpern
[1987a], Halpern
et al. [1988], and McPhaden
and Taft [1988].
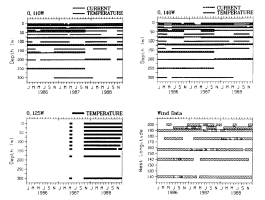
Figure 1. Record lengths of daily time series from moorings and island wind
stations.
The current meter moorings were equipped with EG&G model 610 vector averaging
current meters (VACMs) and vector measuring current meters (VMCMs) in the upper
250 m. The difference between VACM and VMCM measurements is generally <5
cm s [Halpern,
1987b], so for the purposes of this study they can be considered
as interchangeable. Temperature and velocity data were recorded at 15-min intervals
and then processed to daily averages. Instrumental accuracy of the VACM and
TR temperature sensors is approximately 0.01°C and 0.05°C, respectively. SST
is measured 1 m below the surface using either a Yellow Springs Instrument (YSI)
model 44032 temperature sensor (calibrated accuracy of 0.01°C) or a YSI model
44204 temperature sensor (calibrated accuracy of 0.05°C). Additional information
on the processing of data from equatorial current meter mooring is given by
Freitag
et al. [1987].
Winds from the equatorial current meter mooring were sampled 4 m above the
mean water line on the surface toroid with either a vector averaging wind recorder
(VAWR) or an Argos meteorological platform (AMP). The VAWR is an inverted VACM
equipped with a Climet cup model 011-2B three-cup anemometer and pivoted vane
[Freitag
et al., 1989]. The AMP was designed at Pacific Marine Environmental
Laboratory (PMEL) to transmit data in real time and is equipped with an R.M.
Young model 05103 propeller and vane. Predeployment and postdeployment calibrations
for the VAWR and AMP indicate expected instrumental errors in wind speed of
about 0.1 m s. Comparison of the two wind
systems in a field experiment near 0°, 140°W suggests that for our purposes
the cup and vane and the propeller and vane systems can be considered interchangeable
[Freitag
et al., 1989].
The 0°, 125°W and 2°S, 165°E moored data used in this study were collected
with ATLAS (autonomous temperature line acquisition system) thermistor chains.
ATLAS [Milburn
and McClain, 1986] is a taut wire surface mooring which measures winds,
air temperature, SST, and 10 subsurface temperatures to a maximum depth of 500
m. Winds are measured using an R.M. Young model 05103 propeller and vane assembly.
Thermistors are calibrated prior to deployments to an accuracy of about 0.005°C;
in situ comparisons with nearby conductivity-temperature-depth (CTD) casts indicate
a long-term accuracy of better than 0.1°C. Data are telemetered to shore via
Service Argos as 2-hour averages (or in some cases 1-hour averages). Normally,
five unique data transmissions are received each day. The basic time series
is taken to be daily averages of these data.
Winds are measured at Nauru (0°32 S, 166°54E), Baker (0°12N, 176°29W), and Christmas (1°59N,
157°29W) islands from an R.M. Young model 05103
propeller and vane anemometer mounted on a tower 10 m above the ground. Anemometers are
replaced every 6 months to 1 year and are calibrated prior to deployment to within 0.2 m s. Data are vector averaged for 40 min of each hour, and
then three individual hourly samples are transmitted to shore via GOES geostationary
satellite. Data are processed to daily means for this study.
S, 166°54E), Baker (0°12N, 176°29W), and Christmas (1°59N,
157°29W) islands from an R.M. Young model 05103
propeller and vane anemometer mounted on a tower 10 m above the ground. Anemometers are
replaced every 6 months to 1 year and are calibrated prior to deployment to within 0.2 m s. Data are vector averaged for 40 min of each hour, and
then three individual hourly samples are transmitted to shore via GOES geostationary
satellite. Data are processed to daily means for this study.
Nauru winds tend to underestimate the amplitude of variations at the 0°, 165°E
mooring site during periods of westerlies [McPhaden
et al., 1988, 1990a]
when the wind sensor, located on the northeast side of the island, is in the
lee of a 40-m hill. Nonetheless, there is a high correlation between daily time
series at the two locations for the period December 1986 to October 1987 (0.88
for zonal winds and 0.85 for meridional winds), so that Nauru winds can be used
as an index for winds at the mooring site during the ENSO event. Nauru winds
are a more exact indicator of open ocean conditions during periods of easterlies
as occurred during early 1986 and during 1988.
CTD data were collected from National Oceanic and Atmospheric Administration
(NOAA) research vessels using a Neil Brown Instrument Systems Mark III CTD along
the transacts indicated in Plate 1. Stations
were occupied approximately every 5° of longitude and 1° in latitude during
spring and fall cruises each year. Casts were made to at least 1000 dbar and
processed to 1-dbar resolution. Lynch
et al. [1988] describe the acquisition and processing of these data
in greater detail.
Moored temperature data were used to calculate surface dynamic height relative
to 250 dbar. To estimate salinity in the dynamic height calculation, we used
a mean temperature-salinity profile based on 17 CTDs at 125° and 140°W and 44
CTDs at 110°W. Figure 2 shows the dynamic height
time series and individual dynamic height estimates based on eight CTD casts
at 110°W and six CTD casts at 140°W. The rms difference between daily averaged
dynamic heights estimated from moorings and from the hydrocast calculations
is 1.0 dynamic centimeters (dyn. cm) (110°W) and 2.0 dyn. cm (140°W). These
are comparable to the 0-/500-dbar rms differences found by Emery
and Dewar [1982] from historical data. Also, 0-/250-dbar dynamic height
variations at 110°W (140°W) were only 1% (2%) weaker than 0-/1000-dbar variations
estimated from the eight (six) available CTD casts.
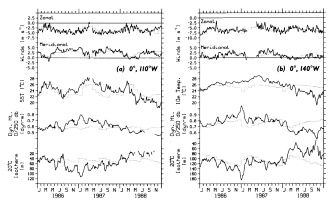
Figure 2. Zonal wind, meridional wind, sea surface temperature, dynamic height 0/250
dbar, and 20°C isotherm depth at (a)0°, 110°W and (b) 0°, 140°W.
Temperature at 10 m has seen substituted for the more gappy sea surface temperature record
at 140°W, since the two time series typically agree with one another to within about
0.1°C. Daily data have been smoothed with an 11-day Hanning filter. Superimposed on the
time series are estimates of the monthly mean seasonal cycle based on mooring data.
Dynamic heights of 0/250 dbar from CTD casts are also indicated (triangles).
Mean seasonal cycles have been estimated from monthly averaged mooring data
at 100°W and 140°W and plotted in Figures 2,
3, 4, 5,
8, and 10. Appendix
B describes the derivation and comparison of these climatologies with Reynolds'
[1988] SST climatology and Wyrtki
and Meyers' [1975] wind climatology. Uncertainties in the estimates
of climatological monthly means from the moorings are about 1°C (SST), 10 m
(20°C isotherm depth), 4 dyn. cm (dynamic height), 20 cm s
(zonal currents), and 1 m s (winds). Thus,
when discussing anomalies from the mean seasonal cycles in the following sections,
we will focus on those variations persisting longer than 1 month in excess of
the values quoted above.
3. Hydrography
Plate 3 shows meridional temperature sections
between 5°N and 5°S along 110°W from six approximately semiannual EPOCS cruises.
The May-June 1986 section shows conditions during boreal spring near the onset
of the ENSO. Minimum SSTs at the surface near 24°C are centered at 0.5°S, and
there is a pronounced weakening of the equatorial thermocline associated with
the presence of a geostrophically balanced Equatorial Undercurrent in the upper
100 m [e.g.,
Picaut et al., 1989]. By October-November 1986, surface temperatures
poleward of about 2°N and 2°S have cooled by about 1°C, whereas SST near the
equator is still near 24°C. The lack of significant seasonal cooling near the
equator indicates the presence of anomalously warm water associated with the
developing ENSO. Weakening of the thermocline near the equator is still evident
in October-November, though the upper thermocline (as measured, for example,
by the depth of the 20°C isotherm) has been depressed by about 50 m between
about 2°N and 2°S.
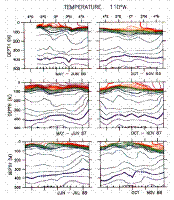
Plate 3. Meridional CTD temperature sections along 110°W during 1986-1988. Contour
interval is 1°C. Warmest temperatures are in magenta (>25°C); coldest temperatures
are in blue ( 10°C). Intermediate temperatures are in
orange (21°-25°C), green (16°-20°C), and aquamarine (11°-15°C).
10°C). Intermediate temperatures are in
orange (21°-25°C), green (16°-20°C), and aquamarine (11°-15°C).
Anomalous warming continues into 1987, with temperatures in May-June 1987 3°-4°C
warmer in the upper 50 m than during May-June 1986. Moreover, no pronounced equatorial SST
minimum appears in the May-June 1987 section, and the thermocline is 20-40 m deeper
relative to the previous spring. From boreal spring to boreal fall 1987, significant
seasonal cooling occurs south of 4°N, and an equatorial minimum in SST <24°C that is
centered near 0.5°S develops. As compared to the fall of 1986, a sharp SST front can be
found to the north of the equatorial SST minimum, and the thermocline near the equator is
slightly shallower.
Both 1988 sections show an equatorial SST minimum that is several degrees Celsius
colder than either of the previous 2 years. In particular, the difference between the
May-June 1987 and June-July 1988 minima is 7°C in the center of the cold tongue near
0.5°S. A well-developed SST front is evident north of the equator in both spring and fall
1988. As compared to 1986-1987, the thermocline is much shallower, and there is less
evidence for a weakening of the equatorial thermocline, especially in fall 1988.
Variations in thermal structure below the upper 150-200 m can also be seen
in these sections. For example, deeper isotherms such as the 10°C isotherm undergo
50- to 100-m excursions, most notably near 5°N. It is probable that some of
this variability is related to the 1986-1987 ENSO and the 1988 cold event, given
the importance of low baroclinic mode equatorial waves in the dynamics of interannual
variability [e.g.,
Busalacchi and Cane, 1985].
Plate 4 shows zonal sections of temperature
along the equator during 1986-1988. The tendency for equatorial SST warming
from 1986 to 1987 and cooling from 1987 to 1988 at 110°W is evident at all longitudes
between 110°W and 140°W. Similarly, the interannual rise and fall of the thermocline
at 110°W ( Plate 3) is evident to the west
of 110°W. The thermocline in all cases is deeper near the western terminus of
the sections than at the eastern terminus, though its slope is not monotonic
from east to west. In 1988, for example, the thermocline undulates with an approximately
1000-km wavelength, which, though barely resolved with the 5° CTD zonal resolution,
indicates a return of 20- to 30-day instability waves that are typically suppressed
during ENSO [Philander
et al., 1985]. These waves are characteristically associated with 100
cm s peak-to-peak meridional velocities
[Halpern
et al., 1988] whose zonal scale sets the pattern of temperature variations
both in the thermocline and at the surface via meridional advection [e.g.,
Pullen et al., 1987].
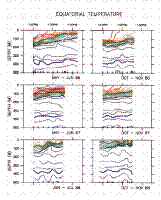
Plate 4. Equatorial CTD temperature sections during 1986-1988. Contours are as in Plate 3.
Plate 5 shows the salinity sections corresponding
to Plate 4. A prominent feature of these sections
is the subsurface salinity maximum (>35 practical salinity units (psu)) in
1986-1987 near depths of 100 m. This maximum is typically located in or just
above the core of the Equatorial Undercurrent in the central and eastern Pacific
[McPhaden,
1985; Mangum
et al., 1986] and has been interpreted in terms of eastward advection
of high-salinity southern hemisphere subtropical waters by the Undercurrent
[Tsuchiya,
1968; Lukas,
1985]. High-salinity water penetrates further to the east in boreal
spring 1986 and 1987 consistent with the seasonal cycle of zonal flow in the
Undercurrent (Plate 2, lower panel; see also
Halpern
[1987a]). However, there is a clear freshening of the thermocline
from 1987 to 1988 by 0.2-0.4 psu across 110°-140°W. The appearance of relatively
fresh water in the eastern Pacific in 1988 coincides with a relatively shallow
thermocline along the equator (Plate 4) and
weak isothermal spreading near the equator at 110°W. Direct velocity measurements
discussed below (Figures 4 and 5)
show 1988 to be a period of weaker than normal eastward flow in the Undercurrent
at 110°W.
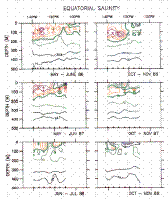
Plate 5. Equatorial CTD salinity sections during 1986-1988. Contour interval is 0.1
psu. Saltiest water is in magenta ( 35.3 psu); freshest
water is in blue ( 34.6 psu). Intermediate salinities are
in orange (35.1-35.2 psu), green (34.9-35.0 psu), and aquamarine (34.7-34.8 psu).
35.3 psu); freshest
water is in blue ( 34.6 psu). Intermediate salinities are
in orange (35.1-35.2 psu), green (34.9-35.0 psu), and aquamarine (34.7-34.8 psu).
Plate 5 also shows alternating pockets of
high and low salinity near the surface with peak-to-peak amplitudes of about
0.3 psu at about 500-km intervals. They are most apparent in 1988, and like
the thermocline and SST undulations on similar zonal scales (Plate
4), they are associated with the presence of energetic instability waves.
The oscillating salinity pattern is set by meridional advection of a salinity
front which separates relatively fresh water (>35 psu) north of the equator
from relatively saline water south of the equator [McPhaden
et al., 1990b]. Salinity variations below about 200 m, on the
other hand, show little variability (<0.2 psu) over the 3-year sequence in
Plate 5.
4. Temporal Variations at 110°W and 140°W
4.1 Winds
Figure 2 shows time series of winds, SST, dynamic
height 0/250 dbar, and 20°C isotherm depth at 110°W and 140°W. The zonal winds
at both locations tend to follow the normal seasonal cycle of strong southeasterlies
in the latter half of the year and weak southeasterlies in boreal spring. However,
easterly winds were weaker by about 1 m s
at 140°W in 1987 and stronger by a similar amount at 110°W from January to July
1987. Meridional winds also tend to be stronger from the south in 1986-1987
during the ENSO and weaker from the south during 1988. The variations in local
meridional wind component may be due in part to enhanced (reduced) vertical
mixing in the atmospheric boundary layer during periods of warm (cold) equatorial
SST anomalies. As Wallace
et al. [1989] have shown, northward wind speed just 100 m above sea
level in the eastern equatorial Pacific are more than twice as strong as at
the surface. Wallace
et al. and Hayes
et al. [1989] have argued that SST variations near the equator affect
the stability of the atmospheric boundary layer and therefore the efficiency
with which momentum aloft is mixed down to the surface.
4.2 Sea Surface Temperature
SST at both locations was near normal for the first 4 months of 1986, followed by a
weak anomalous warming during May-July. Persistent anomalies of >1°C then developed in
September 1986 at both 110°W and 140°W and lasted until January-February 1988. The
warmest SST anomalies occurred at 110°W in September 1987 (+3.4°C) and at 140°W in June
1987 (+3.0°C). Cold anomalies developed abruptly in early 1988 following the ENSO. From
March to May 1988, SST dropped nearly 8°C at 110°W, and in April 1988, SST dropped 4°C
at 140°W. Subsequently, 2°-3°C cold anomalies persisted throughout 1988, with the
coldest anomalies at 110°W in December 1988 (-3.7°C) and at 140°W in November 1988
(-4.0°C).
The development of these anomalies is not obviously related to the local zonal winds.
Coincident with the warm SST anomalies in 1986 and 1987, the zonal wind component was
either close to or weaker than normal at 140°W, whereas it was close to or stronger than
normal at 110°W. A consistent argument in terms of anomalous Ekman divergence and local
upwelling is not possible for both locations. Also, the precipitous drop in SST in the
spring of 1988 occurred at a time when the local zonal winds were near normal, again
ruling out anomalous local Ekman divergence as the causative mechanism.
4.3 Dynamic Height and 20°C Isotherm Depths
Surface dynamic height and the depth of the 20°C isotherm (which is an index
for the depth of the thermocline) tend to be mirror images of one another at
110°W and 140°W, similar to what Rebert
et al. [1985] found throughout the equatorial Pacific. The mean seasonal
cycle in both variables is dominated by the annual and semiannual harmonics
with an annual range in dynamic height of 5 dyn. cm (110°W) and 13 dyn. cm (140°W)
and an annual range in 20°C isotherm depth of 19 m (110°W) and 42 m (140°W).
In contrast, we note that during 1986-1988, variability is dominated by an interannual
rise in the dynamic height from 1986 to 1987 and subsequent drop into 1988,
and an intraseasonal variation with periods of 2-3 months. The amplitude range
of both these time scales is larger than the annual range. The 20°C isotherm
depth, for example, shoaled by over 100 m at 110°W from January 1987 to June
1988 when it broke the surface; similarly, the 20°C depth ranged between 180
m and 0 m at 140°W from 1987 to 1988. These changes and similar ones in dynamic
height are large enough to obscure the mean seasonal cycle in these variables
during 1986-1988.
On interannual time scales there is a tendency for warm SST anomalies to correspond to
high surface height and depressed thermocline, and vice versa. This is most evident at
110°W, where the mooring climatologies (and therefore anomalies) are better defined. For
example, persistent warm anomalies, elevated dynamic heights, and depressed 20°C isotherm
depths develop in September 1986 and last until late 1987 to early 1988. Similarly, cold
SSTs in March-May 1988 set in with a 40-m rise in the depth of the 20°C isotherm and a 10
dyn. cm drop in dynamic height. As with SST, the interannual changes in dynamic height and
20°C isotherm depths cannot be simply related to local zonal wind variations.
Much of the intraseasonal variability with periods of 2-3 months in Figure
2 is due to the excitation of first baroclinic mode Kelvin waves. McPhaden
and Taft [1988] discussed these wave time series spanning 110°-140°W
for the period November 1983 to June 1986, the last 5 months of which overlaps
with the present study. They found a nearly in-phase relationship of zonal velocity,
thermocline temperature, and dynamic height which propagated eastward at approximately
210 cm s. The eastward phase propagation
can be seen visually in Figure 3a for
dynamic height 0/250 dbar and in Figure 3b
for dynamic height 80/250 dbar (in the thermocline near the mean position of
the Equatorial Undercurrent core). Well-defined peaks and troughs at 140°W lead
those at 110°W by about 2 weeks, implying phase speeds in approximate agreement
with those reported by McPhaden
and Taft [1988]. One can also see the expected Kelvin wave relationship
between zonal currents and 20°C isotherm depths by comparing Figures
2a and 4. The 2- to 3-month periodicity
is most apparent in zonal currents in the thermocline at depths below the Undercurrent
core where the seasonal cycle and the 20- to 30-day instability waves are of
diminished amplitude. By overlaying the 20°C isotherm depth time series in Figure
2a and the zonal currents at, say, 120 m in Figure
4, one would find that on intraseasonal time scales a depression of the
thermocline corresponds to enhanced eastward velocity and vice versa. This is
also evident in the decadal time series shown in Plate
2. There is no obvious evidence in the local winds for the energetic 2-
to 3-month periods observed in the oceanic data sets (Figure
2), implying that the variability must be nonlocally forced as previously
inferred by Enfield
[1987] and McPhaden
and Taft [1988].

Figure 3. Time series of dynamic height (a) at the surface relative
to 250 dbar and (b) at 80 dbar relative to 250 dbar. The 0°, 125°W time
series is indicated by a dashed line for clarity. Also shown are the dynamic
height differences over 110°-140°W superimposed on the mean seasonal cycle of
dynamic height difference. Wind stress at 0°, 165°E (solid line) and 2°, 165°E
(dashed line) appear in Figure 3a superimposed
on the Wyrtki
and Meyers [1975] stress climatology. Daily data have been smoothed
with an 11-day Hanning filter.
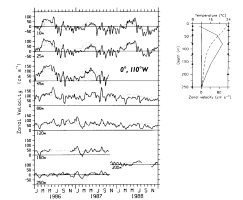
Figure 4. Time series of zonal velocity in the upper 250 m superimposed on estimates
of the monthly mean seasonal cycle. Daily data have been smoothed with an 11-day Hanning
filter. Shown at night are the depths of the velocity measurements relative to the 5-year
mean profile of zonal velocity (solid line) and temperature (dashed line). Depths on the
ordinates are for January 1986 to October 1987 (left) and October 1987 to October 1988
(right).
Figure 3 also shows the difference between dynamic
height at 110°W and 140°W, which is proportional to the zonally averaged zonal
pressure gradient across these longitudes. The mean seasonal cycle indicates
dynamic height differences at the surface (0/250 dbar) and in the thermocline
(80/250 dbar) that are weakest in the spring and strongest in the fall, in approximate
balance with the mean seasonal cycle of zonal wind stress [McPhaden
and Taft, 1988]. During 1986-1988, dynamic height differences are modulated
by intraseasonal wave activity with peak-to-peak amplitudes larger than the
annual range. There are in fact a few occasions of  1 month duration when the height difference across 110°W-140°W nearly vanishes
because of these waves. Height differences vary interannually as well across
110°W-140°W: magnitudes are larger than normal in 1986 and smaller than normal
in 1988, during which near-zero values are observed for several consecutive
months in the thermocline in the early part of the year.
1 month duration when the height difference across 110°W-140°W nearly vanishes
because of these waves. Height differences vary interannually as well across
110°W-140°W: magnitudes are larger than normal in 1986 and smaller than normal
in 1988, during which near-zero values are observed for several consecutive
months in the thermocline in the early part of the year.
Dynamic height differences on a smaller zonal scale can be inferred from additional
data at 0°, 125°W during 1987-1988. Differences are generally smaller between 110°W and
125°W than between 125°W and 140°W, and there are periods of 1 month when the 0-/250-dbar and 80-/250-dbar surfaces are 1-2
dyn. cm higher at 110°W than at 125°W. This is consistent with the zonal variations in
thermocline slope along the equator in 1988 as seen in Plate
4 and implies a weaker driving force for the Equatorial Undercurrent at 110°W as
compared to 140°W.
4.4 Undercurrent Variations
Figure 4 shows time series of zonal velocity in the
upper 200-250 m at 110°W. The location of the current meters relative to the mean current
and temperature structure at 110°W is shown at night. There is a significant amount of
20- to 30-day instability wave energy in these time series which tends to obscure
lower-frequency fluctuations. However, two periods of pronounced Equatorial Undercurrent
weakening are evident. The first is February-March 1987 in the upper 250 m when flow is on
average 25-50 cm s weaker than normal; the second is
December 1987 to December 1988 at 80-120 m (in and below the mean depth of the
Undercurrent core) when flow is 20-25 cm s weaker than
normal. In part these reductions in eastward flow at fixed levels are due to vertical
excursions of the thermocline in which the Undercurrent is embedded (compare the upper and
lower panels of Plate 2). Depression of the thermocline
in early 1987 leads to anomalously westward flow above the Undercurrent core, whereas
elevation of the thermocline in 1988 leads to anomalously westward flow below the
Undercurrent core. However, these westward flow anomalies are not entirely compensated by
eastward flow anomalies below the Undercurrent core in early 1987 or above the
Undercurrent core in 1988, as would be expected if vertical displacements were the only
influence on the velocity records. Thus there is a large net reduction in transport per
unit width during February-March 1987 and during 1988 relative to the normal seasonal
cycle at 110°W (Figure 5a). The prolonged reduction
in 1988 moreover is consistent with diminished isothermal spreading in the thermocline
near the equator (Plate 3), and diminished zonal pressure
gradient at the surface and in the thermocline (Figure 3).
At 140°W in contrast, the transport per unit width is near normal during most of 1988 (Figure 5b), possibly due to the presence of stronger
zonal pressure gradients in the thermocline between 140°W and 125°W vis-ŕ-vis between
125°W and 110°W, as suggested by Plate 4 and Figure 3b.
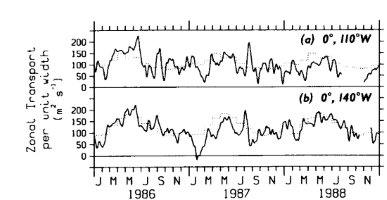
Figure 5. Zonal transport per unit width (10-200 m) at (a) 0°, 110°W and (b)
0°, 140°W superimposed on estimates of the monthlv mean seasonal cycle. Daily data have
been smoothed with an 11-day Hanning filter.
The reduction in Equatorial Undercurrent speed and eastward transport at 110°W
in February-March 1987 is mirrored in an even more dramatic collapse of eastward
transport in the upper 200 m at 140°W about 1 month earlier (Figure
5b). This collapse roughly coincides with the dynamic height trough
associated with the strongest cycle of intraseasonal wave variability during
1986-1988. Figures 6 and 7
show the vertical profiles of velocity and temperature for February 1987, which
is the period bracketed by the minimum transports at 110°W and 140°W. Also plotted
are February profiles for 1983-1988 at 110°W and 1984-1988 at 140°W. It is clear
that February 1987 zonal currents are the weakest of the 5 to 6-year period
shown in Figures 6 and 7,
with the exception of February 1983 at 110°W during the previous ENSO when the
Undercurrent disappeared [Halpern,
1987a]. The Undercurrent does not disappear during the 1986-1987
ENSO, but in February 1987 it is significantly reduced in speed especially at
140°W, where its core velocity is only 45 cm s
. It is also evident that this reduction is not due to a meridional advection
of the Undercurrent off the equator. Average meridional velocities in February
1987 are near zero in the thermocline and are not significantly different from
the meridional velocities during other years.

Figure 6. Profiles of monthly mean zonal velocity, meridional velocity, and
temperature in the upper 250 m for each February from 1983 to 1988 at 0°, 110°W.
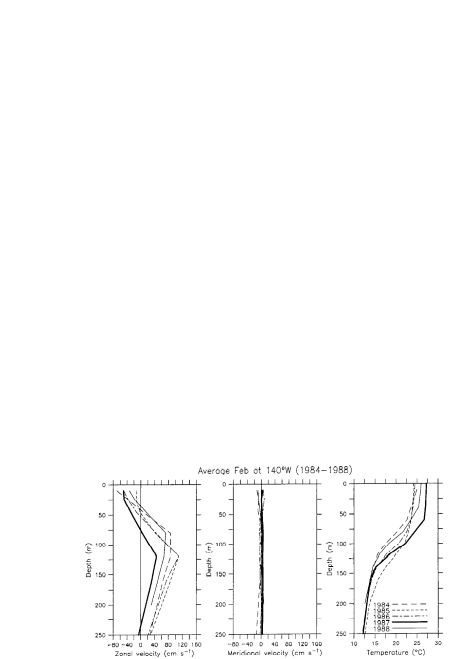
Figure 7. Profiles of monthly mean zonal velocity, meridional velocity, and
temperature in the upper 250 m for each February from 1984 to 1988 at 0°, 140°W.
4.5 Relationship of Zonal Currents to Surface Temperature
Typically at 110°W, flow at 10 m is eastward from March to June (the springtime
reversal of the South Equatorial Current) and westward the remainder of the year ( Figure 4). However, in 1986 the springtime reversal in
March-June is 31 cm s stronger to the east, and the
South Equatorial Current in September-November is 32 cm s weaker to the west. (See Figure
10 for low-pass versions of 10-m zonal currents and SST at 110°W.) Both these periods
correspond to periods of enhanced eastward transport as well (
Figure 5a).
The stronger than normal springtime reversal occurs when the magnitude of the
zonal SST gradient is typically weakest along the equator (e.g., - T/x
~ 0.2-0.3 × 10
T/x
~ 0.2-0.3 × 10 °C m
during boreal spring between 110°W and 140°W based on Reynolds'
[1988] climatology), so that one might expect anomalous advective warming
during this time of <1°C. Consistent with this, the observed SST anomaly
was 0.5°C during March-June 1986 at 110°W; allowing for a 1-month lag in response
to changing zonal currents, the anomaly was 0.7°C during April-July 1986. These
are of questionable significance given the uncertainties in estimating anomalies
as discussed in section 2 and Appendix B. Conversely, during the boreal fall,
SST gradients along the equator between 110°W and 140°W are typically strongest
(i.e., -T/x
~ 0.8-1.0 × 10 °C m).
At 32 cm s zonal current anomaly acting
on a gradient of this magnitude for 3 months would produce a warm SST anomaly
of approximately 2°C, comparable to the average 1.4°C (1.3°C) anomaly actually
observed in September-November (October-December) 1986. These observations are
consistent with the model results of Harrison
and Schopf [1984], who argued that advective warming in the eastem Pacific
by anomalous currents should be more pronounced in boreal fall than in boreal
spring because of the relative strength of the zonal SST gradients during these
seasons. Note also that in boreal fall 1986, anomalously weak westward flow
was accompanied by a thermocline depression of 20-40 m at 110°W (Figure
2a). Hence local upwelling, which would continue unabated because
of near-normal local easterlies, would bring warmer water to the surface and
contribute to the development of SST anomalies. A similar sequence of events
occurred at 140°W in 1986 (not shown), with weaker than normal westward flow
in the South Equatorial Current and a deeper than normal thermocline associated
with the development of SST anomalies of >1°C.
°C m
during boreal spring between 110°W and 140°W based on Reynolds'
[1988] climatology), so that one might expect anomalous advective warming
during this time of <1°C. Consistent with this, the observed SST anomaly
was 0.5°C during March-June 1986 at 110°W; allowing for a 1-month lag in response
to changing zonal currents, the anomaly was 0.7°C during April-July 1986. These
are of questionable significance given the uncertainties in estimating anomalies
as discussed in section 2 and Appendix B. Conversely, during the boreal fall,
SST gradients along the equator between 110°W and 140°W are typically strongest
(i.e., -T/x
~ 0.8-1.0 × 10 °C m).
At 32 cm s zonal current anomaly acting
on a gradient of this magnitude for 3 months would produce a warm SST anomaly
of approximately 2°C, comparable to the average 1.4°C (1.3°C) anomaly actually
observed in September-November (October-December) 1986. These observations are
consistent with the model results of Harrison
and Schopf [1984], who argued that advective warming in the eastem Pacific
by anomalous currents should be more pronounced in boreal fall than in boreal
spring because of the relative strength of the zonal SST gradients during these
seasons. Note also that in boreal fall 1986, anomalously weak westward flow
was accompanied by a thermocline depression of 20-40 m at 110°W (Figure
2a). Hence local upwelling, which would continue unabated because
of near-normal local easterlies, would bring warmer water to the surface and
contribute to the development of SST anomalies. A similar sequence of events
occurred at 140°W in 1986 (not shown), with weaker than normal westward flow
in the South Equatorial Current and a deeper than normal thermocline associated
with the development of SST anomalies of >1°C.
Zonal current anomalies at 10 m are less obviously related to SST anomalies
at other times during 1986-1988. In particular, rapid cooling that occurs during
the termination of the warm event in early 1988 coincides with a near-normal
eastward springtime reversal at 110°W and 140°W (Figures
4 and 10). At 110°W the reversal starts late
but finishes strong such that the eastward flow from March to June 1988 is within
1 cm s of the mean seasonal average. Thus
SST cooling of nearly 8°C from March to May at 110°W cannot be due to surface
zonal advection, which would tend to produce weak warming. It is more likely
that uplift and entrainment of thermocline waters into the surface layer as
suggested by the rapid coincidental shoaling 20°C isotherm in Figure
2 is the mechanism generating anomalously cold SSTs in early 1988. This
upwelling may in part be related to the anomalous zonal convergence in eastward
mass transport that develops in early 1988 between 110°W and 140°W (Figure
5). In the mean, the equatorial SST minimum is maintained by eastward transport
of cold thermocline water which is continuously upwelled and transported poleward
in the surface layer [Bryden
and Brady, 1985]. Mass continuity requires that anomalous zonal convergence
be balanced by enhanced divergence on the meridional plane, which could intensify
this upwelling circulation and lead to additional surface cooling. Consistent
with this hypothesis, the coldest SST anomalies in 1988 were found between 110°W
and 140°W as, for example, can be seen in the June 1988 chart shown in Plate
1.
5. Basin Scale Forcing
In the preceding section it was suggested that much of the variability observed
in the eastern equatorial Pacific during 1986-1988 could not be explained solely
in terms of local wind forcing. We explore this issue in more detail by examining
time series of wind stress from six locations along the equator spanning 110°W
to 165°E. Stress has been calculated assuming a drag coefficient of 1.2 × 10 [Large
and Pond, 1981] and air density of 1.2 kg m.
The mooring wind time series have been adjusted to 10 m anemometer height assuming
a neutral stability, constant stress layer.
[Large
and Pond, 1981] and air density of 1.2 kg m.
The mooring wind time series have been adjusted to 10 m anemometer height assuming
a neutral stability, constant stress layer.
Figure 8 shows the zonal wind stress component
overplotted on the mooring climatologies (110°W and 140°W) and the Wyrtki
and Meyers [1975] stress climatology (165°E, Nauru, Baker, and Christmas
islands). The 165°E time series (which is also plotted in Figure
3) shows westerly or anomalously weak easterly winds for most of mid-1986
to early 1988. This is followed by anomalously strong easterly wind stresses
of up to 0.05 N m during March-December
1988. The winds in 1986-1987 are also frequently punctuated by episodes of strong
westerlies lasting 10 days to 2 months, most notably in May 1986, November-December
1986, and June-July 1987. Variations on both these intraseasonal time scales
and on interannual time scales exceed those for the mean seasonal cycle, which
has a range of only 0.03 N m at this location.
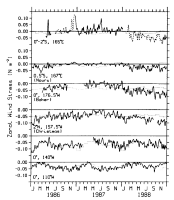
Figure 8. Time series of zonal wind stress at various locations in the equatorial
Pacific. Data at 165°E are from 0° (solid line) and 2°S (dashed line). Superimposed
are estimates of the monthly mean seasonal cycle from Wyrtki
atid Meyers [1975] for Nauru, the moorings at 165°E, Baker, and Christmas.
Mooring mean seasonal cycles are overplotted on the 140°W and 110°W time series.
Daily data have been smoothed with an 11-day Hanning filter.
The remote response to the May 1986 wind burst has been discussed by Miller
et al. [1988], McPhaden
et al. [1988, 1989],
and Harrison
and Giese [1989]. The May westerly wind burst excited a Kelvin wave
which could be traced all the way to the South American coast. Its signature
may be seen in the dynamic height time series in Figure
3, in the current time series in Figure 4,
and in the transport time series in Figure 5.
Eastward propagating pulses in dynamic height appear at other times as well,
as, for example, following the November-December 1986 and June-July 1987 westerly
wind events. In each case the time lag between the maximum wind stress and maximum
dynamic height at 140°W implies a zonal phase speed of approximately 2-3 m s,
comparable to first baroclinic mode Kelvin wave phase speeds along the equator.
Figure 8 shows that pronounced westerly wind
events are confined to west of the date line. However, lower-frequency interannual
variations are not. In particular, a weakening of the easterlies can be seen
as far west as 140°W in 1987, and stronger than normal easterlies prevail between
165°E and 157°W in 1988. To highlight the large-scale interannual variations,
we computed monthly averaged wind anomalies in both the meridional and zonal
directions and then smoothed them with a 1-2-1 filter in time. The results are
shown in Figure 9. As discussed in Appendix B,
the Wyrtki
and Meyers [1975] climatology is weaker at 110°W and 140°W than the
mooring climatologies. Hence, if Figure 9 were
plotted using the Wyrtki and Meyers stress climatology at all locations, 110°W
and 140°W would show stronger easterly anomalies and weaker westerly anomalies.
Also recall that westerly winds are underestimated at Nauru because of topographic
shielding.
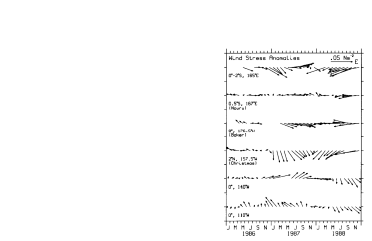
Figure 9. Monthly mean vector wind stress anomalies corresponding to the time series
in Figure 8.
Figure 9 shows that easterlies were stronger than normal
by about 0.01-0.02 N m between 167°E and 157°W in
early 1986. Then in mid-1986, westerly anomalies of similar magnitude developed at 165°E,
Nauru, and Baker islands; at 165°E these anomalies intensified to nearly 0.05 N m during the November-December 1986 westerly wind event.
During 1987, westerly anomalies of 0.02 N m could be found between 165°E and 140°W, the largest of
which (0.05 N m) occurred between 165°E and 176°W.
Westerly anomalies diminished in late 1987 and were replaced by easterly anomalies which
persisted until the end of 1988 between 165°E and 157°W.
It is interesting that the largest zonal wind stress anomalies at 110°W tend
to be directed opposite to those in the central Pacific during 1987-1988. Specifically,
when the winds are anomalously westerly (easterly) in 1987 (1988) at Nauru,
Christmas, and Baker islands, the winds at 110°W are anomalously easterly (westerly).
The distribution of zonal winds along the equator in 1987 is similar to that
documented by Rasmusson
and Carpenter [1982] during the mature phase of their composite El Nińo.
These zonal variations in this wind field may be related to east-west displacements
of the "Walker cell," a thermally direct atmospheric circulation on
the equatorial place driven by SST-induced heating [Gill,
1982]. A detailed analysis of the relationship between surface winds, SST,
and atmospheric heating is beyond the scope of this study, however.
6. Comparison of ENSO Variations During 1982-1983 and 1986-1987
A general discussion of the 1982-1983 ENSO is given by Cane
[1983], and a detailed description of moored wind, current, and temperature
measurements in the eastern equatorial Pacific during 1982-1983 is given by
Halpern
[1987a]. The purpose of this section is to point out some of the
most significant similarities and differences between the 1982-1983 and 1986-1987
ENSO events in the eastern equatorial Pacific, relying primarily on the long
time series at 0°, 110°W (Plate 2).
Figure 10 shows 3-year segments of data (1982-1984,
1986-1988) overplotted on the mooring climatologies for 110°W. These data show
that in terms of thermal and surface height anomalies the 1982-1983 ENSO was
more intense than the 1986-1987 ENSO. Table
1, for example, indicates that the maximum monthly mean SST anomaly was
5.6°C (January 1983) compared to 3.4°C (September 1987) and the maximum depression
of the thermocline was 96 m (December 1982) compared to 67 m (January 1987).
Zonal winds were close to or slightly stronger than normal during the 1986-1987
event, whereas they were weaker than normal during late 1982 (Figure
10). Moreover, according to Halpern
[1987a], zonal winds became westerly in early 1983 as far east
as 95°W. This local relaxation and reversal of the trade winds may have contributed
to the intensity of thermal and flow anomalies that developed during the 1982-1983
ENSO at 110°W.
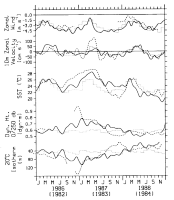
Figure 10. Time series of zonal winds, 10-m zonal velocity, SST, dynamic height
0/250 dbar, and 20°C isotherm depth for 1986-1988 (solid curves) and 1982-1984 (dashed
curves). Daily data have been smoothed with a 51-day Hanning filter to remove variability
at periods shorter than about 1 month. SST, 20°C isotherm depths, and 10-m zonal
velocities are identical to those plotted in Plate 2.
Monthly mean mooring climatologies are indicated by dotted lines.
If your browser cannot view the following table correctly, click this
link for a GIF image of Table 1.
TABLE 1. Selected Monthly or Seasonally Averaged
Anomaly Extrema During the 1982–1983
ENSO and the 1986–1987 ENSO
|
|
1982–1983 |
1986–1987 |
|
| SST, °C |
5.6 (Jan. 1983) |
3.4 (Sept. 1987) |
| 20°C isotherm depth, m |
96 (Dec. 1982) |
67 (Jan. 1987) |
| Dynamic height 0/250 dbar, dyn. m |
36 (Dec. 1982) |
21 (Jan. 1987) |
| SEC, cm s |
32 (Aug.–Dec. 1982) |
32 (Sept.–Nov. 1986) |
|
All values are positive, implying elevated SST,
depressed 20°C isotherm depth, elevated dynamic
height, and weaker South Equatorial Current (SEC). Time of the anomalies is indicated in
parentheses. |
During both events, warm thermal anomalies began to develop in midyear, prior
to the South American coastal warming [Kousky
and Leetmaa, 1989]. The 1982-1983 ENSO was of shorter duration, though,
terminating after about 12 months in mid-1983, whereas the 1986-1987 ENSO lasted
for about 18 months from mid-1986 to early 1988. Following both ENSOs, the ocean
rebounded to significantly colder than normal conditions, with SSTs plummeting
to <20°C and dynamic heights dropping to 10 dyn. cm below normal.
Near-surface flow variations show a weakening of the South Equatorial Current during
August-December 1982 and September-November 1986. In both cases the average anomaly
relative to climatology is 32 cm s though during 1982
it lasts for 5 months whereas during 1986 it lasts for only 3 months. Compared to the
1986-1987 ENSO, prolonged weakening of the South Equatorial Current, combined with a much
deeper thermocline, implies more pronounced anomalous zonal and vertical heat advection.
This in turn may account for the larger SST anomalies observed during the 1982-1983 ENSO
vis-ŕ-vis the 1986-1987 ENSO at 110°W.
It is interesting to note the opposite behavior of the springtime reversal
in the South Equatorial Current near the onset of these two events. In March-June
1982, flow is weaker than normal by 19 cm s,
whereas in March-June 1986 it is stronger than normal by 31 cm s.
Warm SST anomalies appear during both periods, so that there is no consistent
argument relating advective warming and zonal flow anomalies during the spring
season prior to both events. Similarly, the strongest eastward flow (in both
an absolute sense and an anomaly sense) for the 6 years of data shown in Figure
10 occurs in March-May 1983 (average anomaly of 54 cm s).
During this period, SST changes little because the SST gradient across the Pacific
is nearly zero [Kousky
and Leetmaa, 1989].
We noted in section 4.5 that the 1986-1987 ENSO terminated in the eastern equatorial
Pacific with surface cooling related to remotely forced uplift of the thermocline.
Figure 10 shows that at the end of the 1982-1983
ENSO, failing surface temperatures were also associated with a shoaling thermocline
(and decreasing surface heights). The precipitous drop in SST in June-July 1983,
however, coincided with the strongest westward flow in the 6 years of data shown
in Figure 10. Average anomalies of 49 cm s
to the west were observed during this period, suggesting that westward advection
of cold upwelled water may have contributed to the termination of the 1982-1983
ENSO. Local winds were weaker than normal throughout 1983 at 110°W [Inoue
and O'Brien, 1984], indicating that like the 1986-1987 ENSO event, nonlocal
forcing was involved in the termination of the 1982-1983 ENSO in the eastern
Pacific.
The Equatorial Undercurrent disappeared and was replaced by westward flow in
the thermocline at 159°W in September 1982 [Firing
et al., 1983] and in January-February 1983 at 110°W (Plate
2 and Figure 7; see also Halpern,
[1987a]). This followed several months of nearly flat or reversed
sea surface slope along the equator in the central and eastern Pacific [Wyrtki,
1984]. There were also periods of nearly flat or reversed pressure gradient
at the surface and in the thermocline in the eastern Pacific during 1986-1988.
During some of these periods (e.g., 1988 at 110°W) the Undercurrent was significantly
weaker than normal, though it did not disappear at either 110°W or 140°W during
1986-1988. The difference may be due to the duration, intensity, and/or zonal
scale of the pressure gradient anomalies, which are likely to have been smaller
in 1986-1988 than during 1982-1983. As noted above, westerly winds, which favor
the establishment of a westward zonal pressure gradient force along the equator,
penetrated to at least 95°W in 1983 [Halpern,
1987a], whereas they were confined to the west of Christmas Island
(157°W) during the 1986-1988 (Figure 8). The
Undercurrent disappeared in the western Pacific during October-November 1987
in response to these westerlies when the zonal pressure gradient at the surface
and in the thermocline reversed [McPhaden
et al., 1990a].
7. Summary and Discussion
The eastern equatorial Pacific was characterized by warmer than usual SSTs from
mid-1986 until early 1988. Weak initial anomalies in mid-1986 increased to more than 1°C
in September-November 1986 in association with a 30 cm s reduction in speed of the South Equatorial Current and a
20- to 40-m depression of the thermocline. These warm anomalies persisted until early
1988, after which cold anomalies of >3°C developed in response to large-scale,
remotely forced upwelling. Interannual fluctuations observed in the eastern equatorial
Pacific appear for the most part to be determined by year-to-year variations in the trade
winds over 40°-50° of longitude in the central and western Pacific.
The importance of remotely forced variability in the eastern Pacific during
ENSO events is well known [e.g.,
Cane, 1983]. However, it is interesting to note that both interannual
and intraseasonal time scales contribute to the observed variability, and that
for several variables, extrema during the 1986-1987 ENSO coincided with the
occurrence of remotely forced intraseasonal Kelvin waves. Specifically, the
highest dynamic heights, deepest thermocline depths, and largest zonal current
transport anomalies were observed in early 1987 as a result of the strong 2-month
westerly wind event west of the date line at the end of 1986.
The dynamical relevance of these intraseasonal fluctuations to the evolution
of ENSO is not well understood. Statistically, for example, the frequent occurrence
of western wind events may result in a seasonally averaged westerly wind anomaly
[Luther
et al., 1983]. However, the variations themselves do not appear to be
essential to the generation of ENSO events based on simple coupled ocean-atmosphere
model analyses [e.g.,
Zebiak and Cane, 1987; Schopf
and Suarez, 1988; Battisti,
1988; Zebiak,
1989]. Also, intraseasonal time scale variations are not as prominent in
SST as in subsurface temperature, dynamic heights, and thermocline currents
(for which, see Figures 2 and 4).
Nonetheless, in general, one might expect a degree of nonlinear coupling between
high- and low-frequency phenomena because intraseasonal waves like those excited
by the November-December 1986 wind event can have very large amplitude. It is
also possible that the timing of these waves relative to the seasonal cycle
could be important in the development of ENSO, if, for example, the coupled
system is particularly sensitive to perturbation at certain times of the year.
In section 6 we showed that the 1986-1987 ENSO was less intense and evolved
differently than the 1982-1983 ENSO. Particularly noteworthy is the fact that
the Equatorial Undercurrent did not disappear in the eastern Pacific during
1986-1987 as it did during 1982-1983, which probably reflects the smaller amplitude
and scale of the zonal wind and pressure gradient anomalies along the equator
during 1986-1987. In contrast, a feature common to both events was a weakening
of the South Equatorial Current by about 30 cm s
in the latter part of 1982 and 1986. Sea level differences across the South
Equatorial Current in the central and western Pacific have previously shown
this weakening, albeit inferentially by geostrophy, for ENSO events from the
1950s through 1982-1983 [Wyrtki,
1974; Philander,
1990]. Direct measurements on the equator suggest that the duration and/or
intensity of this weakening may be related to the magnitude of SST anomalies
via anomalous zonal advection during the latter part of the year when zonal
SST gradients are strongest.
The 1986-1987 ENSO, like the 1982-1983 ENSO, evolved differently than the Rasmusson
and Carpenter [1982] composite. Warm SSTs of >1°C developed in the
eastern Pacific during September-November 1986 prior to South American coastal
warming and persisted for 18 months (through December 1987 up to February 1988)
instead of for only 12 months as in the composite. Moreover, Rasmusson and Carpenter
found that westerly wind anomalies develop as early as January of the ENSO year
near the date line, intensify in the summer, and last until the following February.
In contrast, the observations for 1986-1988 show weak westerly anomalies developing
near the date line in mid-1986 and persisting until the end of 1987. Lander
[1989] discusses the differences between the 1986-1987 ENSO and the
Rasmusson
and Carpenter [1982] composite in more depth. It is clear, however,
that although there are similarities between ENSO events, there is no single
scenario that describes them all. One must be cautious, therefore, when generalizing
about ENSO on the basis of observations from a single event.
Appendix A: Data Gaps and Gridding
The depths at which moored velocity and temperature measurements have been
made at 0°, 110°W and 0°, 140°W have changed periodically due to shifting scientific
priorities in EPOCS. Also, although VACM/VMCM temperature and velocity data
return has been high (>90%), occasional instrument failures and the loss
of a mooring at 0°, 110°W between April and October 1982 have led to data gaps.
We have filled these data gaps where appropriate and gridded the time series
to a set of standard levels (Plate 2) to facilitate
the computation of mean seasonal cycles (Appendix B), and the comparison of
the 1982-1983 and 1986-1987 ENSO events (section 6). For example, at 0°, 110°W
we substituted SST as well as temperature and velocity data at 15 m, 50 m, and
100 m from from a backup mooring at 0°, 108°W during April-October 1982; and
we substituted velocity at 80 m from the backup mooring during July-November
1986. We also used linear interpolation between vertically adjacent instruments
and, where this was not possible or advisable, linear extrapolation and/or interpolation
by least squares regression. Some specific examples of these procedures and
how they affect subsequent analyses are presented in this appendix. In each
case the examples are in terms of daily or weekly averaged data; results (quoted
in terms of cross correlations and rms differences) improve with further temporal
averaging. Additional examples are given by McPhaden
et al. [1988]; similarly, Halpern
[1987a] discusses the representativeness of 108°W data as a substitute
for 110°W data for variations with periods longer than 1 week.
At 45 m at 110°W we used a regression fill for zonal velocity during October 1987 to
December 1988, because mean zonal velocity curvature precludes linear interpolation (Figure 4). The regression equation was based on 3 years
(November 1983 to November 1986) of simultaneous measurements at 25 m and 45 m. The
correlation between weekly averaged data and simulated data derived from this regression
fill was 0.95 with a mean (rms) difference of 0 cm s
(15 cm s). We likewise used regression fills for 10-m
data based on 25-m or 45-m data at 140°W for March-June 1986, March-May 1987, and
May-November 1988. The correlation of simulated daily 10-m data based on the regression
formula with actual daily data at 10 m for a 4˝ year period (April 1983 to October 1987)
was 0.94 with a mean (rms) difference of 0 cm s (14 cm
s). Zonal velocity data prior to November 1983 at
110°W were linearly extrapolated based on the underlying vertical shear from 15 m or 20 m
depth to 10 m depth for consistency with the more recent 10-m time series.
The SST time series at 140°W was very gappy, so we have substituted 10-m temperatures
in Figures 2b and B1.
The correlation between 576 contemporaneous daily averaged SST and 10-m temperatures
spanning April 1984 to June 1986 was 0.99 with a mean difference of 0.02°C (10 m colder)
and an rms difference of 0.14°C. Thus, for our purposes, 10-m temperatures are equivalent
to SST at 140°W. At 110°W the correspondence between SST and 10- to 20-m temperatures is
less perfect because of greater near-surface stratification. Thus SST data gaps were
filled with regression formulae at 110°W using the closest near-surface temperature
record. For instance, several months of missing SST data between July 1981 and April 1983
were filled with a regression formula based on 15-m temperatures. The correlation between
233 days of regression-derived SST data and actual SST data during this period was 0.99
with a mean (rms) difference of 0.00°C (0.30°C).
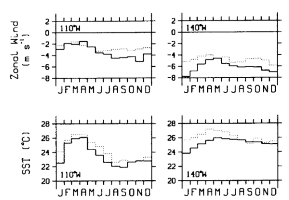
Figure B1. Monthly mean climatologies of sea surface temperature and zonal
winds at 0°, 110°W and 0°, 140°W (solid lines). Superimposed are monthly means
from the Reynolds
[1988] sea surface temperature climatology and Wyrtki
and Meyers [1975] wind climatology (dotted lines).
Temperature time series data were sometimes missing below 200 m (e.g., June-November
1988 at 140°W and February-October 1988 at 110°W). For dynamic height calculations
relative to 250 dbar at these times, we appended the mean temperature gradient
below 200 m to the 200-m temperature record to create an artificial time series
at 250 m. This method, discussed by Kessler
et al. [1985] and McPhaden
et al. [1990a], assumes that temperature changes at depth are
due to vertical displacements of the mean thermal structure. Sensitivity experiments
in which we substituted a mean gradient estimate for existing moored temperature
data at 250 m indicate that the method leads to daily averaged 0-/250-dbar dynamic
height errors of O(0.1 dyn. cm).
Appendix B: Mean Seasonal Cycles
Mean seasonal cycles have been estimated from monthly averaged equatorial mooring time
series measurements at 110°W and 140°W. Monthly averages were determined by smoothing
the time series with a 31-day running mean filter and subsampling on the fifteenth of each
month. Three years of data were used at 140°W (January 1984 to December 1986), and 5
years of data at 110°W (April 1980 to March 1982; January 1984 to December 1986). The
first several months of 1986-1987 ENSO variability are included in these estimates, but
the large interannual variations in 1987 and 1988 are not. Similarly, variability from the
1982-1983 ENSO episode is not included in the 110°W mean seasonal calculation.
One can compute a standard deviation for each month in the mean seasonal cycle at
110°W where 5 years of data were used. Characteristically, these deviations are about
1°C (SST), 10 m (20°C isotherm depth), 4 dyn. cm (dynamic height), 20 cm s (zonal currents), and 1 m s (winds). These numbers typify non-ENSO interannual
variations on a monthly basis. Thus, when discussing anomalies from the mean seasonal
cycle, emphasis should be given to those variations persisting longer than 1 month in
excess of the values quoted above.
Note that we expect differences between these climatologies and others that
may exist in the eastern equatorial Pacific. Figure
B1, for example, shows a comparison of estimates based on moored measurements
with the Reynolds
[1988] SST climatology and the Wyrtki
and Meyers [1975] wind climatology. The moored data show SSTs that are
consistently colder by l°-2°C and zonal winds that are consistently stronger
by 1-3 m s. There are several possible explanations
for these differences. First, they could represent real interdecadal variations
since the Reynolds and the Wyrtki and Meyers climatologies are based on pre-1980
data. Second, Reynolds and Wyrtki and Meyers include ENSO years in their climatologies,
whereas we have excluded data from the 1982-1983 ENSO and from most of the 1986-1987
ENSO. This could lead to slightly warmer temperatures and, at 140°W, slightly
weaker easterlies compared to the mooring climatologies. (At 110°W easterlies
tend to be stronger than usual during ENSO, with the notable exception of the
1982-1983 event, so that ENSO biases cannot explain the wind differences at
110°W.) Third, the previously published climatologies are spatially smoothed
over several degrees of latitude and longitude. In the case of the Reynolds
climatology this would lead to warmer equatorial SSTs because of the strong
meridional SST gradients flanking the equatorial minimum. Fourth, the Reynolds
and the Wyrtki and Meyers climatologies are based on different measurement techniques
than the mooring climatologies; i.e., merchant ship wind observations were often
reported on the Beaufort scale, and SST observations were based on bucket or
engine room intake temperatures. These climatologies may be biased because of
uneven spatial and temporal sampling and, in the case of SST, because of engine
room heating from the intake method [Saur,
1963]. We have therefore favored the mooring-based mean seasonal cycles
in this study in spite of the relative shortness of the records, because they
allow for a consistent discussion of interannual anomalies in all the moored
measurements (including subsurface velocity, for which no other climatology
exists).
Acknowledgments. Special thanks to Paul Freitag, Margie McCarty, and Nancy
Soreide for processing the mooring time series. We also appreciate the technical
assistance of Andy Shepherd, Carol Coho, Doug Fenton, Ben Moore, and Rick Miller for
instrument preparation and mooring operations at sea. Linda Mangum and Linda Stratton were
responsible for CTD data processing. Thanks also to the anonymous reviewer who was very
detailed and thorough in his critique. This work has been supported by NOAA's Equatorial
Pacific Ocean Climate Study (EPOCS) program and the U.S. TOGA Project Office. NOAA PMEL
contribution 1120.
References
Battisti, D., Dynamics and thermodynamics of a warming event in a coupled
ocean/atmosphere model, J. Atmos. Sci., 45, 2889-2919, 1988.
Bendat, J. S., and A. G. Piersol, Random Data: Analysis and Measurement
Procedures, 407 pp., Wiley Interscience, New York, 1971.
Bryden, H. L., and E. L. Brady, Diagnositic model of the three dimensional circulation
in the upper equatorial Pacific Ocean, J. Phys. Oceanogr., 15, 1255-1273, 1985.
Busalacchi, A. J., and M. A. Cane, Hindcasts of sea level variations during the 1982-83
El Nińo, J. Phys. Oceanogr., 15, 213-221, 1985.
Cane, M. A., Oceanographic events during El Nińo, Science, 222, 1189-1202,
1983.
Climate Analysis Center, Global analyses and indices, climate diagnostic bulletin,
Natl. Oceanic and Atmos. Admin., Washington, D. C., 1988.
Emery, W. J., and J. S. Dewar, Mean temperature-salinity, salinity-depth and
temperature-depth curves for the North Atlantic and North Pacific, Prog. Oceanogr., 11,
219-305, 1982.
Enfield, D. B., The intraseasonal oscillation in eastern Pacific sea levels: How is it
forced?, J. Phys. Oceanogr., 17, 1860-1876, 1987.
Firing, E., R. Lukas, J. Sadler, and K. Wyrtki, Equatorial Undercurrent disappears
during the 1982-83 El Nińo, Science, 222, 1121-1123, 1983.
Freitag, H. P., M. J. McPhaden, and A. J. Shepherd, Equatorial current and temperature
data: 108°W to 110°W; October 1979 to November 1983, NOAA Data Rep. ERL PMEL-17, Pac.
Mar. Environ. Lab., Seattle, Wash., 1987.
Freitag, H. P., M. J. McPhaden, and A. J. Shepherd, Comparison of equatorial winds as
measured by cup vs. propeller anemometers, J. Atmos. Oceanic Technol., 6, 327-332,
1989.
Gill, A. E., Atmosphere-Ocean Dynamics, 662 pp., Academic, San Diego, Calif.,
1982.
Halpern, D., Observations of annual and El Nińo flow variations at 0°, 110°W and
0°, 95°W during 1980-1985, J. Geophys. Res., 92, 8197-8212, 1987a.
Halpern, D., Comparison of upper ocean VACM and VMCM observations in the equatorial
Pacific, J. Atmos. Oceanic Technol., 4, 84-93, 1987b.
Halpern, D., R. A. Knox, and D. S. Luther, Observations of 20-day period meridional
current oscillations in the upper ocean along the Pacific equator, J. Phys. Oceanogr.,
18, 1514-1534, 1988.
Harrison, D. E., and B. S. Giese, Comment on "The response of the equatorial
Pacific Ocean to a westerly wind burst in May 1986" by M. J. McPhaden et al., J.
Geophys. Res., 94, 5024-5026, 1989.
Harrison, D. E., and P. Schopf, Kelvin wave induced anomalous advection and the onset
of surface warming in El Nińo events, Mon. Weather Rev., 112, 923-933, 1984.
Hayes, S. P., et al., The Equatorial Pacific Ocean Climate Studies (EPOCS) plans:
1986-1988, Eos Trans. AGU, 67, 442-444, 1986.
Hayes, S. P., M. J. McPhaden, and J. M. Wallace, The influence of sea surface
temperature upon surface wind in the eastern equatorial Pacific: Weekly to monthly
variability, J. Clim., 2, 1500-1506, 1989.
Inoue, M., and J. J. O'Brien, Predictability of the decay of the 1982/83 El Nińo, Mon.
Weather Rev., 114, 967-972, 1984.
Kessler, W. S., B. A. Taft, and M. J. McPhaden, An assessment of the XBT sampling
network in the central Pacific, Tech. Rep. USTOGA-4, 62 pp., Univ. Corp. for
Atmos. Res., Boulder, Colo., 1985.
Kousky, V. E., and A. Leetmaa, The 1986-87 Pacific warm episode: Evolution of oceanic
and atmospheric anomaly fields, J. Clim., in press, 1989.
Lander, M. A., A comparative analysis of the 1987 ENSO event, Trop. Ocean Atmos.
Newsl., 49, 3-6, 1989.
Large, W. G., and S. Pond, Open ocean momentum flux measurements in moderate to strong
winds, J. Phys. Oceanogr., 11, 324-336, 1981.
Lukas, R., The termination of the Equatorial Undercurrent in the eastern Pacific, Prog.
Oceanogr., 16, 63-90, 1985.
Luther, D. S., D. E. Harrison, and R. A. Knox, Zonal winds in the central equatorial
Pacific and El Nińo, Science, 222, 237-230, 1983.
Lynch, J. M., L. J. Mangum, and S. P. Hayes, CTD/0 measurements during 1986 as part of the Equatorial Pacific Ocean Climate
Studies (EPOCS), NOAA Data Rep. ERL PMEL-24, 261 pp., Pac. Mar. Environ. Lab.,
Seattle, Wash., 1988.
measurements during 1986 as part of the Equatorial Pacific Ocean Climate
Studies (EPOCS), NOAA Data Rep. ERL PMEL-24, 261 pp., Pac. Mar. Environ. Lab.,
Seattle, Wash., 1988.
Mangum, L. J., S. P. Hayes, and J. M. Toole, Eastern Pacific circulation near the onset
of the 1982-1983 El Nińo, J. Geophys. Res., 91, 8428-8436, 1986.
McPhaden, M. J., Fine-structure variability observed in CTD measurements from the
central equatorial Pacific, J. Geophys. Res., 90, 11,726-11,740, 1985.
McPhaden, M. J., and B. A. Taft, On the dynamics of seasonal and intraseasonal
variability in the eastern equatorial Pacific, J. Phys. Oceanogr., 18, 1713-1732,
1988.
McPhaden, M. J., H. P. Freitag, S. P. Hayes, B. A. Taft, Z. Chen, and K. Wyrtki, The
response of the equatorial Pacific Ocean to a westerly wind burst in May 1986, J.
Geophys. Res., 93, 10,598-10,603, 1988.
McPhaden, M. J., H. P. Freitag, S. P. Hayes, B. A. Taft, Z. Chen, and K. Wyrtki, Reply,
J. Geophys. Res., 94, 5027-5028, 1989.
McPhaden, M. J., S. P. Hayes, L. J. Mangum, and J. M. Toole, Variability in the western
equatorial Pacific Ocean during the 1986-87 El Nińo/Southern Oscillation event, J.
Phys. Oceanogr., 20, 190-208, 1990a.
McPhaden, M. J., H. P. Freitag, and A. J. Shepherd, Moored salinity time series
measurements from 0°, 140°W, J. Atmos. Oceanic Technol., in press, 1990b.
Milburn, H. B., and P. D. McClain, ATLAS--A low cost satellite data telemetry mooring
developed for NOAA's climate research mission, in Proceedings MDS 1986; Marine Data
Systems International Symposium, pp. 393-396, Marine Technology Society, Washington,
D. C., 1986.
Miller, L., R. Cheney, and B. Douglas, GEOSAT altimeter observations of Kelvin waves
and the 1986-87 El Nińo, Science, 239, 52-54, 1988.
National Academy of Sciences, Report of a drafting workshop, AOML, Miami, on elements
of the ten-year monitoring component for El Nińo and the Southern Oscillation (ENSO), Tech.
Rep. USTOGA-1, 42 pp., Univ. Corp. for Atmos. Res., Boulder, Colo., 1988.
Palmer, T. N., and C. Brankovic, The 1988 US drought linked to anomalous sea surface
temperature, Nature, 338, 54-57, 1989.
Philander, S. G. H., El Nińo, La Nińa, and the Southern Oscillation, 289 pp.,
Academic, San Diego, Calif., 1990.
Philander, S. G. H., D. Halpern, D. Hansen, R. Legeckis, L. Miller, C. Paul, R. Watts,
R. Weisberg, and M. Wimbush, Long waves in the equatorial Pacific Ocean, Eos Trans.
AGU, 66, 154, 1985.
Picaut, J., S. P. Hayes, and M. J. McPhaden, Use of the geostrophic approximation to
estimate time-varying zonal currents at the equator, J. Geophys. Res., 94, 3228-3236,
1989.
Pullen, P. E., R. L. Bernstein, and D. Halpern, Equatorial long-wave characteristics
determined from satellite sea surface temperature and in situ data, J. Geophys. Res.,
92, 742-748, 1987.
Rasmusson, E. M., and T. H. Carpenter, Variations in tropical Pacific sea surface
temperature and surface wind fields associated with the Southern Oscillation/El Nińo, Mon.
Weather Rev., 110, 354-384, 1982.
Rebert, J. P., J. R. Donguy, G. Eldin, and K. Wyrtki, Relations between sea level,
thermocline depth, heat content, and dynamic height in the tropical Pacific Ocean, J.
Geophys. Res., 90, 11,719-11,725, 1985.
Reynolds, R. W., A real-time global sea surface temperature analysis, J. Clim., 1, 75-86,
1988.
Ropelewski, C. F., and M. S. Halpert, North American precipitation and temperature
patterns associated with the El Nińo-Southern Oscillation (ENSO), Mon. Weather Rev.,
114, 2352-2362, 1986.
Ropelewski, C. F., and M. S. Halpert, Global and regional scale precipitation patterns
associated with the El Nińo-Southern Oscillation, Mon. Weather Rev., 115, 1606-1626,
1987.
Saur, J. F. T., A study of the quality of sea surface temperatures reported in logs of
ships' weather observations, J. Appl. Meteorol., 2, 417-425, 1963.
Schopf, P. S., and M. J. Suarez, Vacillations in a coupled ocean-atmosphere model, J.
Atmos. Sci., 45, 549-566, 1988.
Trenberth, K. E., G. W. Branstator, and P. A. Arkin, Origins of the 1988 North American
drought, Science, 242, 1640-1645, 1988.
Tsuchiya, M., Upper waters of the intertropical Pacific Ocean, Johns Hopkins
Oceanogr. Stud., 4, 50 pp., 1968.
Wallace, J. M., T. P. Mitchell, and C. Deser, The influence of sea-surface temperature
upon surface wind in the eastern equatorial Pacific: Seasonal and interannual variability,
J. Clim., 2, 1492-1499, 1989.
Wyrtki, K., Sea level and the seasonal fluctuation of equatorial currents in the
western Pacific Ocean, J. Phys. Oceanogr., 4, 91-103, 1974.
Wyrtki, K., The slope of sea level along the equator during the 1982-1983 El Nińo, J.
Geophys. Res., 89, 10,419-10,424, 1984.
Wyrtki, K., and G. Meyers, The trade wind field over the Pacific Ocean, I, The mean
field and the annual mean variation, Tech. Rep. HIG-75-1, 26 pp., Hawaii Inst. of
Geophys., Univ. of Hawaii, Honolulu, 1975.
Zebiak, S. E., On the 30-60 oscillation and the prediction of El Nińo, J. Clim., 2,
1381-1387, 1989.
Zebiak, S. E., and M. A. Cane, A model El Nińo-Southern Oscillation, Mon.
Weather Rev., 115, 2262-2278, 1987.
PMEL Outstanding Papers
PMEL Publications Search
PMEL Homepage
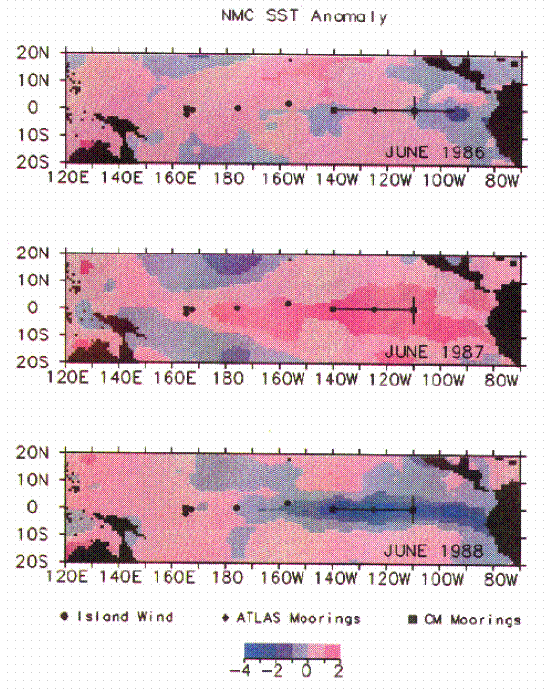
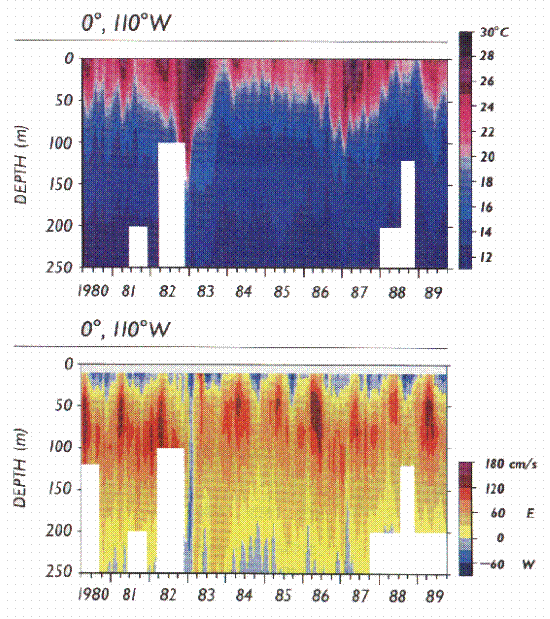
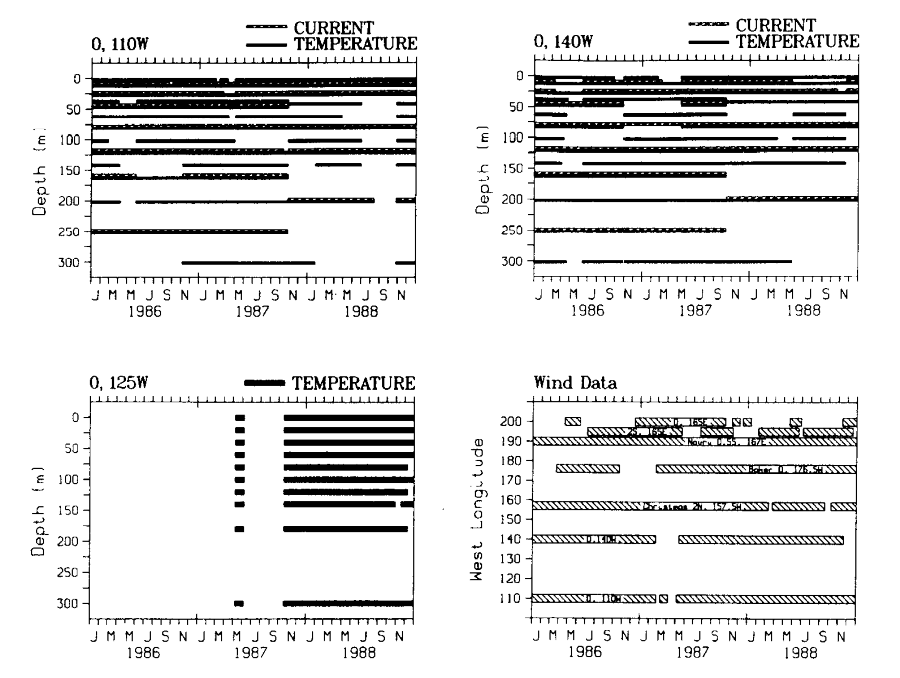

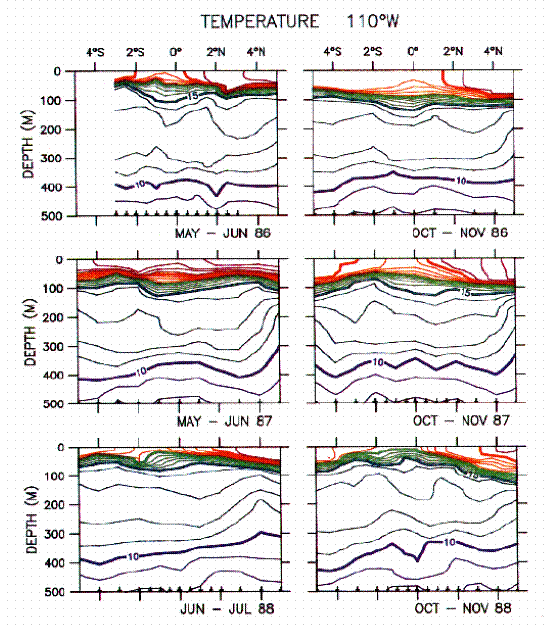
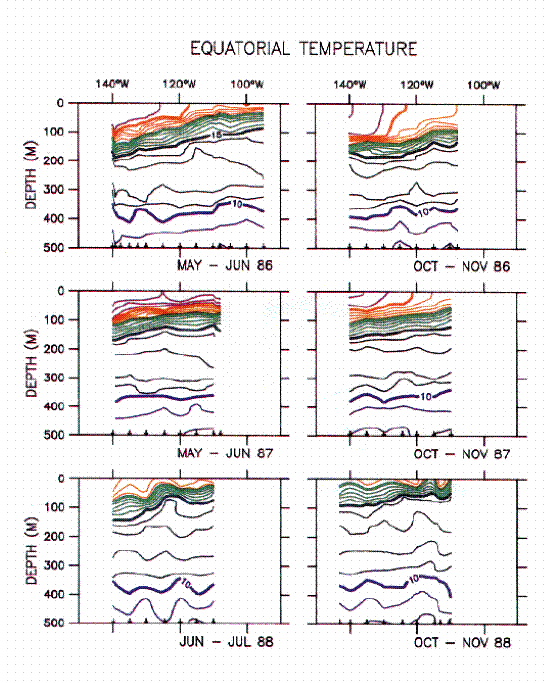
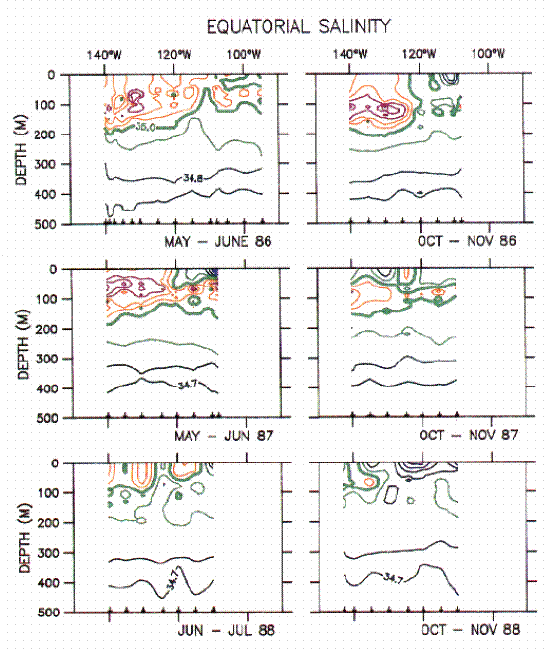
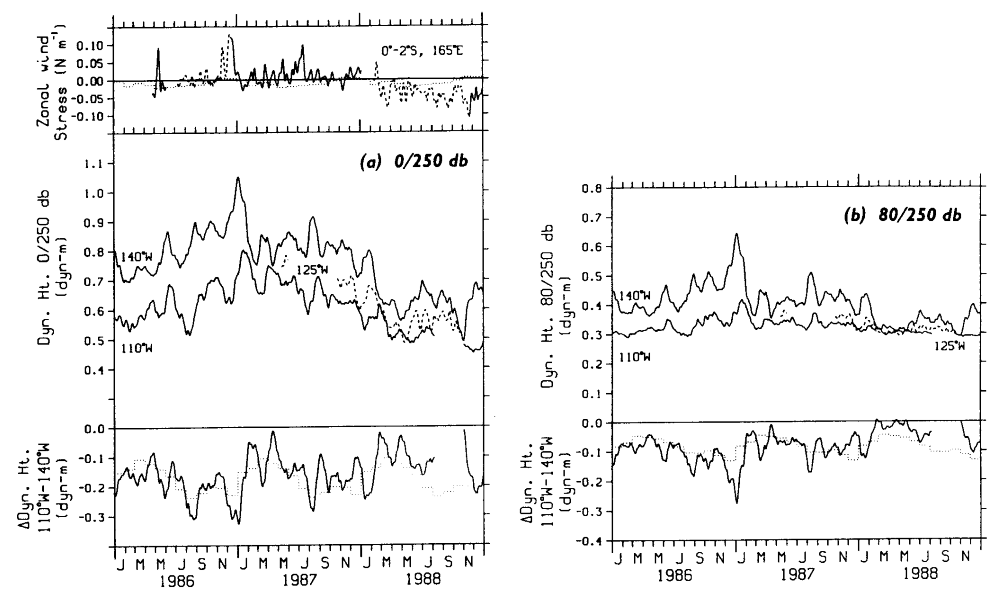
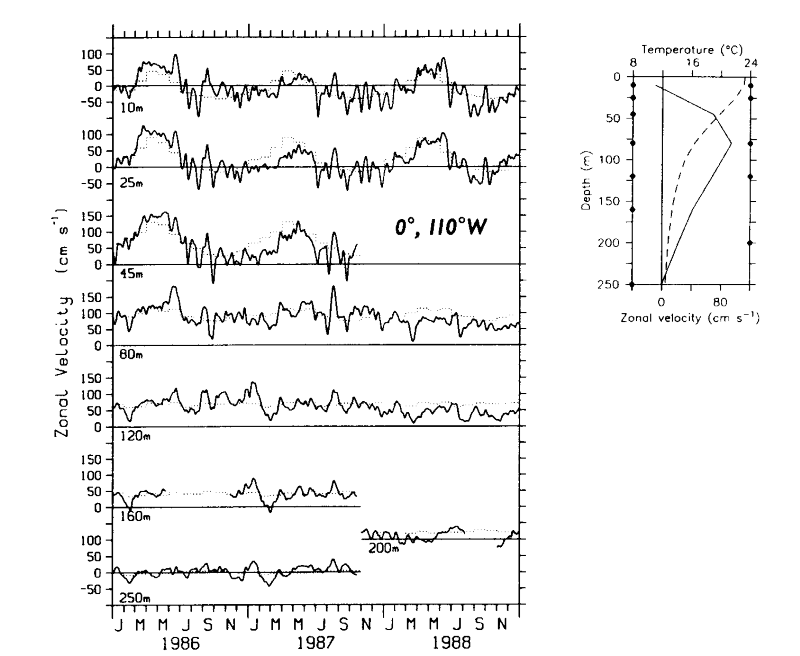
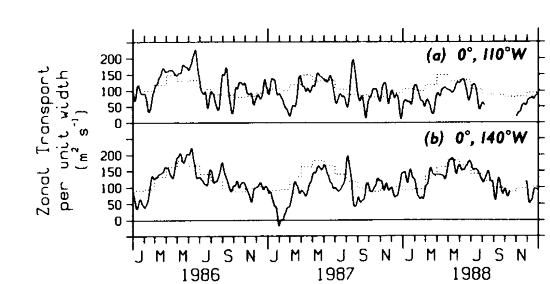
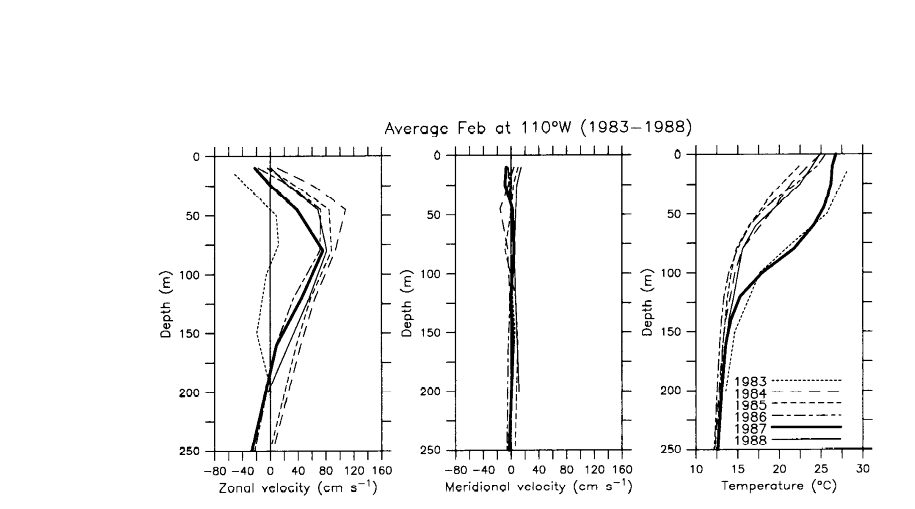
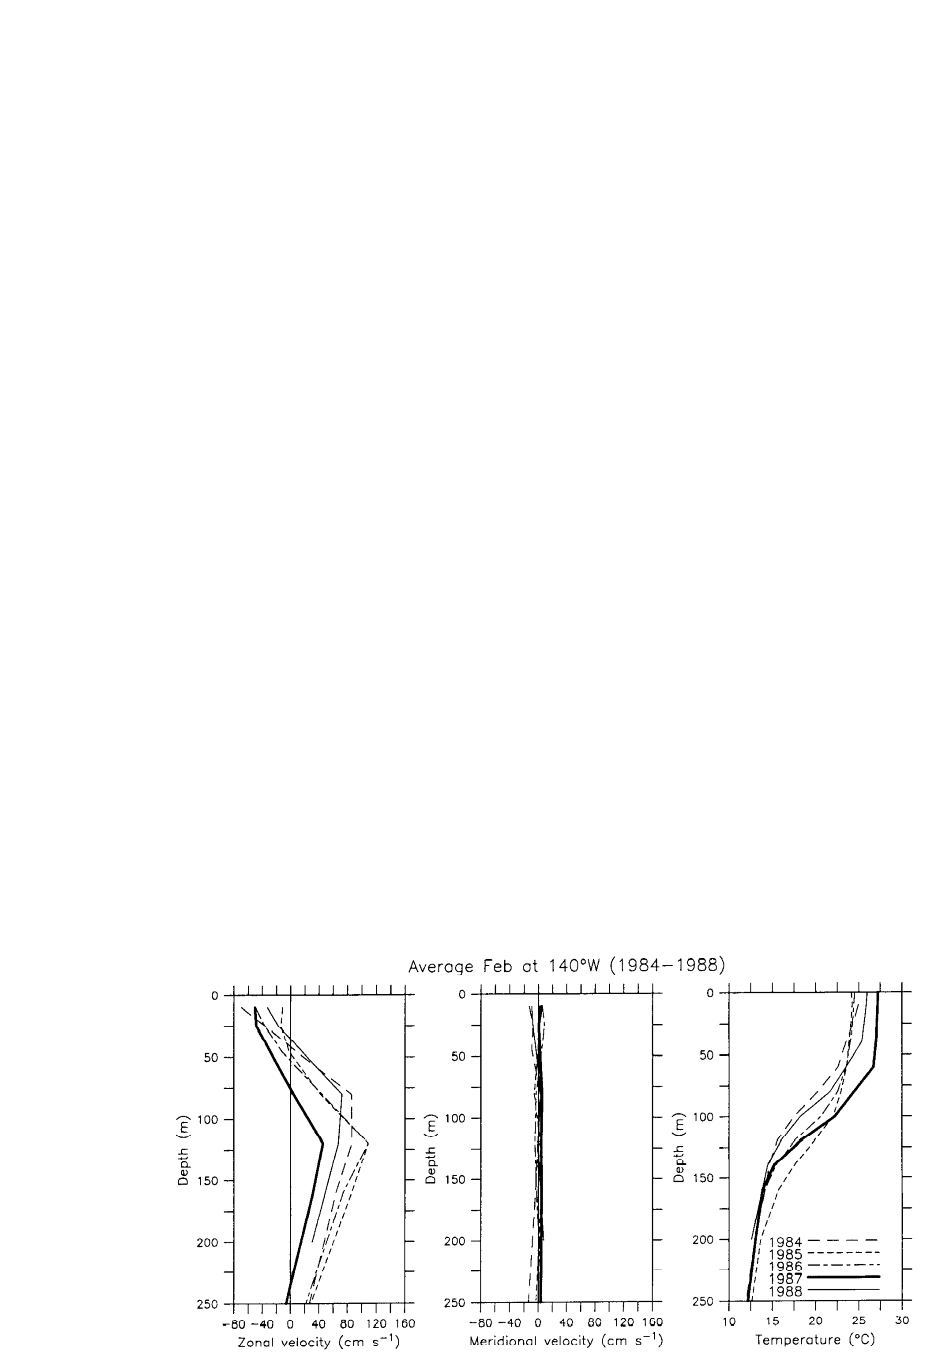
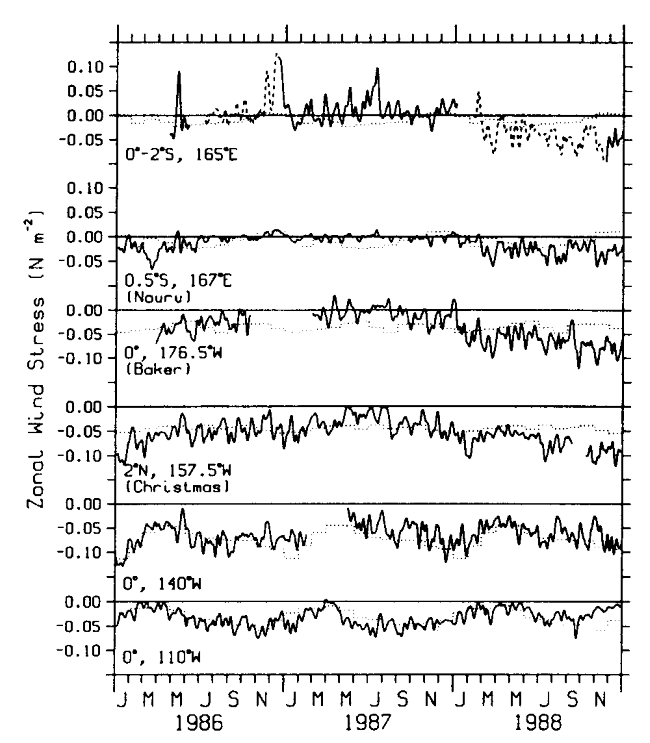
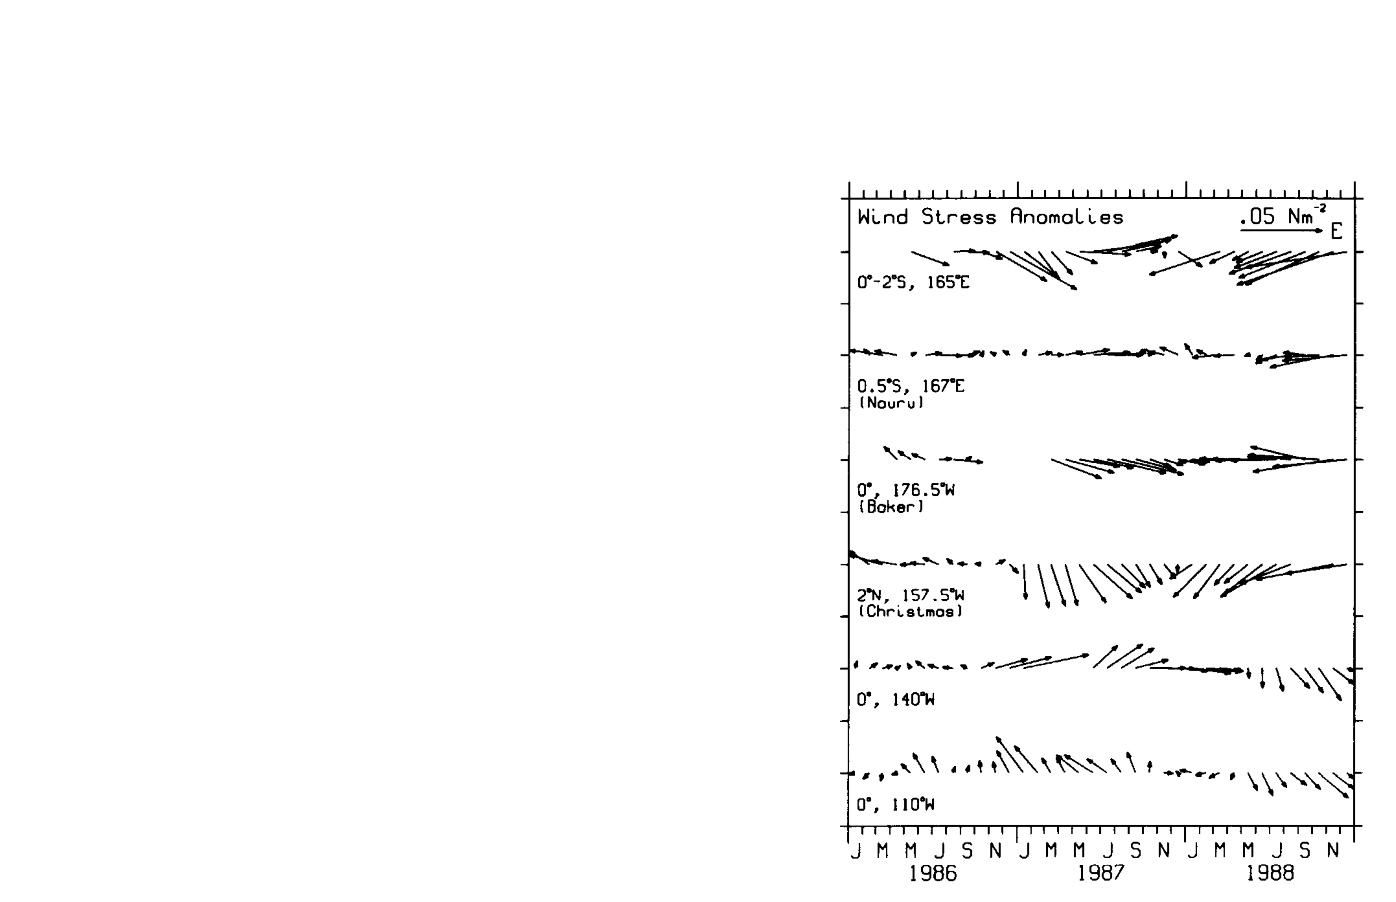
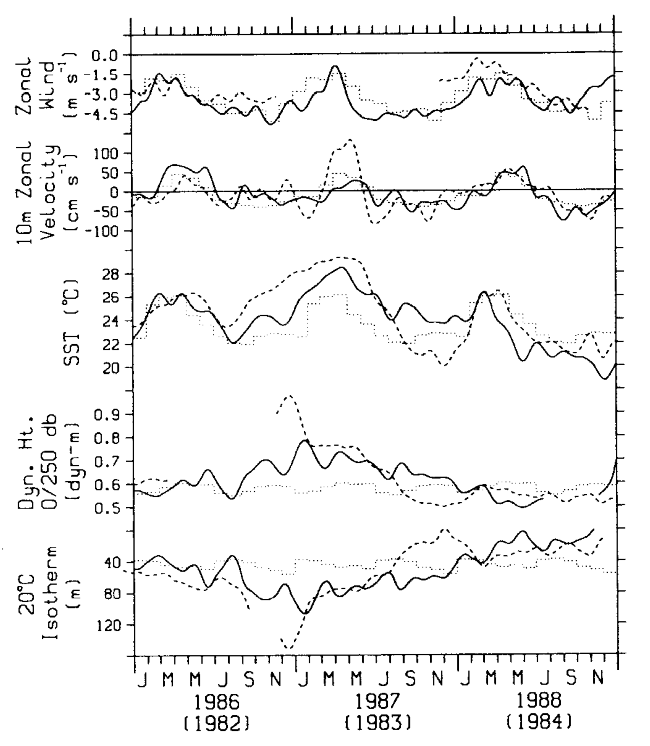
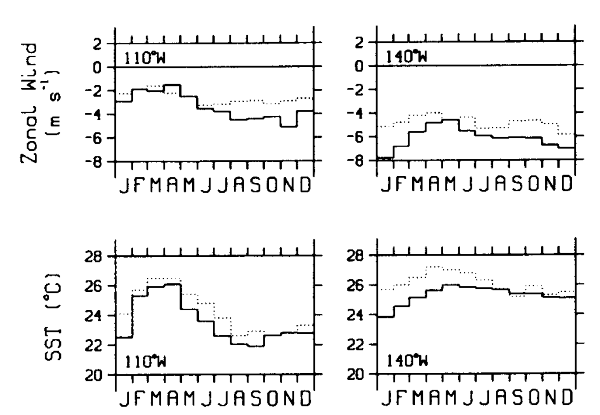