U.S. Dept. of Commerce / NOAA / OAR / PMEL / Publications
A Model for the Deposition of Hydrothermal Manganese Near Ridge Crests
J. W. Lavelle
Pacific Marine Environmental Laboratory, NOAA, Seattle, Washington
J. P. Cowen
Department of Oceanography, University of Hawaii, Honolulu, Hawaii
G. J. Massoth
Pacific Marine Environmental Laboratory, NOAA, Seattle, Washington
Journal of Geophysical Research, 97(C5), 7413-7427 (1992)
Copyright ©1992 by the American Geophysical Union. Further electronic distribution is not
allowed.
5. Results and Discussions
Distributions and fluxes of Mn in all three phases were calculated using the
model equations and parameter values just described. Those results and their
sensitivity to variations in parameter values away from central ones (Table
3) follow.
If your browser cannot view the following table correctly,
click this link for a GIF image of Table 3.
Table 3. Central Values of Model Parameters Around Which Sensitivity Analyses
Were Conducted
|
| Value |
Parameter |
|
k = (360
days) = (360
days) |
sorption rate of Mn onto fine particles |
k = (120
days) = (120
days) |
remobilization rate of Mn from fine particles |
k = (60
days) = (60
days) |
scavenging rate of fine by large particles |
k = (6
days) = (6
days) |
release rates of fine from large particles |
w = 0.1
m/d = 0.1
m/d |
fine particle settling velocity |
w = 100
m/d = 100
m/d |
large particle settling velocity |
| C = 15
Ąg/L |
fine particulate concentration |
| C = 0.44
Ąg/L |
macroaggregate concentration |
E = 1.7 ū 10 g/m▓/d
 |
sediment erosion rate |
K = 0.8
cm▓/s = 0.8
cm▓/s |
vertical eddy diffusivity |
K = 10
m▓/s = 10
m▓/s |
horizontal eddy diffusivity |
| u = 0.2 cm/s |
horizontal advection velocity westward |
| h = 240 m |
Mn source height from seafloor |
Q = 4.8 ū 10 g/m/s
g/m/s |
Mn source rate |
 = 0.1 = 0.1 |
benthic flux fraction |
|
5.1. Water Column Transects
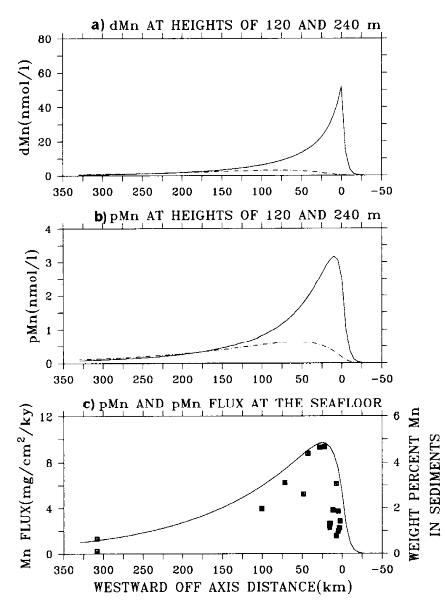
Model transects of Mn in dissolved and fine particulate phases at plume height
(Figure 3, solid curve) have the general features
of the observations (Figure 1). Maximum values
of both model dissolved Mn (dMn = T )
and total particulate Mn (pMn = T
)
and total particulate Mn (pMn = T + T) are within a factor
of 1.5 of the data, a result of the adjustment of the single parameter Q
+ T) are within a factor
of 1.5 of the data, a result of the adjustment of the single parameter Q ,
the dMn source strength. Values for dMn peak on axis (x = 0, Figure
3), while those for pMn peak off axis; so do the data (Table 1). An off-axis
maximum is consistent with the pMn data of Feely
et al. [1992]. Both distributions decline sharply with distance off
axis, though dMn declines more slowly and pMn declines more quickly than the
observations suggest.
,
the dMn source strength. Values for dMn peak on axis (x = 0, Figure
3), while those for pMn peak off axis; so do the data (Table 1). An off-axis
maximum is consistent with the pMn data of Feely
et al. [1992]. Both distributions decline sharply with distance off
axis, though dMn declines more slowly and pMn declines more quickly than the
observations suggest.
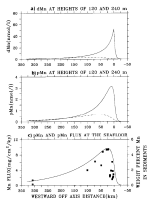
Figure 3. Model results under parameter conditions of Table 3 showing off-axis
transects of (a) dissolved manganese (dMn = T)
and (b) total particulate manganese (pMn = T
+ T) at heights of (solid)
240 m and (dashed) 120 m. (c) Model pMn flux (mg/cm /kyr)
to the seafloor (solid curve) and measured weight percent of Mn in surficial
sediments (squares, Table 2).
/kyr)
to the seafloor (solid curve) and measured weight percent of Mn in surficial
sediments (squares, Table 2).
The rate of decrease of dMn off axis depends on all model variables, but dMn
must be particularly sensitive to k
and u, the advection speed. Accelerating the rate of conversion of dMn
to fine particulate form by enlarging k
could make model and measured dMn distributions (Figures
1a and 3a) more alike. This
was not done because the value of k
would no longer as well match the field measurements [Cowen
and Li, 1991] and because Figure 1a
represents just two samples of water column distributions that are likely to
be highly variable about a long-term mean. Since the model is meant to address
longer-term mean conditions, matching Mn distributions in sediments was given
priority instead.
Transects at a height of 120 m (dashed curve, Figure
3) have a very much different appearance. Distributions are broader and
maxima are farther off axis. The comparison of these with those at 240 m show
the importance to the interpretation of data of securing samples at a fixed
plume horizon. All model transects show upstream concentrations caused by horizontal
diffusion, the model surrogate for tidal dispersion. The off-axis pMn distributions
and the location of the maxima reflect, first, the slow uptake of dMn by capsuled
bacteria and, past the distribution maxima, the declining availability of dMn
for scavenging.
5.2. Regional Water-Column Distributions
A larger perspective on Mn cycling near the ridge is seen in the contoured
fields for each Mn phase (Figure 4). The dMn
concentrations of 2 nmol/L, several time background levels in the North Pacific
(0.2-0.5 nmol/L [e.g.,
Martin and Knauer, 1982, 1985;
Landing
and Bruland, 1987], extends more than 200 km downstream. Overall the
dMn plume is reminiscent of the  He plume measured
at the EPR [Lupton
and Craig, 1981], but dMn, unlike He,
is a nonconservative tracer and quantitative comparisons must be made cautiously.
Unlike the He plume, the dMn plume shows slightly
increasing concentrations at the seafloor, the result of remobilization of Mn
in sediments and diffusion back into the water column. This feature of the distribution
could be mistakenly interpreted as the consequence of a diffuse off-axis hydrothermal
source, when it is the result of Mn deposition patterns and Mn diagenesis in
the sediments. Diffuse off-axis hydrothermal sources of Mn cannot be ruled out,
however.
He plume measured
at the EPR [Lupton
and Craig, 1981], but dMn, unlike He,
is a nonconservative tracer and quantitative comparisons must be made cautiously.
Unlike the He plume, the dMn plume shows slightly
increasing concentrations at the seafloor, the result of remobilization of Mn
in sediments and diffusion back into the water column. This feature of the distribution
could be mistakenly interpreted as the consequence of a diffuse off-axis hydrothermal
source, when it is the result of Mn deposition patterns and Mn diagenesis in
the sediments. Diffuse off-axis hydrothermal sources of Mn cannot be ruled out,
however.
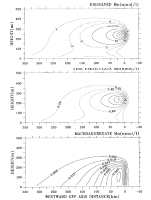
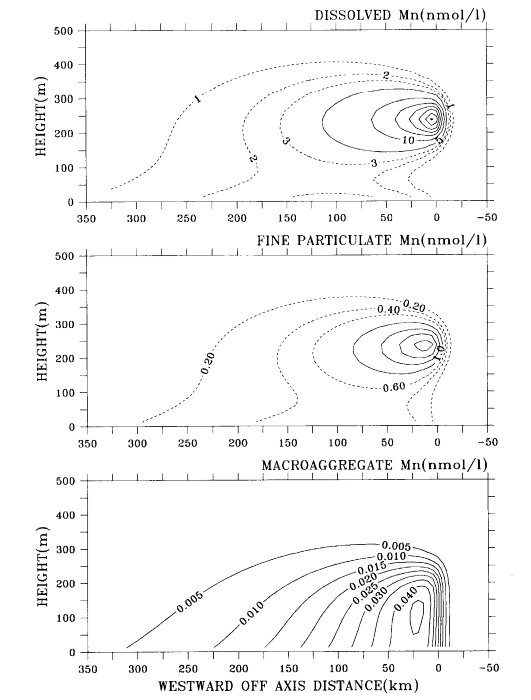
Figure 4. Off-axis concentration distributions (T,
T, T)
of the three water column phases of hydrothermal Mn (nmol/L).
The pMn plume (Figure 4b) shows the effects
of particle settling, particle resuspension at the seafloor, and the exchange
of pMn with the other water column Mn reservoirs. Concentrations of 0.4 nmol/L
extend to nearly 200 km in an ocean where background pMn values are 0.1-0.3
nmol/L [e.g.,
Martin and Knauer, 1982, 1985;
Landing
and Bruland, 1987]. The axis of the pMn plume slopes downward, the consequence
primarily of large particle settling. Resuspension of particles from the seafloor
raise concentrations between the seafloor and plume axis.
The distribution of macroaggregate Mn is, perhaps, the most interesting (Figure
4c). Concentration has a maximum value ~0.05 nmol/L in a region a
few tens of kilometers off axis. Since Mn flux to the sediments is primarily
in macroaggregate form, and that flux has a magnitude nearly equal to wC,
Figure 4c suggests that hydrothermal Mn
will be deposited close to the ridge, but deposition will be small on axis.
The exact location of the off-axis maximum will depend on the values given model
parameters, but a reasonable range enforces near-ridge deposition of Mn. The
pattern of deposition is a consequence of the Mn having to pass through two
phases before reaching the sediments, and the time scales of those phase conversions
of Mn in comparison to the time scale of an off-axis distance divided by the
advection velocity.
When sectioned vertically, as if taking a vertical cast, the profiles of dMn
and pMn both show maxima at plume height and secondary maxima at the seafloor,
just as do the observations [e.g.,
Cowen et al., 1986]. The vertical profiles of Mn in macroaggregate
form have a much different shape. Vertical gradients are generally much slighter
and so concentrations are likely to be more vertically uniform below plume height.
If a vertical array of sediment traps could be moored below the plume, this
model suggests that the hydrothermal flux of Mn into the traps should be nearly
uniform. The prediction would be unwarranted very near the seafloor, however,
because the model does not presently recognize the increased levels of turbulence
in the benthic boundary layer. That increased vertical mixing should result
in more near-bottom resuspension of particles, a process which is known to strongly
effect near-bottom particle fluxes into traps [e.g.,
Walsh et al., 1988]. An actual flux measurement beneath a
hydrothermal plume is made extremely difficult by the wafting three-dimensional
nature of any real plume.
The weight fraction of Mn on particles, calculated from the quotient of the
Mn concentration and the particle concentration, is distributed, for fine particles
and macroaggregates, in the manner of Figures 4b
and 4c. The reason is that model particle
concentrations are taken to be spatially uniform, and so the quotient of T by C will have the off-axis
distributional shape of T,
where i = p or s. Weight fractions have maximum values
of ~1.2% Mn for fine particles and ~0.6% Mn for macroaggregates, both occurring
off axis. West of the ridge and 300 km downstream the particles bear only 0.1%
Mn by weight. Near-axis data of Dymond
and Roth [1988] on the Endeavor Ridge, for a sediment trap at a depth
corresponding to the upper part of the plume (1950 m) but presumably away from
the effects of resuspension, suggest Mn weight percent on trapped particles
of 0.1%. A more easily sampled trap of particles and hydrothermal Mn is the
sediment itself, the model results for which we now examine.
by C will have the off-axis
distributional shape of T,
where i = p or s. Weight fractions have maximum values
of ~1.2% Mn for fine particles and ~0.6% Mn for macroaggregates, both occurring
off axis. West of the ridge and 300 km downstream the particles bear only 0.1%
Mn by weight. Near-axis data of Dymond
and Roth [1988] on the Endeavor Ridge, for a sediment trap at a depth
corresponding to the upper part of the plume (1950 m) but presumably away from
the effects of resuspension, suggest Mn weight percent on trapped particles
of 0.1%. A more easily sampled trap of particles and hydrothermal Mn is the
sediment itself, the model results for which we now examine.
5.3. Vertical Mn Fluxes and Concentrations in Sediments
Fluxes into model "sediment traps" are given by the expression w
T
+ wT.
Since the first of these terms is very much larger than the second, the principal
contribution to Mn flux is from macroaggregates. A horizontal transect of model
Mn flux evaluated at the seafloor shows that the flux has a maximum value of
-10 mg/cm/kyr, occurring approximately 25 km
off axis while on axis and far downstream the flux is more nearly 1 mg/cm/kyr.
The distribution resembles in shape that shown in Figure
3c, the model Mn flux to sediments (equation (11)). Those differ
from Mn fluxes into sediment traps by the amounts of Mn remobilized in the sediments
and diffused back into the water column as dMn and by the amount of Mn resuspended
in particulate form. These rates are less, but for this model only slightly,
than Mn vertical fluxes indicated by model "traps."
Mn fluxes of these magnitudes have been measured in other hydrothermal areas
using actual sediment traps. Dymond
and Roth [1988], for the Endeavor Ridge and at 2 km from an active vent
field, found Mn fluxes at plume depth and below of 1.5-5 mg/cm/kyr.
The larger values may reflect the results of particle resuspension [e.g.,
Walsh et al., 1988]. Fischer
[1983] reported Mn fluxes 1.7 and 0.47 mg/cm/kyr
at MANOP sites M and H, respectively, the first 25 km east of the EPR and the
second much farther away. Martin
et al. [1985] found Mn fluxes of 0.13-0.22 mg/cm/kyr
at two deep northeastern Pacific stations which we presume to be far from hydrothermal
influence.
Model Mn flux rates to the sediments and the measured weight percent of Mn
in surficial sediment, though different quantities, was assumed to be similarly
distributed. The likeness of the shape of the two distributions in Figure
3c was actually a condition achieved by model parameter adjustment,
as will be discussed later. This approach leads to a relationship between the
off-axis advection speed and the macroaggregate scavenging rate constant.
The underlying assumptions here require some discussion. The weight percent
of Mn in surficial sediments depends on the rates of both Mn and sediment accumulation.
Mn in the surficial layer of sediments (equation (11)) is determined not only
by the Mn weight percent of the depositing particles, but also on the enrichment
of the surficial sediments by upward migration of Mn from deeper in the core.
The evidence for this diagenetic enrichment will be given below. A second factor,
that of off-axis changes in the net sediment accumulation rate caused by the
dissolution of carbonates and silicates at the seafloor, also has the potential
for enlarging the Mn mass fraction in accumulating sediment compared to that
in settling particles.
In the absence of sufficient data to make quantitative the consequences of
these several factors, we have been forced, for the present, to adopt off-axis
invariance of the benthic flux fraction , the
degree of Mn enrichment of the surficial sediments by diagenetic processes,
and net sediment accumulation rates. Evidence bearing on the first comes from
Roth
and Dymond s [1989] compositional analysis of flux into sediment traps
at the Juan de Fuca Ridge. They found that organic matter mass fraction was
larger in traps near hydrothermal vents compared to those slightly (~2 km) away.
Thus there may be an off-axis dependence to organic flux, which, in turn, could
cause relative changes in the fraction () of
Mn remobilized and released back into the water column from a thin surficial
layer of sediments. It might also suggest, assuming uniformity over past time,
that there should be off-axis differences in the degree of Mn remobilization
at depth and enrichment near the surface of the sediment column. Patterns of
off-axis organic material flux are presently not available.
Off-axis variations in sediment accumulation rates seem likely. Three cores
(G. J. Massoth, unpublished data, 1987) taken at 15.6, 43 and 308 km west of
the ridge show the weight percentage of CaCO
measured at 2.5 cm depth in the cores to be 46, 10, and 0.3%, respectively.
Water depths at core locations (Table 2) were 2635, 2970, and 3904 m. If carbonates
were removed by dissolution in the deepest core, if they were initially as much
as 46% by weight as was found in the near-axis core, and if carbonate dissolution
is the only process altering sediment accumulation rate, the sediment accumulation
rate at 308 km could be only one half those at 15 km off axis. Other rate altering
processes, whether close to or at substantial distances from the ridge crest,
require corresponding consideration. Reducing the net sedimentation rate would
have the effect of increasing the weight fraction of Mn in the sediments for
the same incident flux of Mn. If sediment accumulates more slowly the larger
the distance off axis, the model Mn depositional flux curve (Figure
3c) will need to be made to decrease more quickly with off-axis distance
than it now does so that the shapes of the Mn percent weight distributions from
model and core data will agree. Decreasing rates of actual sediment accumulation
off axis will cause hydrothermal Mn deposition to be more ridge oriented than
even the present analysis suggests.
The difference in the magnitudes (but not shape) of the model and data Mn weight
fractions is caused primarily, we believe, by diagenetic processes in the sediment
column. The maximum measured weight percent of Mn in sediments (Figure
3c) is ~4.7%, but the model maximum value, taking a spatially invariant
sedimentation flux of 1.6g/cm/kyr [Dymond
and Roth, 1988], amounts to ~0.6%. The model particles bear only about
15% the amount of Mn as found in the surficial sediments. At depth (40 cm) in
the cores taken 15.6, 30, 43, and 308 km from the ridge, the Mn weight percents
are 0.2, 0.6, 0.6, and 0.1% (G. J. Massoth, unpublished data, 1987). These values
are only 13-20% of those near the surface (2.5 cm) of the core. Reduction of
Mn in an anoxic layer of sediments, dMn migration upward, and Mn reoxidation
in the upper layer of sediments would cause such profiles. Pore water nutrient
and Mn profiles from cores to the west of the ridge in Cascadia Basin [Jones
and Murray, 1985] suggest reducing conditions at depth in the sediments
and an oxic surface layer where dMn is rescavenged by particles.
The model benthic flux of dMn from the sediments back into the water column
(equation (5)) will have a distributional shape similar to that in Figure
3c. Magnitudes are approximately 10% those of the depositional flux
(Figure 3c); the maximum value of the
flux is -18 nmol/cm/yr under the model conditions
of Table 3. From two-point measurements at the top of MANOP Site M cores, Heggie
et al. [1986] inferred benthic flux rates for Mn of 8-18 nmol/cm/yr.
In the Guaymas Basin, where reducing conditions exist in sediments very near
surface, Campbell
et al. [1988] inferred flux rates of 130 ▒ 60 nmol/cm/yr
using similar analyses. Since neighboring Cascadia Basin surface sediments are
more oxidizing than reducing [Jones
and Murray, 1985], the model benthic fluxes of dMn seem to have a reasonable
magnitude range.
5.4. Source Strength
The hydrothermal Mn source flux, Q,
was determined by adjustment so that dMn and pMn values near the ridge would
have magnitudes similar to those measured (Figures
1a and 1b). The resulting value
of Q was 4.2 ū 10
g/m/s (1.4 ū 10 g/km/yr). Baker
and Massoth [1986] estimated the flux of Mn averaged over a 10-km-long
section of the southern JDFR at 11 ū 10
g/m/s, a value nearly 3 times that suggested by this model. The differences
in rates could be due to the shorter averaging time represented by the Baker
and Massoth [1986] analysis, or to spatial differences in hydrothermal
activity along the ridge crest. At the EPR, Lyle
[1976] estimated a Mn flux rate of 5 ū 10
g/km/yr, approximately 4 times that suggested by this model from JDFR data.
The larger weight fraction of Mn in sediments at the EPR compared to the JDFR
may make the difference meaningful.
g/km/yr). Baker
and Massoth [1986] estimated the flux of Mn averaged over a 10-km-long
section of the southern JDFR at 11 ū 10
g/m/s, a value nearly 3 times that suggested by this model. The differences
in rates could be due to the shorter averaging time represented by the Baker
and Massoth [1986] analysis, or to spatial differences in hydrothermal
activity along the ridge crest. At the EPR, Lyle
[1976] estimated a Mn flux rate of 5 ū 10
g/km/yr, approximately 4 times that suggested by this model from JDFR data.
The larger weight fraction of Mn in sediments at the EPR compared to the JDFR
may make the difference meaningful.
5.5. Sensitivity Analysis
The sensitivity of results to changes in a number of parameters away from the
values of Table 3 was examined. First k
was given a value of (1080 days), so that
k/k
would be 3 rather than 1/3. Mn remobilization from capsuled bacteria then occurs
over a period 3 times as long as the time scale for Mn scavenging. Exchange
equilibrium tilts more toward the direction of pMn. The resulting plume distributions
show less dMn at distance from the ridge; higher pMn concentrations to a distance
of ~150 km; higher flux of Mn to the sediments over the initial 150 km; less
pMn and lower flux of Mn to the seafloor beyond 150 km; concentrations reduced
for dMn and slightly elevated for pMn near the seafloor. The available data
for hydrothermal Mn at the JDFR cannot be used to differentiate between the
two values (0.33 and 3.0) used for k/k.
A comparison was then made of distributions when T(
= 1/k) equals 30, 60, and
180 days. The smaller value of T
forces more rapid fine particle scavenging by macroaggregates while larger value
indicates the opposite. For T
= 30 days, dMn and pMn concentrations in the water column are about half of
what they are for T = 60
days, the central T value
of the analysis (Table 3). Any Mn taken up by capsules is more quickly removed
to the sediments. Because the rate conversion of dMn to pMn was fixed as before,
however, the rate of formation of pMn is unchanged. The deposition pattern is
more sharply peaked than that of Figure 3c,
but the off-axis location of the maximum in the distribution is nearly the same.
When T = 180 days, remobilization
of Mn from capsules (T =
120 days, Table 2) plays more of a role. In this case, pMn persists in the water
column much longer, dMn stays elevated to a much larger distance, and the deposition
pattern is far less peaked than that of Figure 3c.
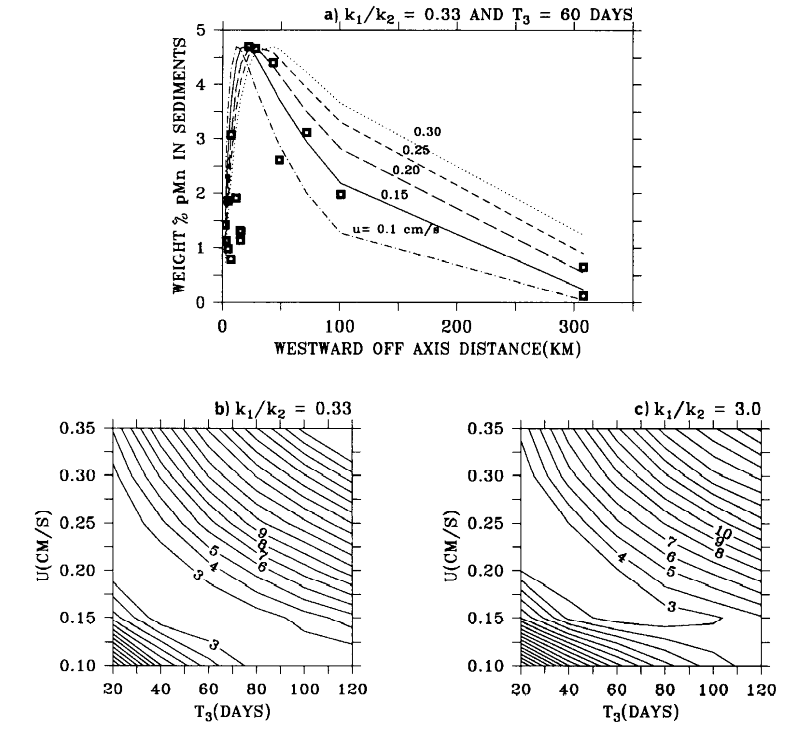
In order for the shape of the model Mn deposition pattern to resemble the shape
of the measured Mn weight percent in sediments (Figure
3c) for this T,
the off-axis advection speed would need to be very much less than 0.2 cm/s.
That relationship between T
and u was quantified by comparing the misfit of the model Mn depositional
flux distribution to the Mn weight percent data for sediments under various
values of the two parameters. To understand how this was done, consider the
differences in model deposition patterns when parameters are fixed as in Table
3, except K = 0, and u
is allowed to vary (Figure 5a). The curves
of Figure 5a represent Mn fluxes to the
sediments, but flux scales are not given; the left-hand scale refers to the
data only. As stated earlier in regard to Figure
3c, these fluxes should have the same distributional shape as the
measured weight percent of Mn in the sediments (boxes, Figure
5a). To make quantitative the differences between the modeled and
measured distributions, each flux curve was first rescaled so that the maximum
flux had the same ordinate value as the maximum measured weight percent. A sum-of-squared-error
measure of misfit was then evaluated. Only points at off-axis distances at and
beyond that corresponding to the maximum ordinate data value were included in
the sum, however. Otherwise, the difference errors for points at distances less
than 20 km (Figure 5a) dominate the misfit
sum, while the selection of "best fit" is more fairly based on the
difference errors for points beyond 20 km (Figure
5c). It is reasonably clear from inspection (Figure
5a) that a u value of 0.15 cm/s results in a flux distribution
having the essential features of the measured Mn weight percent distribution
in the sediments, when the other parameters are fixed as they are. The sum-of-squared-error
measure encompassing all data points, on the other hand, would result in a misfit
measure that could not differentiate between the quality of the fit provided
by any curve in Figure 5a.

Figure 5. (a) Distributions of model Mn flux to sediments (curves)
for varying off-axis advection velocities when T
= 60 days. Superimposed on model distributions are the measured weight percent
of Mn in surficial sediments (squares) from Table 2. Flux distributions have
been individually rescaled so that maximum has the same ordinate value as the
data maximum; flux scales are consequently not shown. The degree of misfit between
each distribution and the measured weight percents was calculated as the sum
of squared errors, as described in the text. (b) The resulting sum-of-squared-error
surfaces for a range of u and T
values when k/k
equals 0.33 and (c) when k/k
equals 3.
Values for the sum of the squared error were evaluated in this way for a range
of u and T values
and for two values of the k/k
ratio. The resulting error values were contoured in the u, T
plane (Figure 5b and 5c).
For both values of k/k,
the error surface shows a trough, indicating that nearly equivalent deposition
distributions can be obtained for a number of u and T
pairs. T and u are
also anticorrelated. If T
is small, i.e., rapid macroaggregate scavenging of fine particles, the observed
distribution of Mn in sediments is consistent only with a larger (e.g., 0.25
cm/s) off-axis component of advection. For a smaller velocity component (e.g.,
0.1 cm/s), rapid (T = 20
days) macroaggregate scavenging would cause the Mn to be deposited too close
to the ridge. Extending the deposition pattern off axis to resemble the data
for small u (e.g., 0.1 cm/s) requires that the macroaggregate scavenging
proceed at a slower rate (e.g., T
= 100 days, Figure 5b). This general picture
is not much changed if k/k
= 3.0 (Figure 5c). Since it seems reasonable
to think that T has a time
scale of the order of weeks to months, based on currently available reports,
the results (Figures 5b and 5c)
make it seem likely that u is in the range 0.1 to 0.3 cm/s.
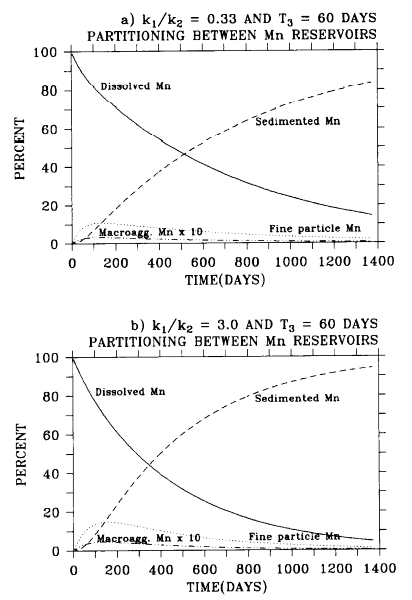
5.6. Residence Times
The residence time of hydrothermal Mn in the water column has been studied
with the model under the given parameter values (Table 3). The time dependent
solution of equations (1)-(3), with horizontal transport terms set to zero,
was examined for a unit impulse discharge of dMn at plume height. The constants
u and K can be set
to zero because, in calculating residence times, the horizontal location of
the tracer is immaterial. Water column concentrations of dMn, pMn, macroaggregate
Mn, and Mn deposited in the sediment were calculated in time over a period of
1400 days. Water column concentrations were integrated with height and all results
expressed as fractions of the original amount of Mn discharged. The consequent
time histories (Figure 6) show the passage of
Mn through all the three water column stages and into the sediments. The term
residence time can be defined in many different ways. In simple systems undergoing
exponential loss, the time for the concentration to be reduced to 1/e
(37%) its initial value can be called the residence time. The same definition
is used here: residence time will mean that time at which only 37% of the initial
amount of Mn remains in the water column.
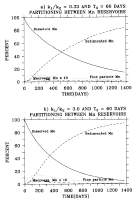
Figure 6. Percent of initial discharge in each of four Mn reservoirs as
a function of time. Parameter settings are as in Table 3, but with (a)
k/k
= 0.33 and (b) k/k
= 3.
The time histories (Figure 6a) show the
slow conversion of dMn to other Mn phases. After 100 days, more than 80% of
the Mn remains in dissolved form, while fine particulate Mn accounts for only
-10% of Mn stock. Because of this slow exchange, it is to be expected that near
the ridge Mn will be seen primarily in dissolved form. By 700 days, dMn is reduced
to 37% of the initial concentration and by 750 days, the residence time, 63%
of the initial Mn discharge has been deposited in the sediments. Note, however,
that even after 1400 days more than 10% of the stock remains as dMn. If the
off-axis advection is 0.2 cm/s (Table 3), for example, dMn levels should exceed
background dMn levels several fold even beyond 240 km from the ridge (Figure
4a).
These results are somewhat changed when the k/k
is set to 3 (Figure 6b). Remobilization
of Mn from capsule bacteria is less favored, so the dMn decreases more quickly.
Now at 700 days, little more than 20% of the Mn stock is in dMn form. The residence
time of Mn is shortened to ~500 days.
Figures 6a and 6b
show too that the hydrothermal fine particulate Mn stock never exceeds more
than -15% of the total hydrothermal Mn stock. Macroaggregate Mn is never more
than 0.5%, yet effectively all Mn passes through this stage to be deposited
in the sediments. Macroaggregate concentrations mirror the distribution of Mn
flux to the sediment (Figure 4c) under
exchange of time and space axes possible in the case of steady advection.
Interestingly, under these model conditions, by 1400 days (240 km when u
= 0.2 cm/s) more than 80% of the Mn is deposited in the sediments. This means
that much of the hydrothermal Mn is unavailable to the oceans over larger scales.
Still dMn concentrations are many times background beyond that distance (Figure
4a). Under actual conditions, the fraction deposited may not be quite
as high as depicted in Figure 6. Off axis, the
bottom falls away from ridge crest depths and longer settling distance may have
the effect of lengthening depositional time scales. On the other hand, the sediment
distribution pattern of Figure 1c will
still have to be accommodated, so the effect of sloping bathymetry may only
just force quickened scavenging or larger settling velocities. The consequences
of variable depth on the results has not yet been studied. With some of the
processes underlying the model, e.g., macroaggregate scavenging and release,
now so poorly understood, it does not seem warranted at this point.
Return to previous section or go to next section
PMEL Outstanding Papers
PMEL Publications Search
PMEL Homepage