U.S. Dept. of Commerce / NOAA / OAR / PMEL / Publications
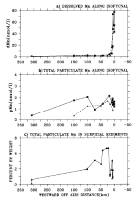
Figure 1. (a) Dissolved and (b) total particulate Mn as a function of distance normal to the Cleft segment of the JDFR ridge as measured (Table 1) in 1985 (solid curve) and 1986 (dashed curve). (c) Total particulate Mn as weight percent in surficial sediments (Table 2).
Figure 2. Diagram of the Mn reservoirs and exchange pathways incorporated in the scavenging model. The physical processes of advection and diffusion are not represented.
Figure 3. Model results under parameter conditions of Table 3 showing off-axis
transects of (a) dissolved manganese (dMn = T ) and (b) total particulate manganese (pMn = T
 + T
+ T ) at heights of (solid) 240 m and (dashed) 120 m. (c)
Model pMn flux (mg/cm
 /kyr) to the seafloor (solid curve)
and measured weight percent of Mn in surficial sediments (squares, Table 2).
Figure 4. Off-axis concentration distributions (T , T
, T , T
, T ) of the three water column phases of
hydrothermal Mn (nmol/L).
Figure 5. (a) Distributions of model Mn flux to sediments (curves) for
varying off-axis advection velocities when T = 60 days. Superimposed on model distributions are the
measured weight percent of Mn in surficial sediments (squares) from Table 2. Flux
distributions have been individually rescaled so that maximum has the same ordinate value
as the data maximum; flux scales are consequently not shown. The degree of misfit between
each distribution and the measured weight percents was calculated as the sum of squared
errors, as described in the text. (b) The resulting sum-of-squared-error surfaces
for a range of u and T
 values
when k
 /k
/k equals 0.33 and (c) when k
 /k
/k equals
3.
Figure 6. Percent of initial discharge in each of four Mn reservoirs as a function
of time. Parameter settings are as in Table 3, but with (a) k /k
/k = 0.33 and (b) k
 /k
/k = 3.
= 3.
Return to Abstract