U.S. Dept. of Commerce / NOAA / OAR / PMEL
/ Publications
Direct measurements of upper ocean currents and water properties
across the tropical Pacific during the 1990's
Gregory C. Johnson, Bernadette M. Sloyan1, William
S. Kessler, Kristene E. McTaggart
NOAA/Pacific Marine Environmental Laboratory, Seattle, WA 98115-6349,
USA
1Present address: Woods Hole Oceanographic Institution, Woods
Hole, MA 02543-1050, USA
Prog. Oceanogr. , 52 (1), 31-36,
2002.
Copyright 2002 Elsevier Science Ltd. Further
electronic
distribution is not allowed.
Abstract
Meridional sections of upper ocean zonal currents, potential temperature,
and salinity are estimated at ten longitudes from 143°E to 95°W
using ConductivityTemperatureDepth and Acoustic Doppler Current Profiler
data from 172 synoptic sections taken in the tropical Pacific between 138°E
and 86°W, mostly in the 1990s. Data reduction is carried out in a potential
isopycnal and mixed layer framework to preserve a sharp pycnocline, a mixed
layer, water property extrema, and velocity extrema. Mean zonal currents, potential
temperatures, and salinities are produced at each longitude. The seasonal
cycles of these fields are also estimated, as well as a simple El Niño Southern
Oscillation (ENSO) cycle. Zonal sections along the equator are also presented.
Properties of the near-equatorial zonal currents, including transports, temperatures,
and salinities, are estimated separately from the synoptic sections. The seasonal
cycles of these quantities and their correlations with the Southern Oscillation
Index are investigated. The work is distinguished from most existing literature
in that direct estimates of zonal velocity are combined with contemporaneous
temperature and salinity data, allowing trans-Pacific estimates of near-equatorial
current transports and properties, including those of the northern branch of
the South Equatorial Current, the New Guinea Coastal Undercurrent, and the
Equatorial Undercurrent.
1. Introduction
There have been many studies of the tropical Pacific Ocean circulation, but
only a few have provided sufficient data to describe the mean temperature,
salinity, and current field and estimate current transports from contemporaneous
observations. The Hawaii-to-Tahiti Shuttle experiment provided a picture of
the mean geostrophic currents and water masses in the central tropical Pacific
(Wyrtki & Kilonsky, 1984) that is still a standard. This study used ConductivityTemperatureDepth
(CTD) and bottle data taken along 43 meridional sections from 15 cruises between
April 1979 and August 1980. The shipboard Acoustic Doppler Current Profiler
(ADCP) data from these cruises, which were only available over a very limited
depth range and with low-quality navigational data by modern standards, have
also been thoroughly exploited to examine energy and momentum balances (Johnson & Luther,
1994). In the western Pacific, CTD and ADCP or profiler data (when available)
from several observational programs between 1984 and 1991 (27 sections at 165°E
and nine at 142°E) were used in a dynamical interpretation of the local
mean circulation (Gouriou & Toole, 1993). Earlier, 21 of these sections
had been used to look at the 19861987 El Niño and the subsequent La Niña (Delcroix,
Eldin, Radenac, Toole, & Firing, 1992). In the central and eastern Pacific,
meridional CTD/ADCP sections have been used primarily to diagnose horizontal
divergence and infer upwelling, with some discussion of the mean zonal currents
(Johnson, McPhaden, & Firing, 2001). Variations in the salinity maximum
and zonal advection in the southern branch of the South Equatorial Current
(SEC) have been analyzed using CTD data (Kessler, 1999). The termination of
the Equatorial Under-Current (EUC) has also been examined with historical hydrographic
data in the eastern Pacific (Lukas, 1986). Finally, the structure of the Subsurface
Counter Currents (SCCs) has also recently been examined across the Pacific
with meridional CTD/ADCP sections (Rowe, Firing, & Johnson, 2000).
Systematic studies of seasonal and interannual variability of tropical Pacific
Ocean current transports have been mostly limited to expendable bathythermograph
(XBT) data (Donguy & Meyers,
1996; Kessler & Taft,
1987; Taft & Kessler,
1991; Picaut & Tournier,
1991). These studies relied on regional potential
temperaturesalinity ( S) relations
and the geostrophic balance. This reliance means that they have usually been
limited to assuming a zero-velocity surface at 400 m. The wind-driven component
of the zonal velocity and other ageostrophic terms have been neglected so,
although they can be significant near the equator (Bryden & Brady,
1985;
Joyce,
Lukas, & Firing, 1988). In addition, application of geostrophy on
the equator is not a trivial exercise. The small meridional density gradients
associated with geostrophic zonal velocity on the equator are easily aliased
by internal waves and other transients (Hayes,
1982; Lukas & Firing,
1985;
Moum,
Chereskin, Park, & Regier, 1987; Picaut,
Hayes, & McPhaden, 1989;
Picaut & Tournier,
1991; Cornuelle,
Morris, & Roemmich, 1993; Lagerloef,
Mitchum, Lukas, & Niiler, 1999). Thus careful temporal and spatial
smoothing is required. Often studies based on XBTs omit current transport estimates
near the equator altogether.
S) relations
and the geostrophic balance. This reliance means that they have usually been
limited to assuming a zero-velocity surface at 400 m. The wind-driven component
of the zonal velocity and other ageostrophic terms have been neglected so,
although they can be significant near the equator (Bryden & Brady,
1985;
Joyce,
Lukas, & Firing, 1988). In addition, application of geostrophy on
the equator is not a trivial exercise. The small meridional density gradients
associated with geostrophic zonal velocity on the equator are easily aliased
by internal waves and other transients (Hayes,
1982; Lukas & Firing,
1985;
Moum,
Chereskin, Park, & Regier, 1987; Picaut,
Hayes, & McPhaden, 1989;
Picaut & Tournier,
1991; Cornuelle,
Morris, & Roemmich, 1993; Lagerloef,
Mitchum, Lukas, & Niiler, 1999). Thus careful temporal and spatial
smoothing is required. Often studies based on XBTs omit current transport estimates
near the equator altogether.
In this study upper ocean currents and water-masses are analyzed at 10 longitudes
from 143°E to 95°W, spanning most of the zonal extent of the equatorial
Pacific. Zonal velocity, potential temperature, and salinity data are presented.
The mean fields, as well as their seasonal cycle and linear correlation with
the Southern Oscillation Index (SOI, which refers hereafter to the 5-month
running mean of normalized monthly values) are estimated. This work uses 172
synoptic meridional CTD/ADCP sections collected in the tropical Pacific. These
data were taken mostly in the 1990s, the majority during the maintenance of
the Tropical Ocean-Atmosphere (TAO) and Triangle Trans-Ocean Buoy Network (TRITON)
moorings (Hayes, Mangum, Picaut, Sumi, & Takeuchi, 1991; McPhaden et al.,
1998).
The paper is structured as follows. The data and their processing are discussed
in Section 2. In Section 3 the zonal currents, temperature, and salinity are
described. First the means are discussed at all longitudes and along the equator,
then the seasonal cycle and the response to the SOI are discussed at western,
central, and eastern longitudes as well as along the equator. In Section 4,
aspects of the major near-equatorial zonal currents are presented quantitatively
through analyses of current transports, positions, and water properties estimated
from the synoptic meridional sections. Section 5 concludes the paper.
2. Data and fitting
The 172 synoptic and nominally meridional CTD/ADCP sections used in this study
were observed from June 1985 through December 2000 between 138°E and
86°W (Fig. 1). Of these, 103 sections were taken during TAO mooring array
maintenance cruises from June 1991 through December 2000 between 165°E
and 95°W. The cruises were on the NOAA Ship Discoverer in the
first half of the decade (e.g. Johnson & Plimpton, 1999) and the NOAA Ships Kaimimoana and Ronald
H. Brown for the second half of the decade (e.g. McTaggart & Johnson,
1999). Another 29 sections were taken on the R/V Kaiyo as part of the
Tropical Ocean Climate Study (TOCS; Kashino et al., 2001). The bulk of the
remaining sections came from the World Ocean Circulation Experiment (WOCE;
Firing, Wijffels, & Hacker, 1998) one-time hydrographic survey, the United
States/Peoples Republic of China cooperative program for AirSea Interaction
(US/PRC; Gouriou & Toole,
1993), the US Joint Global Ocean Flux Study (JGOFS) Equatorial Pacific Process
Study (Murray, Johnson, & Garside, 1995), the Tropical Ocean Global Atmosphere
Coupled OceanAtmosphere Response Experiment (TOGACOARE; Eldin et al., 1994),
and the Western Equatorial Pacific Ocean Circulation Study (WEPOCS; Tsuchiya,
Lukas, Fine, Firing, & Lindstrom, 1989).
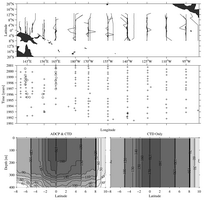
Fig. 1. CTD/ADCP section data distribution. Top panel shows latitudes and
longitudes of the 172 meridional sections used in this study. Middle panel
shows times when these sections crossed the equator. Sections occupied between
1991 and 2001 are shown by (+). Sections occupied between 1985 and 1991 are
shown by (O), with 10 years added for compactness. Bottom left panel shows
(contoured at intervals of 10 with increasingly dark contours indicating more
data) number of sections where ADCP and CTD data are available in the meridional-vertical
plane. Bottom right panel follows bottom left but for number of sections with
CTD data alone.
The sections were occupied along ten nominal longitudes (Fig.
1; 143°E,
156°E, 165°E, 180°E, 170°W, 155°W, 140°W,
125°W, 110°W, and 95°W). At each longitude occupations tended
to be separated by roughly 6 months or more. Except for 18 sections occupied
from 1985 though 1990 along 165°E as part of US/PRC and WEPOCS, the sections
were fairly evenly distributed by year through the 1990s, with as few as six
in 1991, and as many as 23 in 1997. In longitude the sections were somewhat
more concentrated in the western and central Pacific than in the eastern Pacific,
with as many as 34 at three closely-spaced longitudes around 143°E and
21 at 140°W, and as few as 12 at both 110°W and 95°W. The
distribution through the seasonal cycle was biased toward boreal fall. The
most uneven 3-month groupings had 61 sections in SeptemberNovember, 37 sections
in DecemberFebruary, 35 in MarchMay, and 39 in JuneAugust. The section
times also tended slightly to favor El Niño conditions, as did the 1990s. The
mean and standard deviation of the SOI at the section times was 0.3 ± 1.0,
the same statistics as for the period of mid-1991 through 2000.
First, the ADCP and CTD data for each individual, quasi-synoptic section have
been gridded between 8°S and 13°N following Johnson, McPhaden, Rowe,
and McTaggart (2000). The ADCP generally measures velocity at depths between
about 20 and 300450 m in 8-m bins, although some earlier measurements extend
down only to about 200 m. These velocities are objectively mapped assuming
a Gaussian covariance, a meridional correlation length scale of 1°, a
vertical correlation length scale of 25 m, and a noise-to-signal energy ratio
of 0.01. The objective mapping uses shear in the upper water column to extrapolate
velocities to the surface. The CTD temperature, salinity, and pressure data
are usually sampled from the surface to at least 1000 dbar at 1-dbar spacing
in the vertical and 1° latitude in the horizontal. The station spacing
is often 0.5° within ±3° of the equator, but occasionally
exceeds 1°,
mostly in the earlier part of the decade. These fields are gridded somewhat
differently from the ADCP data. They are splined in latitude on isopycnals
to a regular, closely spaced grid. Both the CTD and the ADCP data are concentrated
about the equator (Fig. 1).
Once the individual, quasi-synoptic sections have been gridded, their potential
temperature, salinity, and zonal velocity fields are then analyzed around each
of the ten nominal longitudes listed above. For this analysis an isopycnal
averaging procedure is applied to potential temperature, salinity, depth, and
zonal velocity. This procedure better preserves a sharp pycnocline, water properties,
and velocity extrema by reducing the smearing effects of isopycnal heave (Lozier,
McCartney, & Owens, 1994). By following isopycnals, the averaging is quasi-Lagrangian
in the vertical. In contrast to isobaric averaging, this process results in
a very sharp thermocline, typical of the strength of a synoptic section. The
mixed layer temperature, salinity, and depth as well as zonal velocity are
analyzed separately, allowing for vertical shear in the mixed layer zonal velocity.
The mixed layer analysis is connected to the permanent pycnocline with a shape-preserving
spline (Akima, 1970).
For the averaging, potential temperature, salinity, zonal velocity and depth
are independently interpolated onto a closely-spaced latitudinal and isopycnal
grid (just latitudinal for the mixed-layer). Data at each latitude and isopycnal
from all sections within about 20° of the target longitude are least-squares
fitted to a polynomial function of longitude, an annual harmonic, and the SOI.
Fitting sections from two or three nominal longitudes means data from more
months of the year and in more phases of the SOI are included. At most locations
there are data from three nominal longitudes, and the polynomial is second
order. However, at the westernmost and easternmost lines at 143°E and
95°W, and anywhere else where only data from two nominal longitudes are
available, the polynomial reverts to first order. For the second order cases
the fit for the data D looks like D = a + bx + cx2 + d sin(2 t/T)
+ f cos(2t/T)
+ gS, where ag are the fit coefficients, x is
the longitude, t is the time (in years) when the data were taken, T is
the period of a year, and S is the value of the SOI interpolated to
the time t. Averages are displayed only where more than 16 sections
are locally available for fitting.
t/T)
+ f cos(2t/T)
+ gS, where ag are the fit coefficients, x is
the longitude, t is the time (in years) when the data were taken, T is
the period of a year, and S is the value of the SOI interpolated to
the time t. Averages are displayed only where more than 16 sections
are locally available for fitting.
3. Zonal velocity, potential temperature, and salinity fields
This data set allows an investigation into the longitudinal, seasonal, and
interannual evolution of the mean upper ocean zonal currents and water masses
across the equatorial Pacific. The mean zonal velocity sections at the ten
longitudes and along the equator are discussed first and then related to mean
sections of potential temperature and salinity. Following this discussion of
the means, the seasonal cycle and the linear regression against the SOI (a
simple means of evaluating the ENSO cycle) are described at a western longitude,
a central longitude, and an eastern longitude, as well as along the equator.
3.1. The mean fields
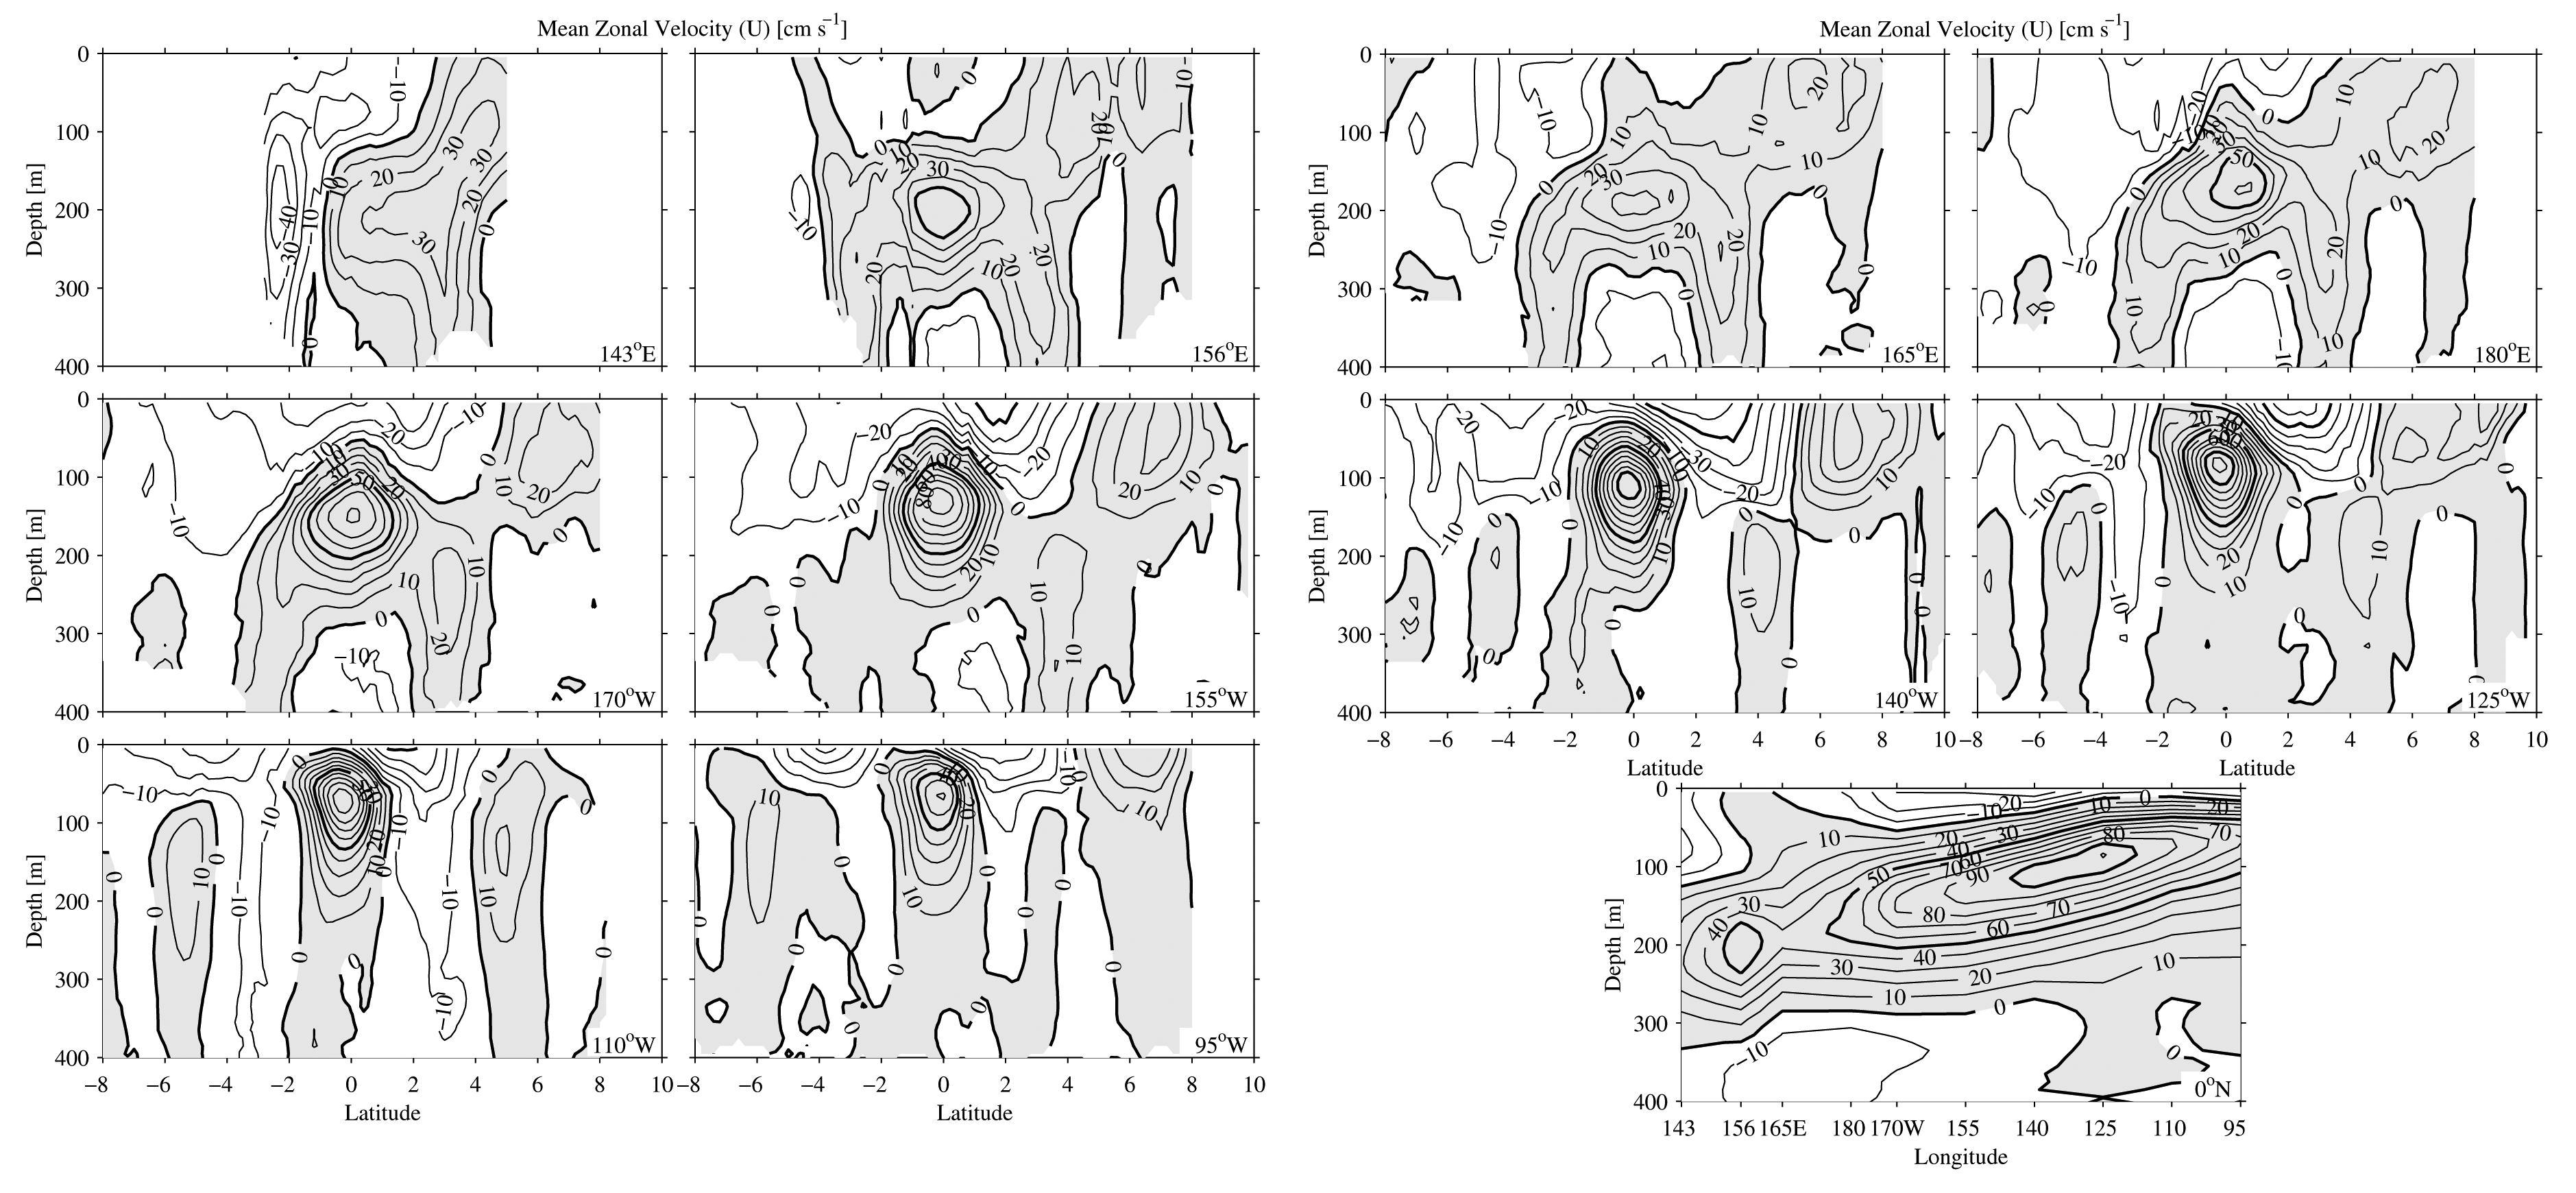
The mean sections of zonal velocity (Fig. 2) show the two major westward currents
(unshaded regions), the SEC, and the Equatorial Intermediate Current (EIC).
The surface-intensified SEC is split into a northern and a southern branch
(Wyrtki, 1974a), herein referred to as SEC(N) and SEC(S). At 155°W the
SEC(N) is centered at 2°N and the SEC(S) at 3°S. These branches
are separated by a near-equatorial minimum in westward surface flow, or sometimes
by eastward surface flow (McPhaden & Taft, 1988). The EIC (Delcroix & Henin,
1988) is most obvious in the western half of the basin. At 155°W it is
centered around 1°N at 350 m. In the far western section, at 143°E,
the zonal component of the New Guinea Coastal Undercurrent (NGCUC; Tsuchiya
et al., 1989; Butt & Lindstrom, 1994), a western boundary current, is centered
near 200 m at 2.5°S, just off the coast.
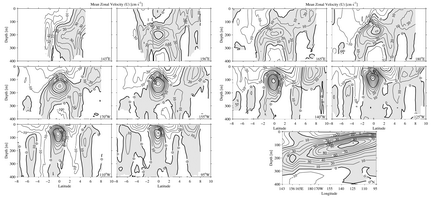
Fig. 2. Sections of mean zonal velocity (U) estimated at 10 nominal
longitudes and along the equator. Locations marked in the bottom right corner
of each section. Contour interval is 10 cm s–1, with heavy
contours at 50 cm s–1 intervals. Eastward velocities are shaded.
The SEC(N) is strongest in the central Pacific, building in strength as it
flows from 95°W to 140°W, but then declining almost to nothing
by 165°E, and continuing to be weak to 143°E. Like the SEC(N),
the SEC(S) is surface-intensified in the east where the thermocline is shallow,
but it deepens considerably toward the dateline. The SEC(S) also builds in
strength from the eastern to the central Pacific, but maintains its strength
further west, weakening by 156°E. Both branches of the SEC have deep
extensions in the east that extend far below the thermocline (Fig.
3). These
deep branches are strongest at 110°W, but are visible from 140°W
to 95°W.
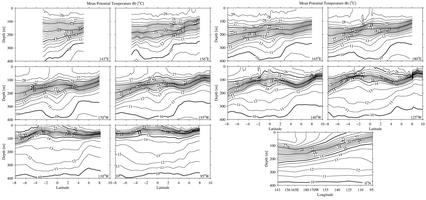
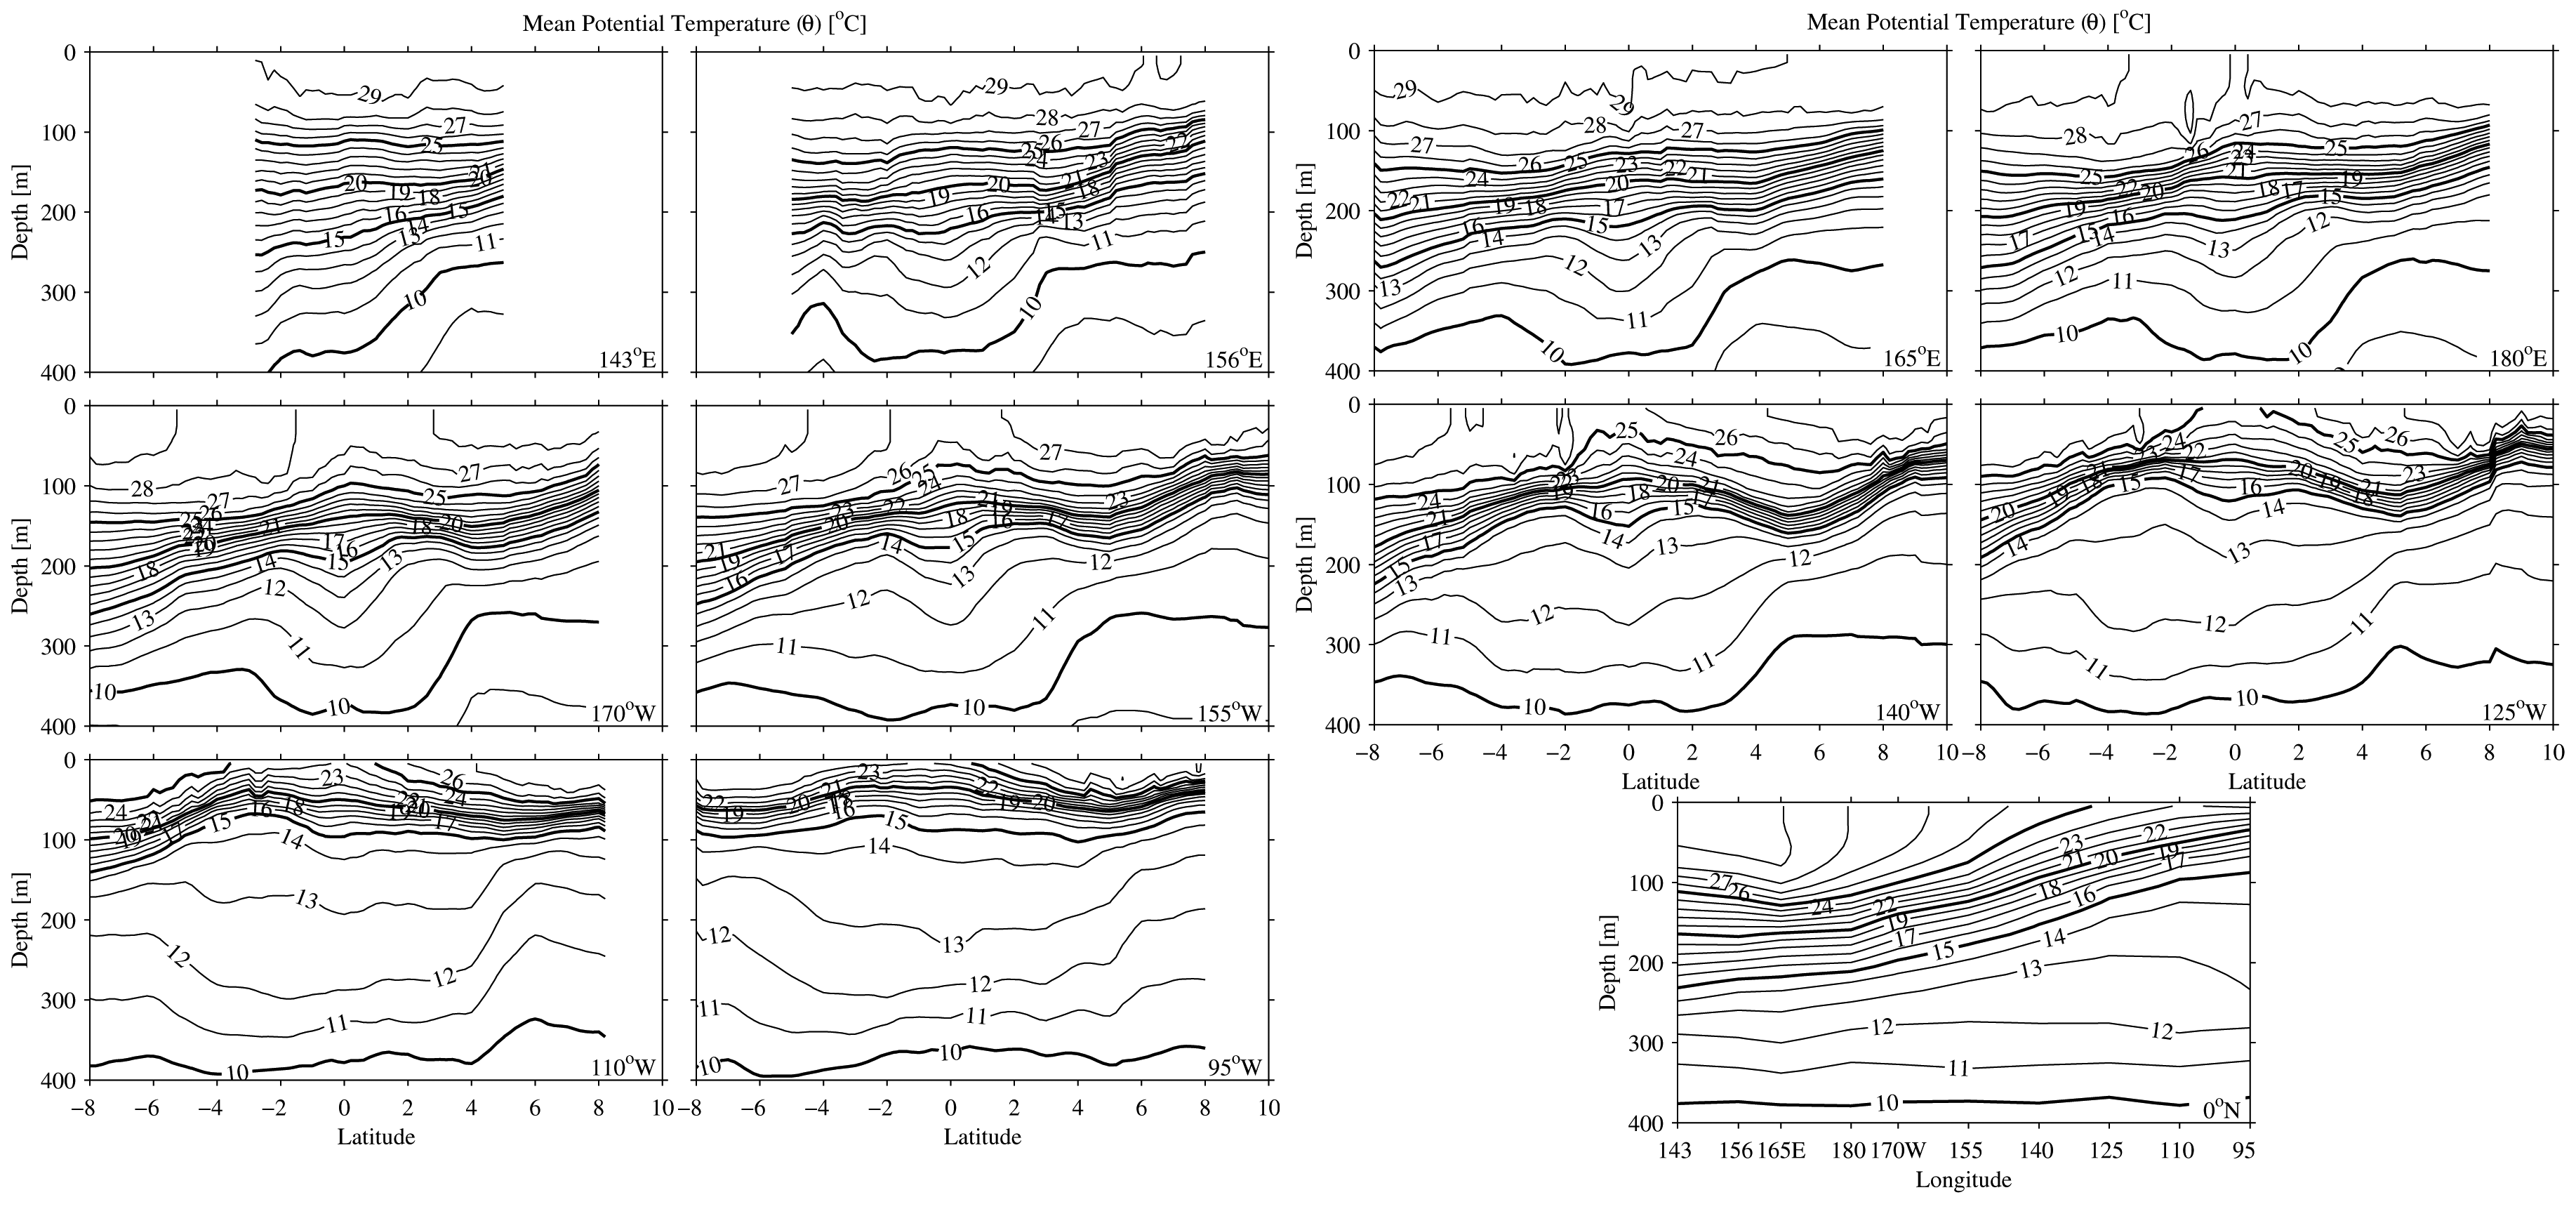
Fig. 3. Sections of mean potential temperature ()
estimated at 10 nominal longitudes and along the equator, following Fig. 2.
Contour interval is 1°C, with heavy contours at 5°C.
The EIC is very weak or nonexistent in the east, and in some sections it is
apparent only as a minimum in eastward velocity near 350 m at the equator.
By 155°W a robust EIC is centered near 350 m at 1°N, but to the
west of that longitude it shifts equatorward. The current strengthens and deepens
from 155°W to 165°E, becoming too deep to be fully sampled by the
ADCP measurements, which tend to drop out below 350 m. The deep extension of
the SEC(N) in the east may be connected to the EIC in the west.
The NGCUC is only evident at 143°W, as a subsurface velocity maximum
in the south of the section. This current is not discussed extensively in other
sections since it is not a transpacific current. However, the feature is significant
to the general circulation, so some statistics are computed from the mean section.
The NGCUC mean zonal volume transport is about 19 × 106 m3 s1,
with a velocity-weighted potential temperature of 18.85°C, salinity of
35.18, and potential density anomaly of 25.06 kg m3.
Eastward currents (Fig. 2, shaded regions) include the EUC, the North Equatorial
Countercurrent (NECC), and the SCCs. At 140°W the core of the EUC is
located near 110 m at the equator and the NECC is a near-surface current centered
around 7°N. The SCCs, or Tsuchiya Jets (Tsuchiya, 1975; Johnson & Moore,
1997), are deeper eastward currents, also known as the Northern Subsurface
Countercurrent (NSCC) and the two branches of the Southern Subsurface Countercurrent
(SSCC). At 140°W the NSCC is centered near 200 m at 4°N and the
two SSCCs are centered near 200 m at 4.5°S and near 250 m at 7°S,
respectively. In addition, the northern edge of the surface-intensified South
Equatorial Countercurrent (SECC) can be seen in some of the sections in the
west, for instance, near 8°S at 165°E.
The EUC starts out deep and relatively weak at 143°E, where it is displaced
to the north of the equator by the NGCUC (Fig. 2). The EUC strengthens to 156°E,
but then appears to weaken at 165°E before building up to full strength
between 155°W and 125°W, and then weakening considerably by 95°W.
The maximum EUC velocity occurs at 125°W. The EUC shoals steadily eastward
to 110°W, with its center in the thermocline, near = 17°C
(Fig. 3). This behavior is in agreement with a velocity climatology derived
from TAO moored current meter and ADCP data (Yu & McPhaden, 1999). Their
data were not resolved sufficiently spatially to show the EUC weakening near
165°E, but similar behavior does emerge from models (Fig. 8 of Vintzileos,
Delecluse, & Sadourny, 1999) and observations suggest there is a reversal
in the zonal pressure gradient at the core of the EUC near these longitudes
(Fig. 2 of Johnson et al., 2000). On the other hand the EUC weakening at 165°E
could be an artefact caused by insufficient sampling. Around 140°W, where
the trade winds are at their peak, the entire equatorial current system (including
the EUC, the SEC(N) and the NECC) is most intense, in qualitative agreement
with surface drifter climatological velocities (Reverdin, Frankignoul, Kestenare, & McPhaden,
1994; Johnson, 2001).
The NECC shifts northwards from 4°N at 143°E to 6°N at 165°E and then to about 8°N
at 125°W (Fig. 2). The velocity maximum in the NECC starts out strong
at 143°E, weakens to 165°E, re-builds to 140°W before weakening
significantly and shifting southwards at 110°W. It once again rebuilds
and shifts back north at 95°W. This pattern is once more consistent with
surface velocities from drifters. The pattern in the eastern and central Pacific
is also expected from the Sverdrup relation (Kessler, 2002). At many latitudes
the NECC velocity maximum is slightly subsurface, which is the result of a
combination of two factors: firstly, the westward Ekman tendency at the surface
from southerly winds, and secondly, a nearsurface geostrophic tendency toward
westward flow induced by northward surface warming and freshening across the
NECC.
The SCCs also evolve from west to east (Fig. 2). In the west, the SCCs appear
as deep lobes on the EUC with velocity maxima approaching 30 cm s1.
The SCCs shift poleward and upward to the east. By 140°W they are fully
separated from the EUC. In synoptic sections the SCCs are still strong in the
central Pacific (Rowe et al., 2000), but because they are surrounded by westward
flow and meander significantly, probably influenced by tropical instability
waves (TIWs; Baturin & Niiler, 1997), they are
weak in the mean. By 110°W the SSCCs are quite shallow and have shifted
significantly poleward, with the southern SSCC lying south of 8°S. By
95°W the NSCC has all but disappeared, likely having turned north under
the Costa Rica Dome (Johnson & McPhaden, 1999; Kessler, 2002). The
NSCC and NECC are sometimes difficult to separate, with only a minimum in eastward
velocity found between them.
Finally, a portion of the South Equatorial Countercurrent (SECC; Reid, 1959,
1961; Merle, Rotschi, & Voituriez, 1969; Wyrtki, 1974a; Eldin, 1983; Kessler & Taft,
1987; Delcroix, Eldin, & Henin, 1987) is visible at the southern edge of
the sections at 165°E to 170°W in the mean. However, the sampling
of this current is insufficient for discussion here.
The shape of the thermocline is related to these currents through the geostrophic
balance (Fig. 3). Isotherms slope up toward the equator below the SEC, as
the thermocline sharpens approaching ±2° latitude. Inside of this
range, the thermocline spreads vertically around the zonal velocity maximum
of the EUC, as geostrophy requires. There is a poleward thermocline uplift
in the northern portion of the sections that is geostrophically associated
with the NECC, and a slight poleward uplift in the very southern portion of
the western sections that is associated with the SECC. The sharp subthermocline
meridional fronts in temperature, found poleward of the tropical 13°C
thermostad, are associated with the SSCC and NSCC. The thermostad builds poleward
to the east as these currents, which flank it, move poleward under the shoaling
thermocline to conserve potential vorticity (Johnson & Moore, 1997). Finally,
isotherms pinch equatorward below this thermostad, near 11°C, associated
with a relative minimum in eastward flow in the east and the westward flowing
EIC in the west.
In the equatorial region the thermocline shoals eastward and thereby provides
the zonal pressure gradient on the equator that drives the EUC (Fig.
3). In
the western equatorial Pacific the trade winds pile up a thick layer of warm
surface water above a deep thermocline, the warm pool (Webster & Lukas,
1992), while in the eastern equatorial Pacific the thermocline rises to the
surface, creating the cold tongue (Bryden & Brady, 1985). There is a subtle
reversal of isotherm slopes below about 15°C between 156°E and
165°E (and hence in zonal pressure gradient) that is concordant with
a reduction in the strength of the EUC at 165°E (Fig.
2). The overall
mean picture along the equator is very similar to a climatology from TAO moorings
(Yu & McPhaden, 1999). The thermocline also sharpens to the east as it
shoals, especially off the equator (Fig. 3).
The salinity field (Fig. 4) shows the influence of heavy rain under the intertropical
convergence zone (ITCZ) in the east and the warm pool in the west. Fresh surface
values are found in these regions. In addition, equatorward advection of water
subducted in the subtropics is evident as tongues of high salinity southern
water and low salinity northern water. The tongues extend toward the equator
at the level of the EUC. The high-salinity tongue in the pycnocline extends
northward and westward from the southeast Pacific, and is associated with equatorward
thermocline flow that feeds the EUC (Johnson & McPhaden, 1999), driven
by the zonal pressure gradient resulting from the thermocline slope. The strong
meridional salinity front within the thermocline on the equator reflects equatorial
convergence of these salty southern and fresher northern waters, feeding the
EUC. An isolated salinity maximum is found at a depth of about 80 m just south
of the equator east of 155°W. This feature is the result of eastward
advection of this salty water in the EUC, which is surrounded by the westward
advection of fresher water in both branches of the SEC. Fed from the western
and central Pacific, this feature is remarkably persistent, flowing eastward
in the EUC over 5000 km (Fig. 4). In the west, there is a chimney of salty
water near the equator that appears to extend up into the mixed layer. This
feature is better discussed in the context of the seasonal cycle below.
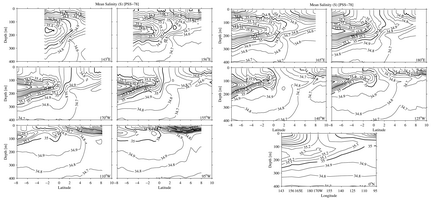
Fig. 4. Sections of mean salinity (S) estimated at 10 nominal longitudes
and along the equator, following Fig. 2. Contour interval is 0.1, with heavy
contours at 0.5.
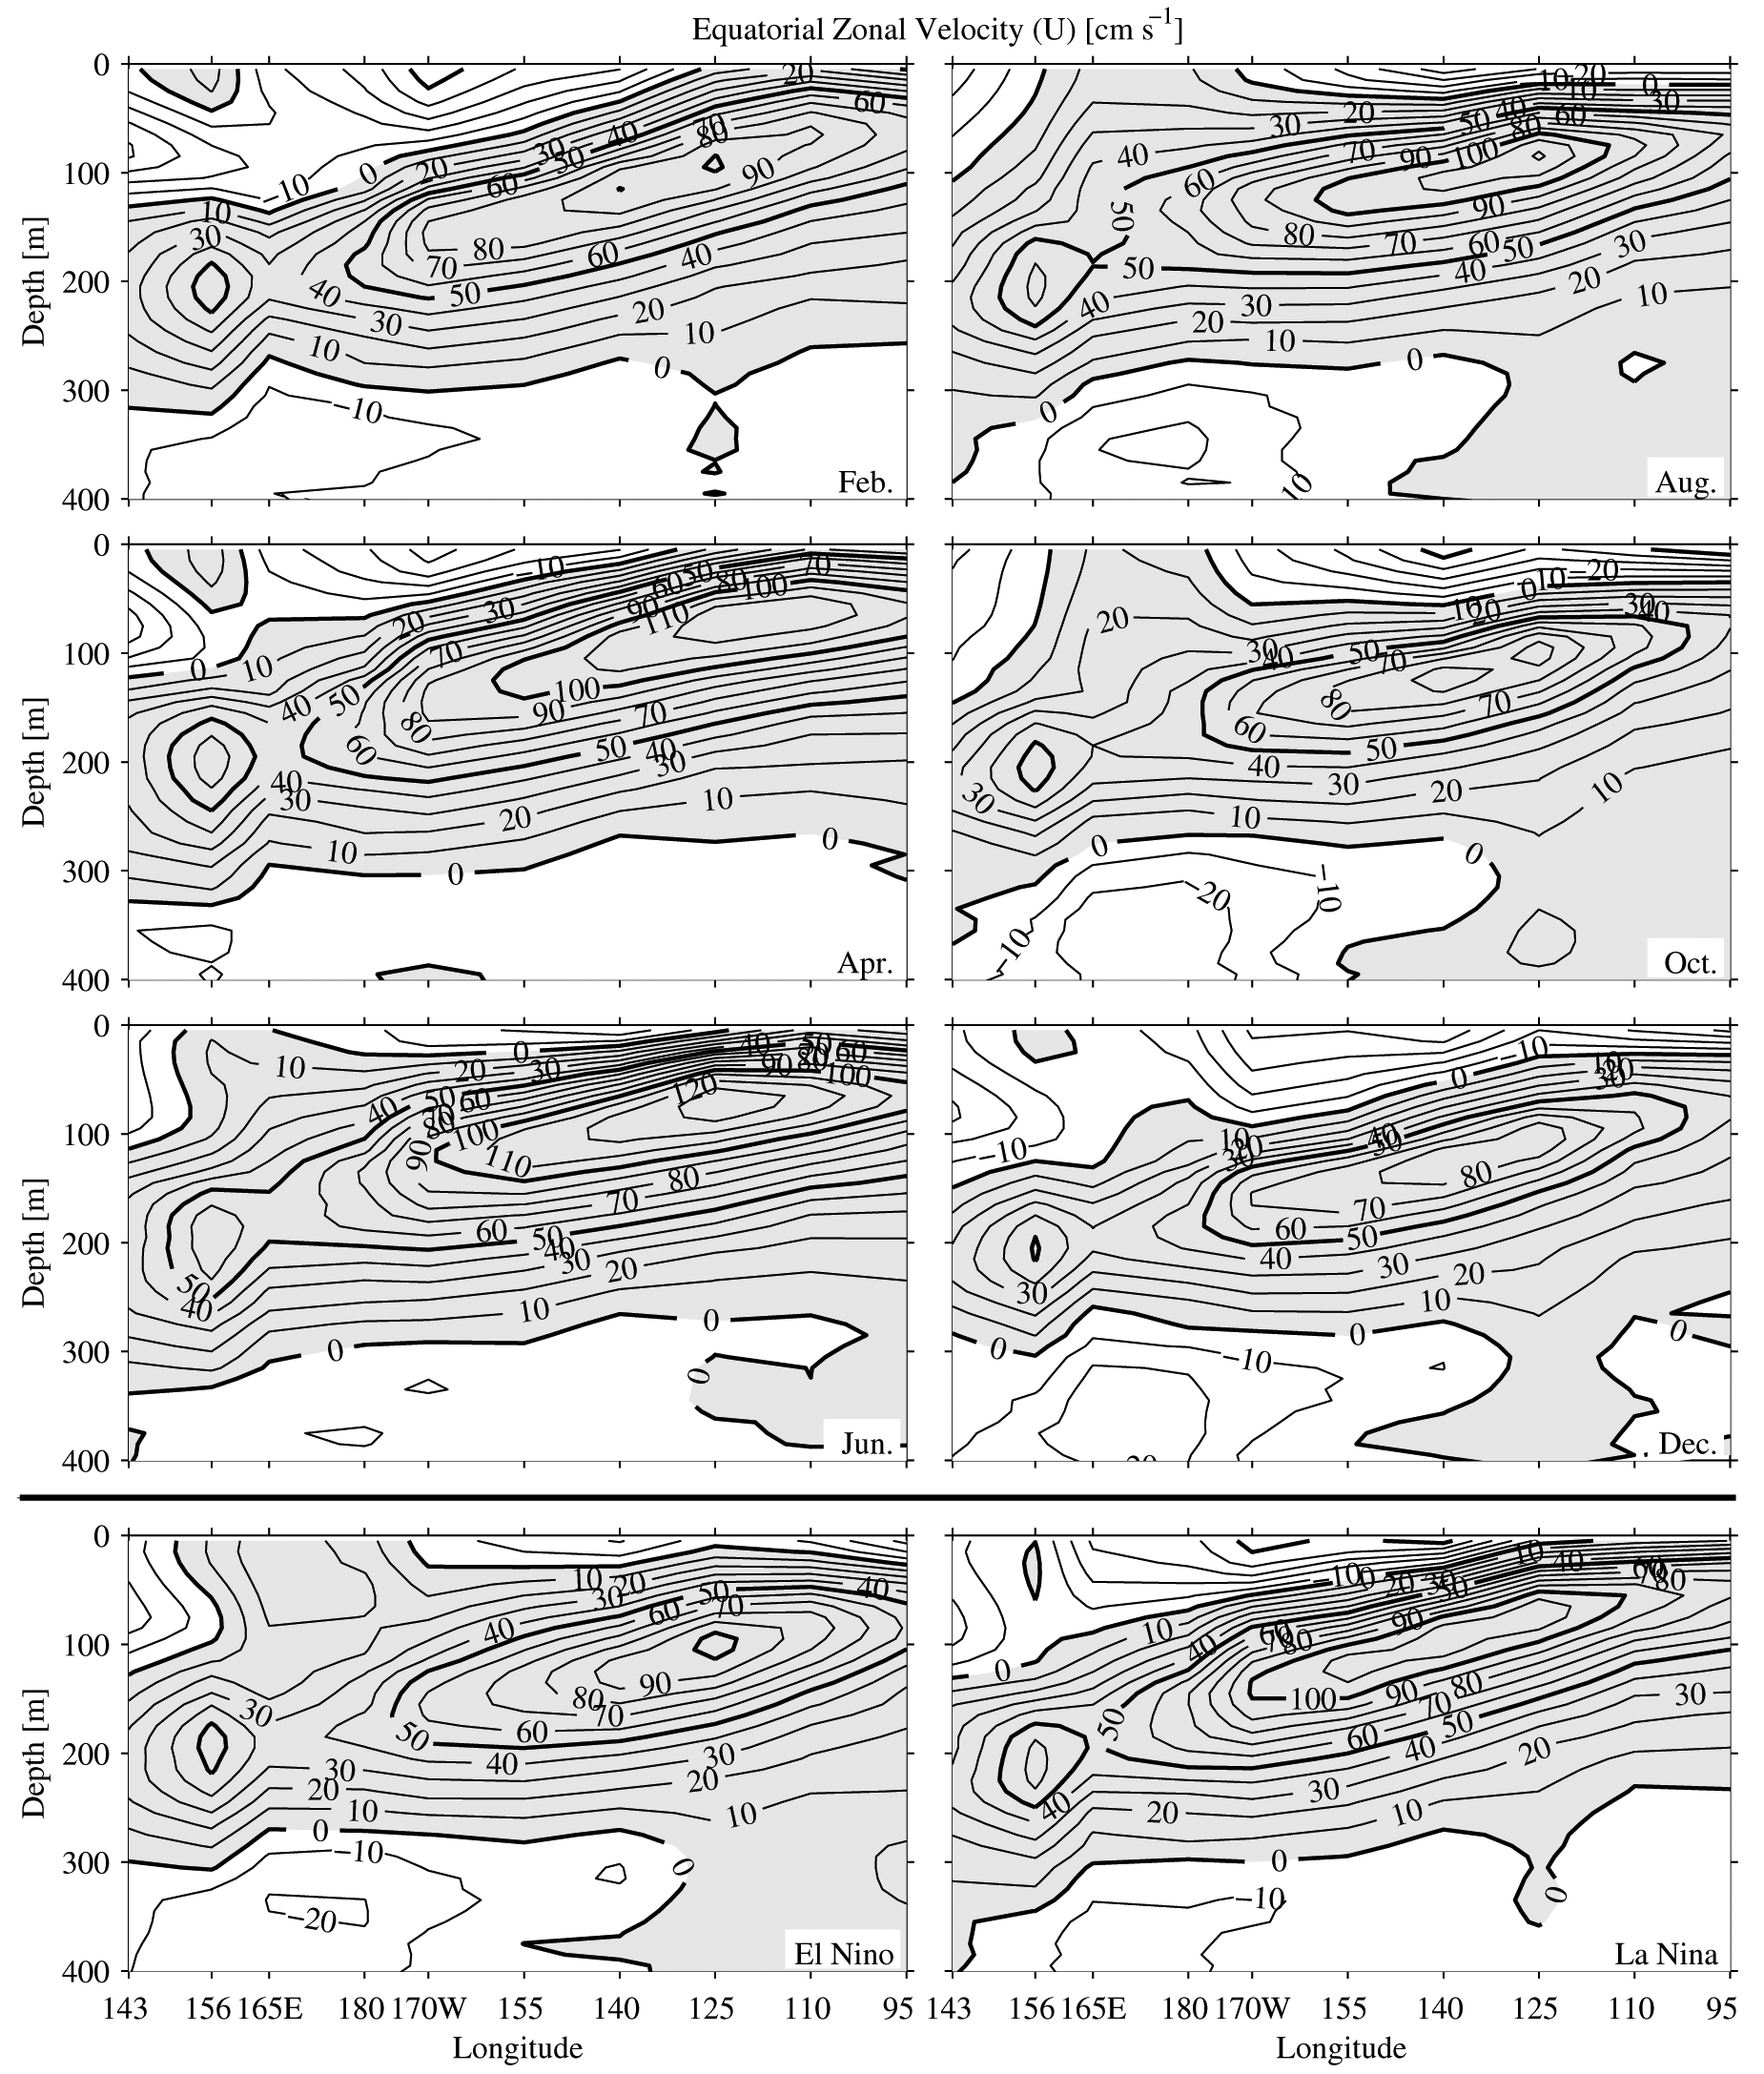
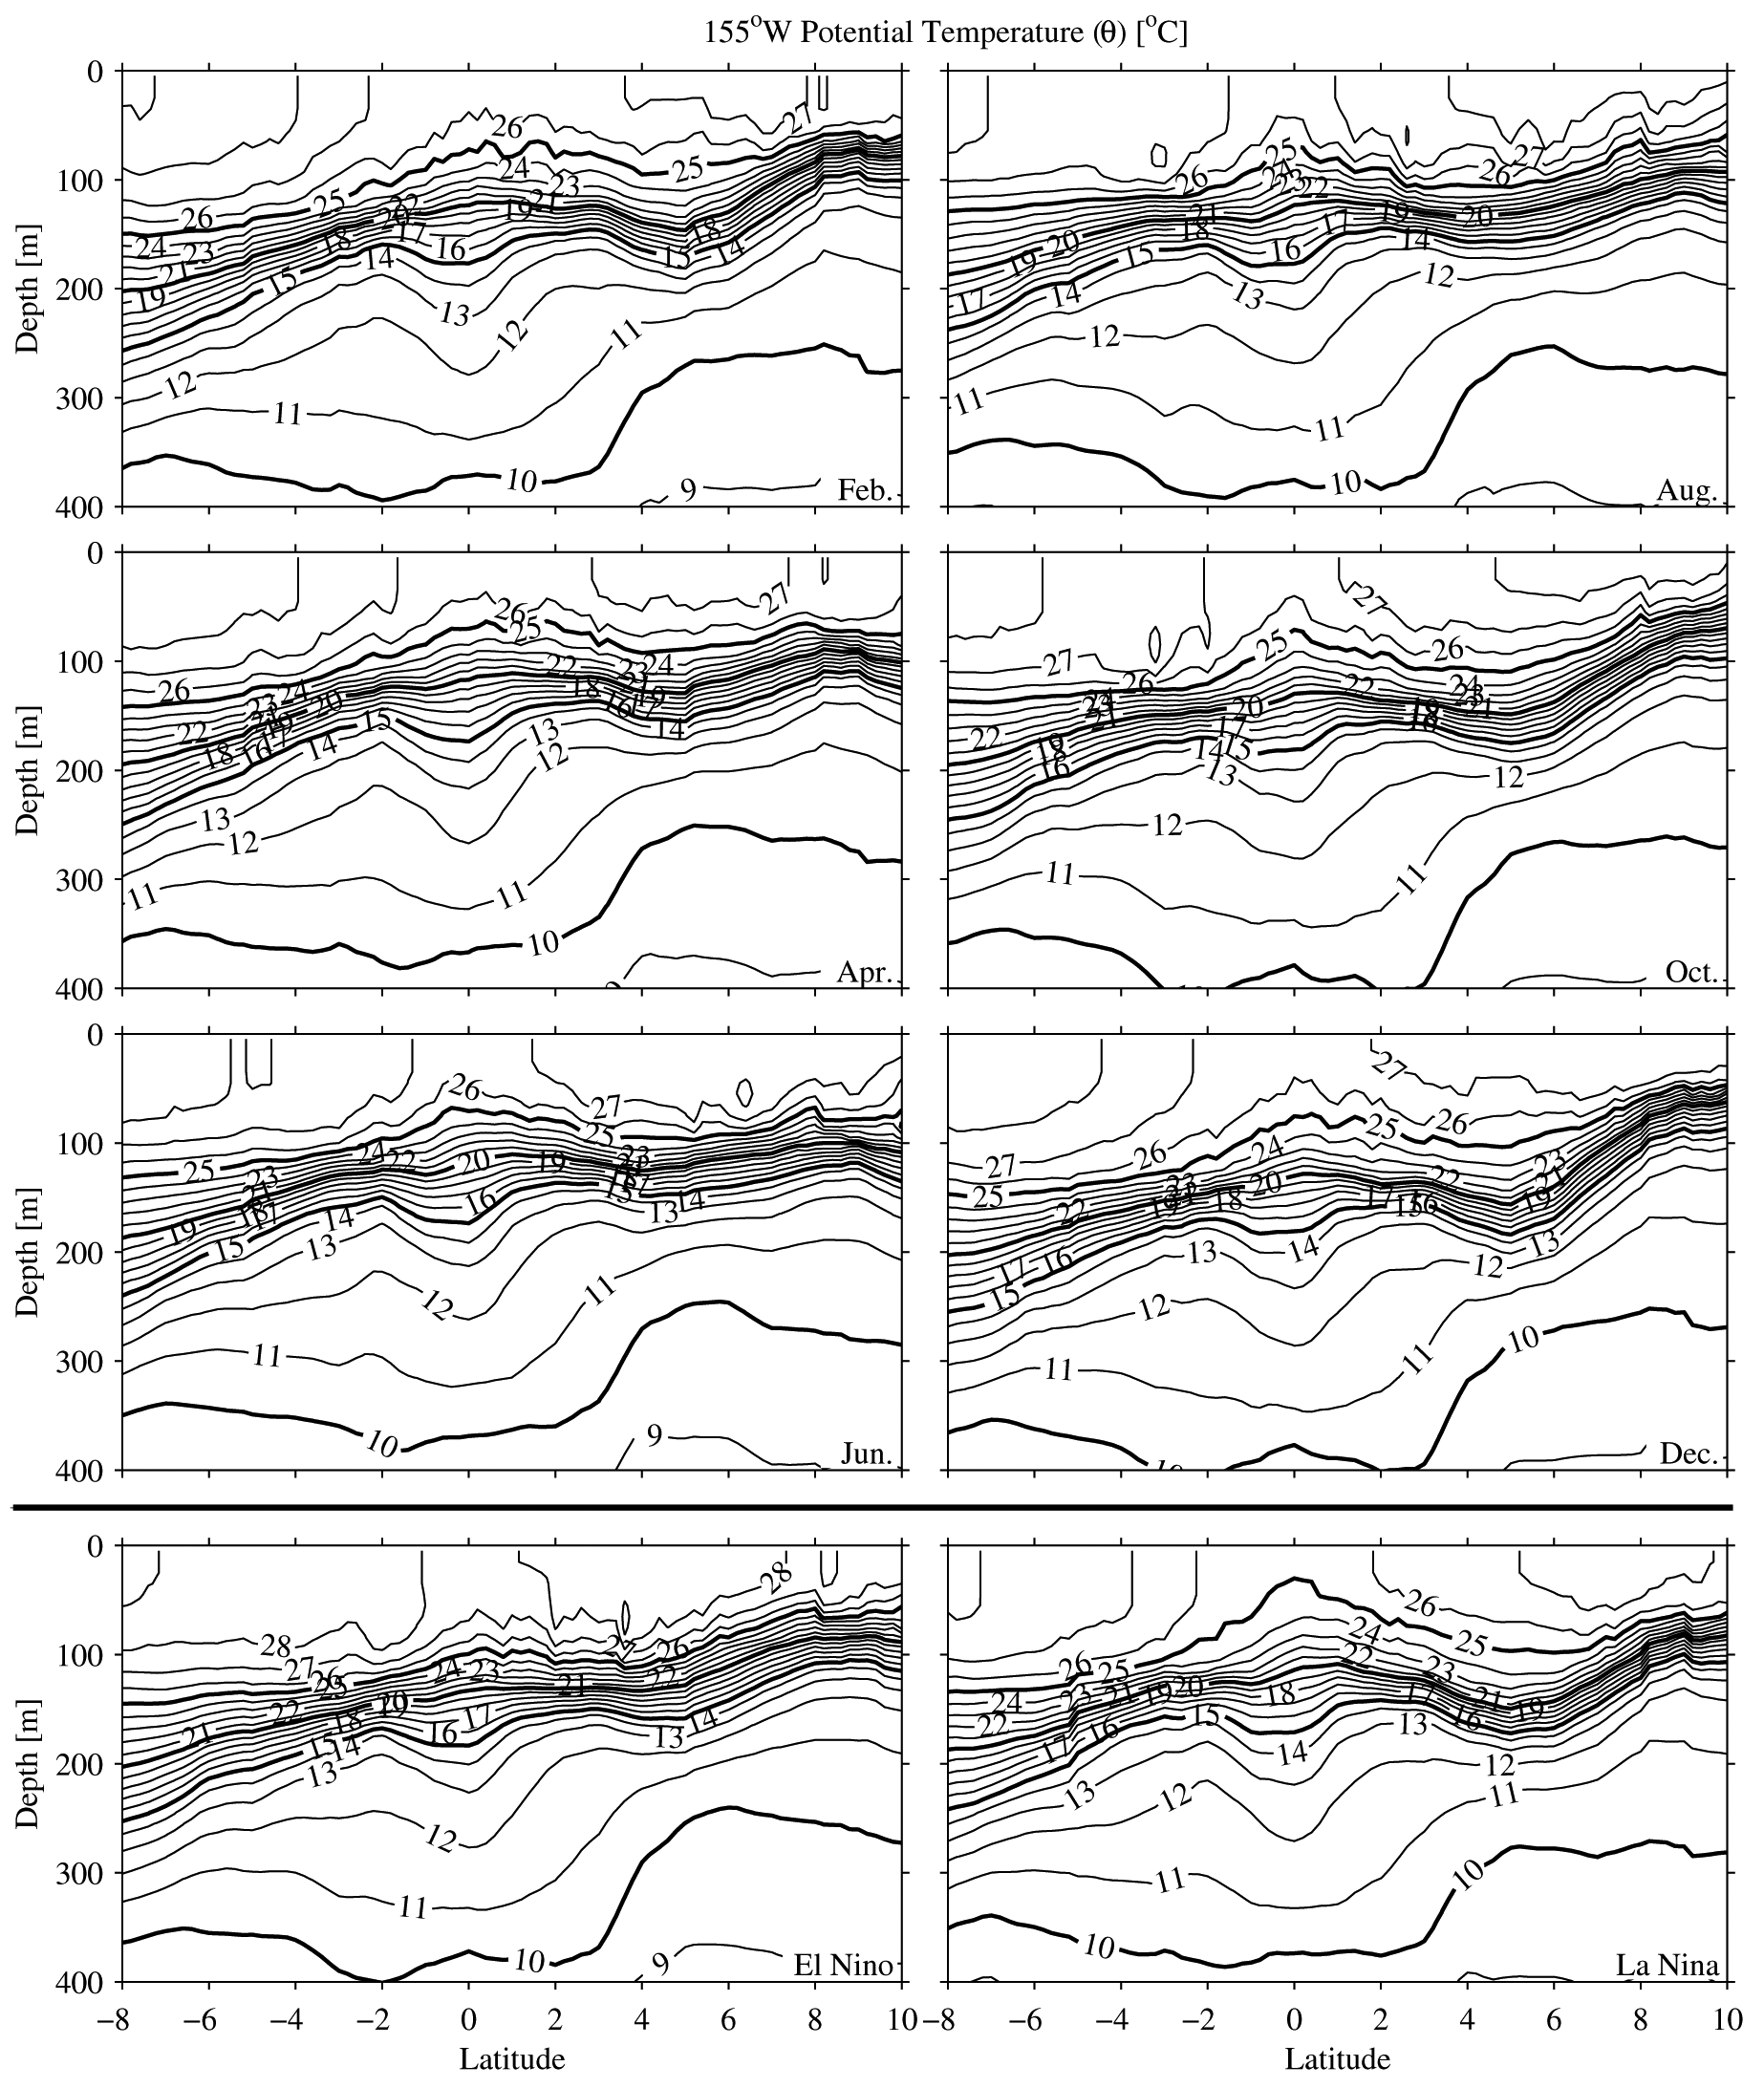
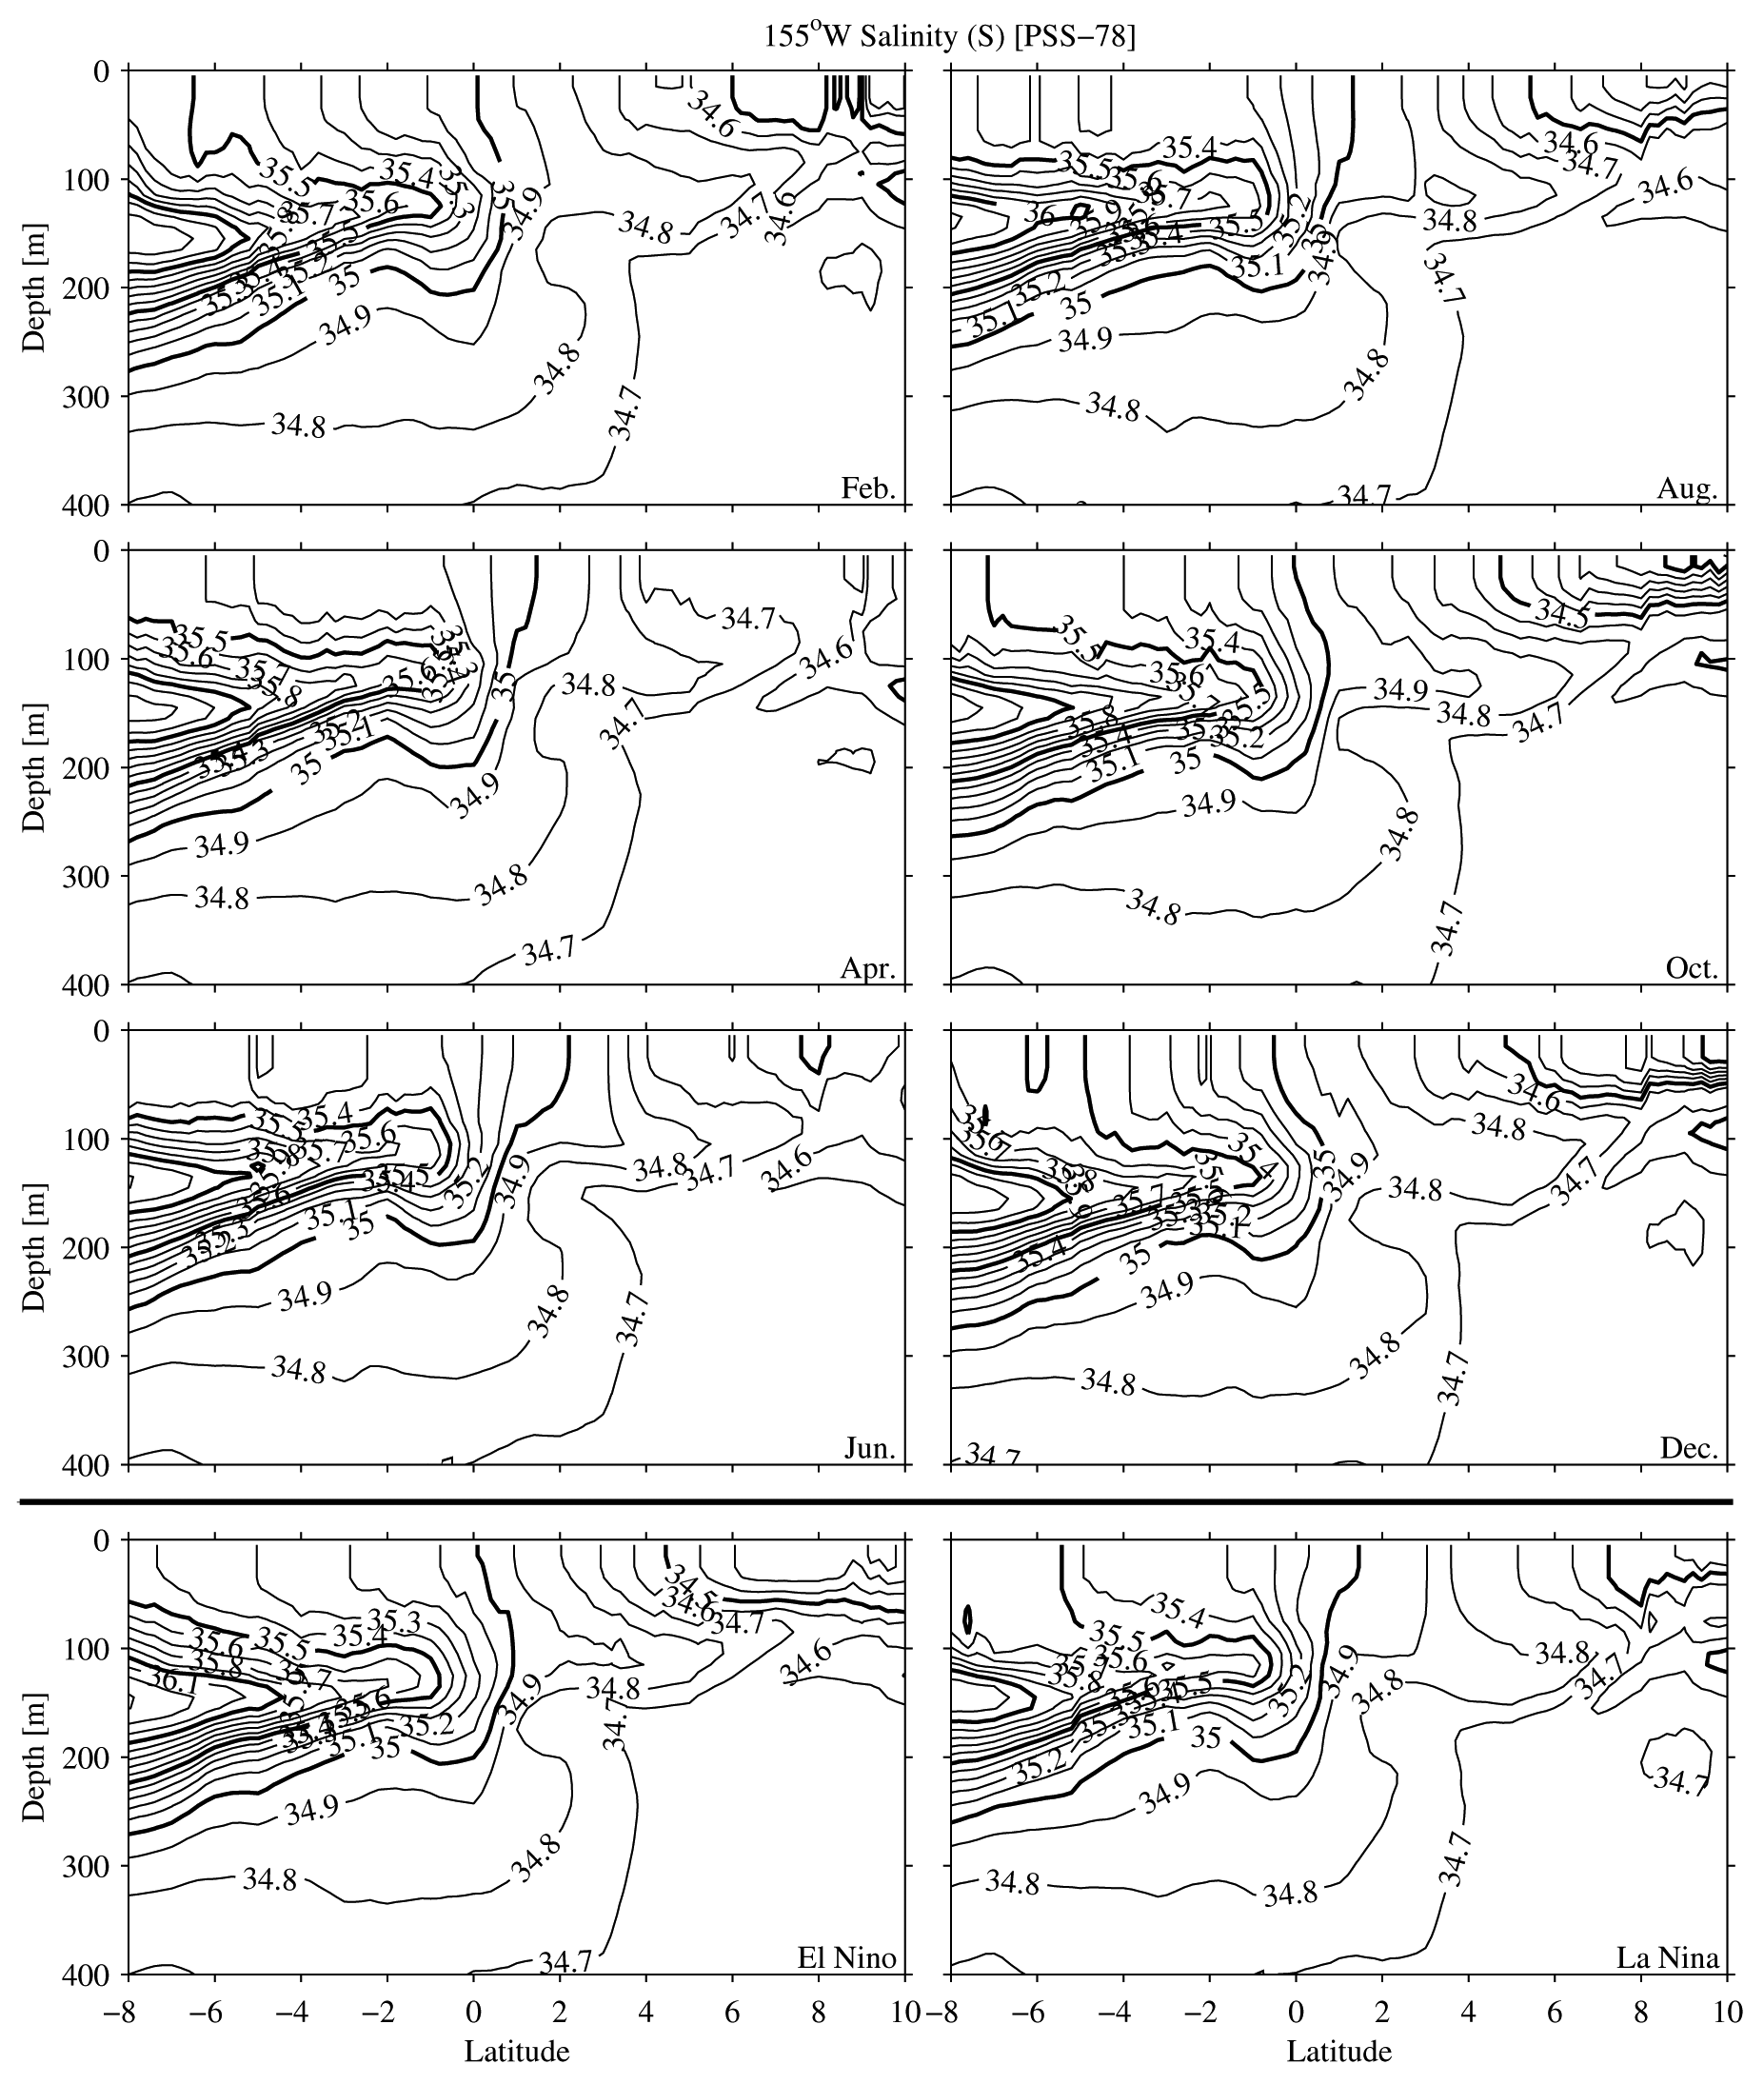
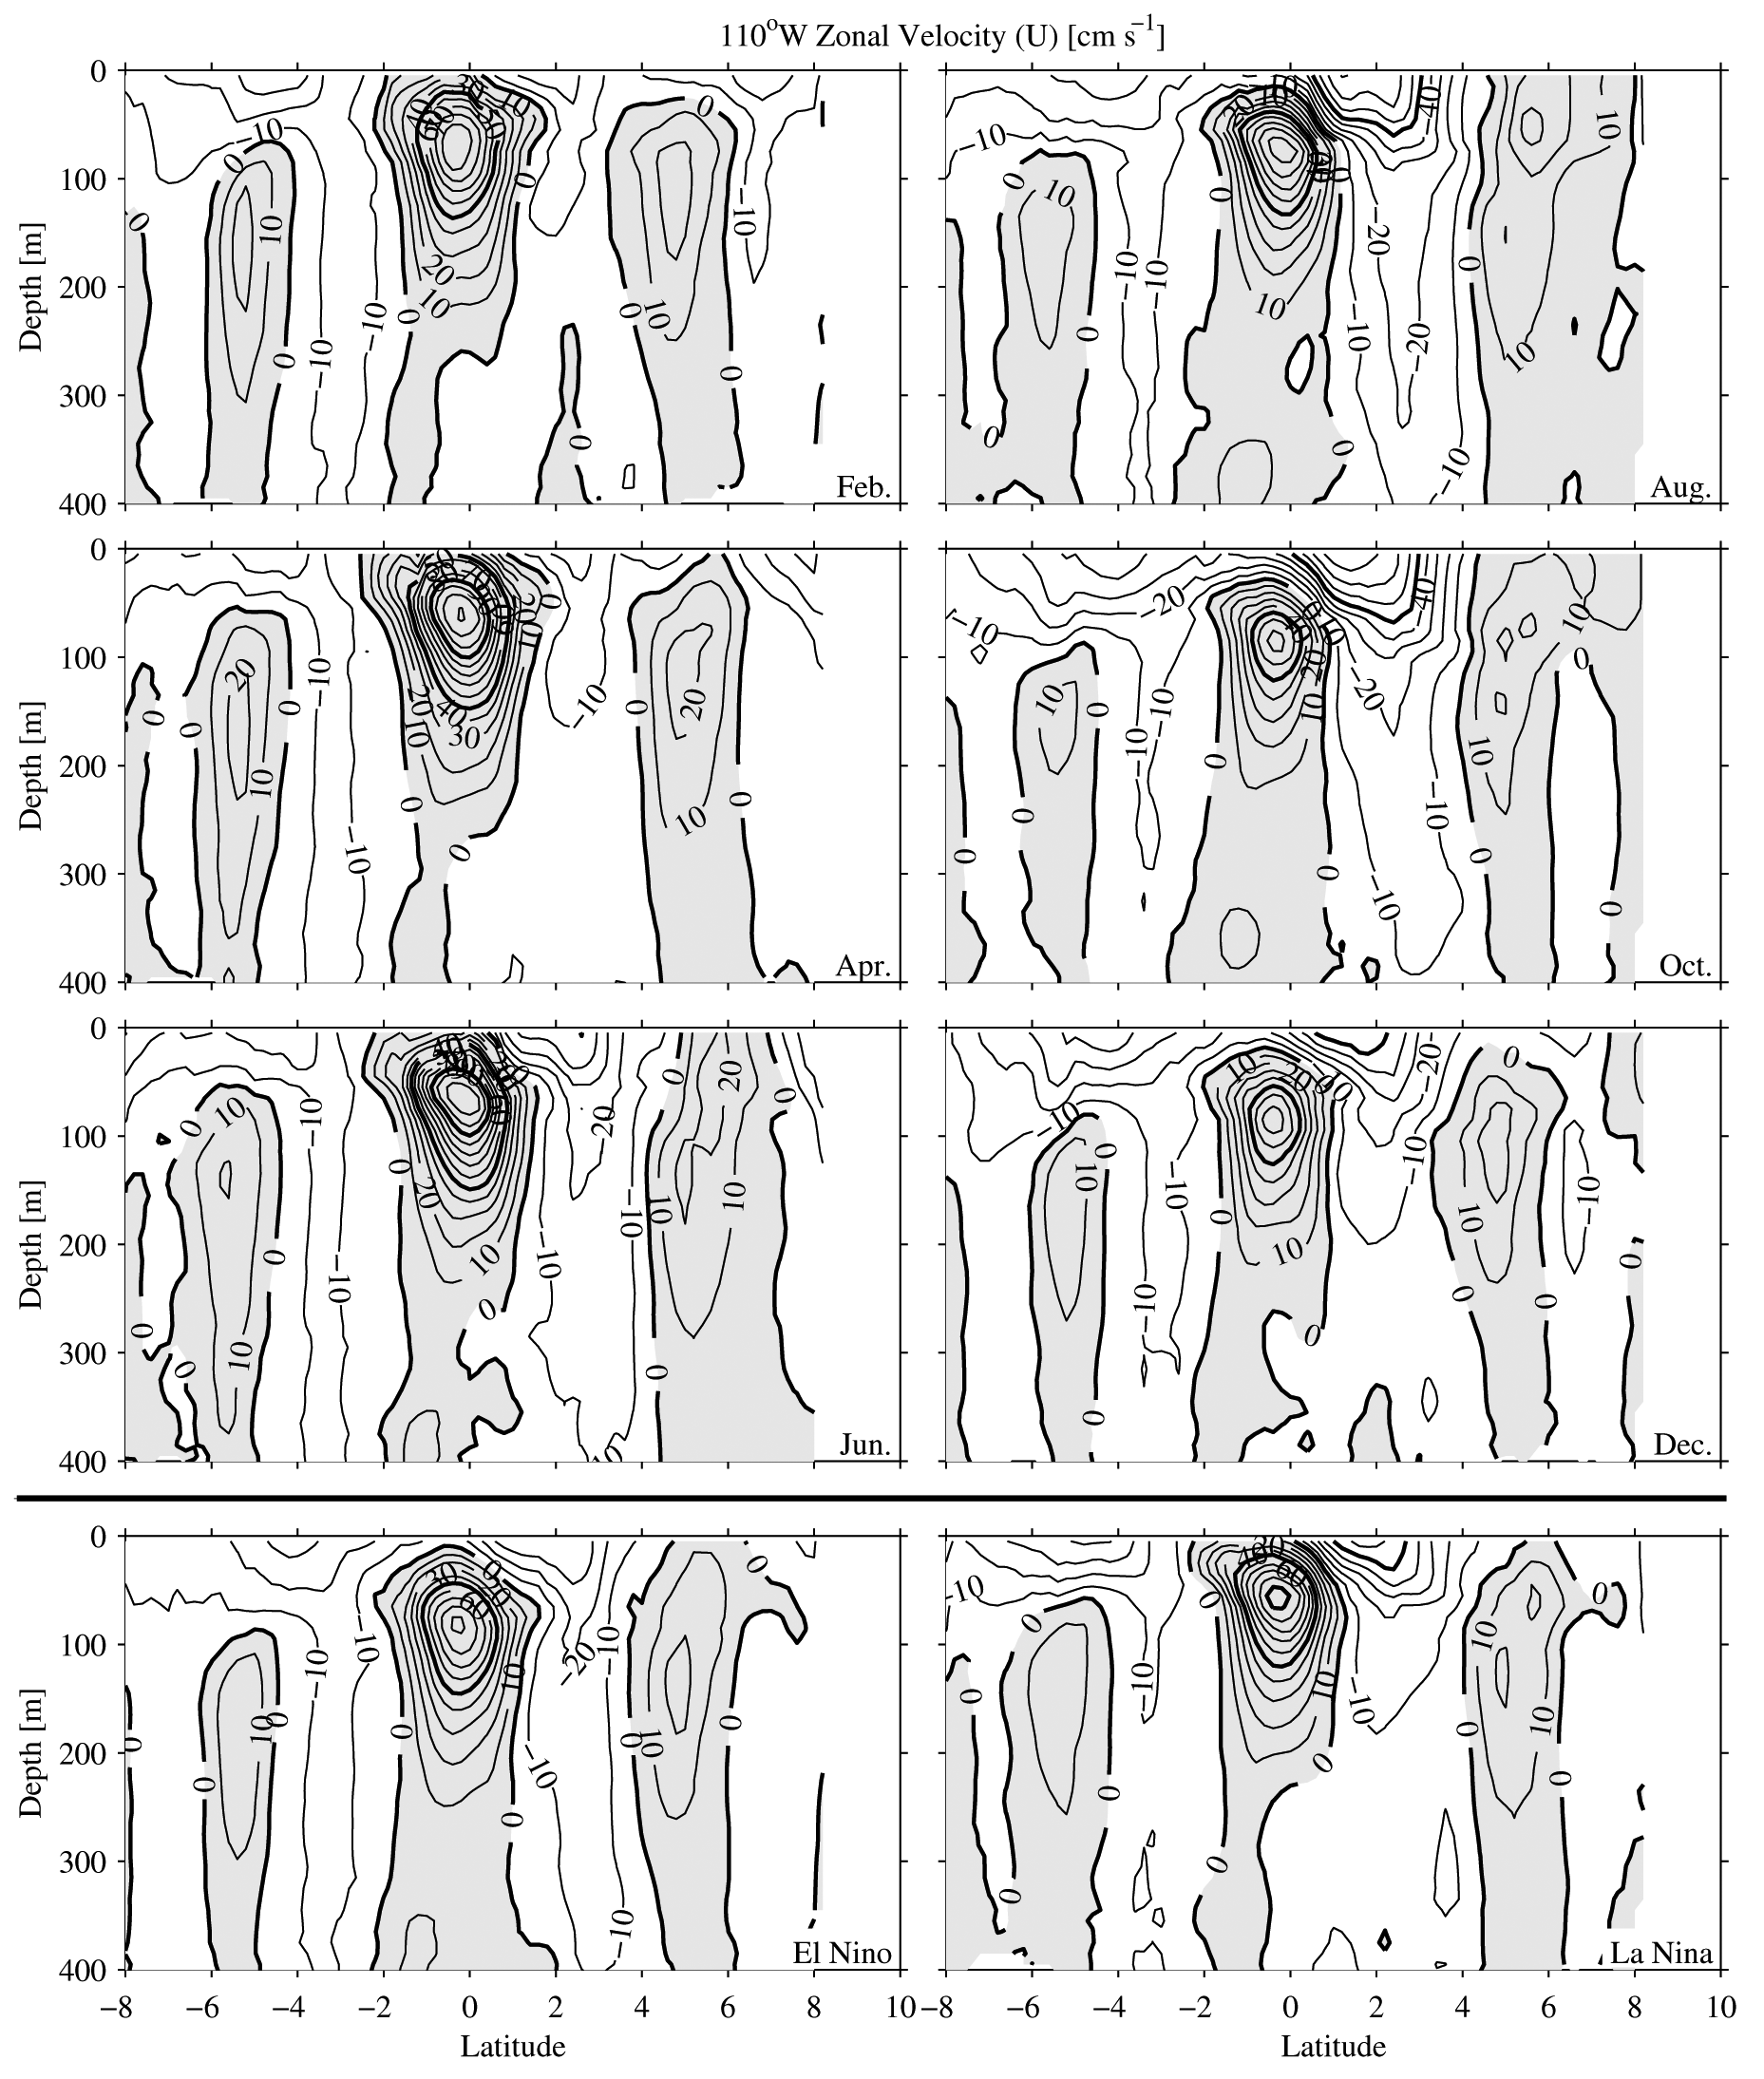
3.2. The seasonal and ENSO cycles
Seasonal and ENSO cycle variations of zonal velocity, temperature, and salinity
are described along the equator and at three representative longitudes: in
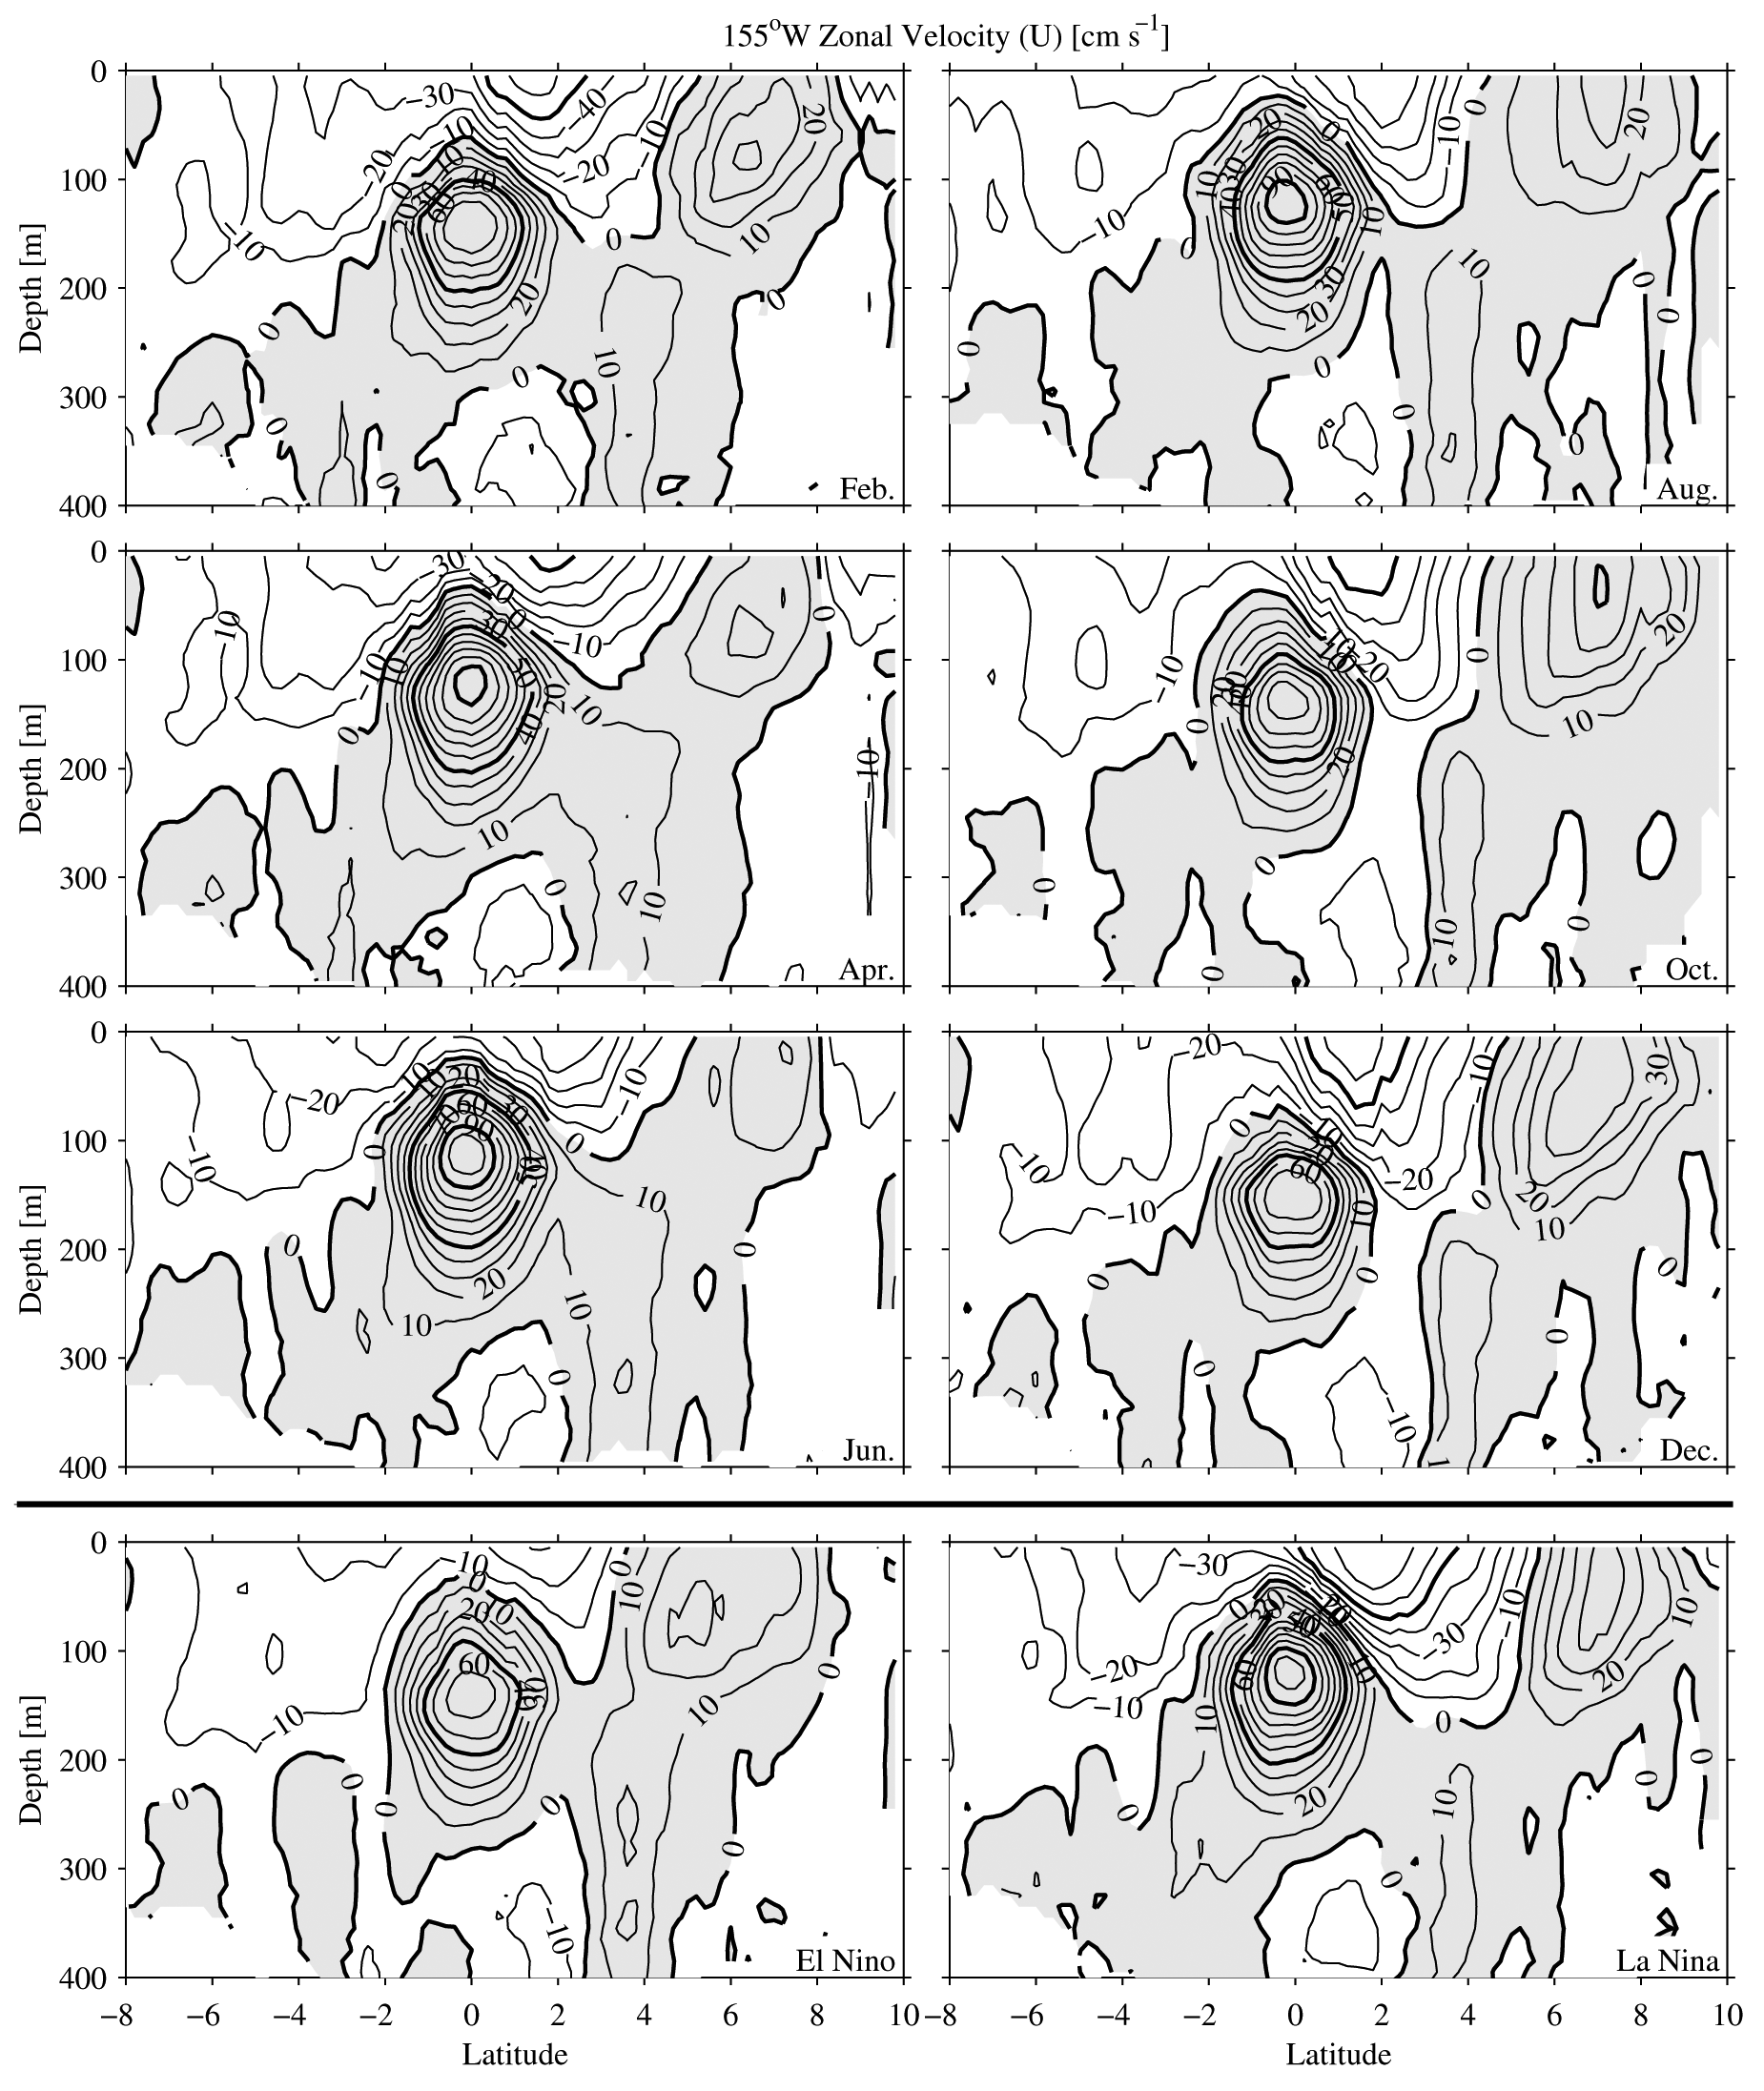
the western Pacific at 165°E, in the central Pacific at 155°W, and in the eastern Pacific
at 110°W. At each longitude, the zonal current variations are described,
and these variations are then related to the potential temperature and salinity
fields. A set of eight zonal sections at the equator is shown for each of these
properties (Figs. 57). The top six sections are bimonthly presentations of
the properties, evaluated in the middle of the month noted. These sections
start with mid-February in the upper left and proceed down to mid-June, then
go on to mid-August in the upper right proceeding down to mid-December. The
bottom two sections show the perturbations imposed on the mean during mild
El Niño conditions (SOI = 1.0) and mild La Niña conditions (SOI = +1.0). A
similar convention is followed for meridional sections at the western, central,
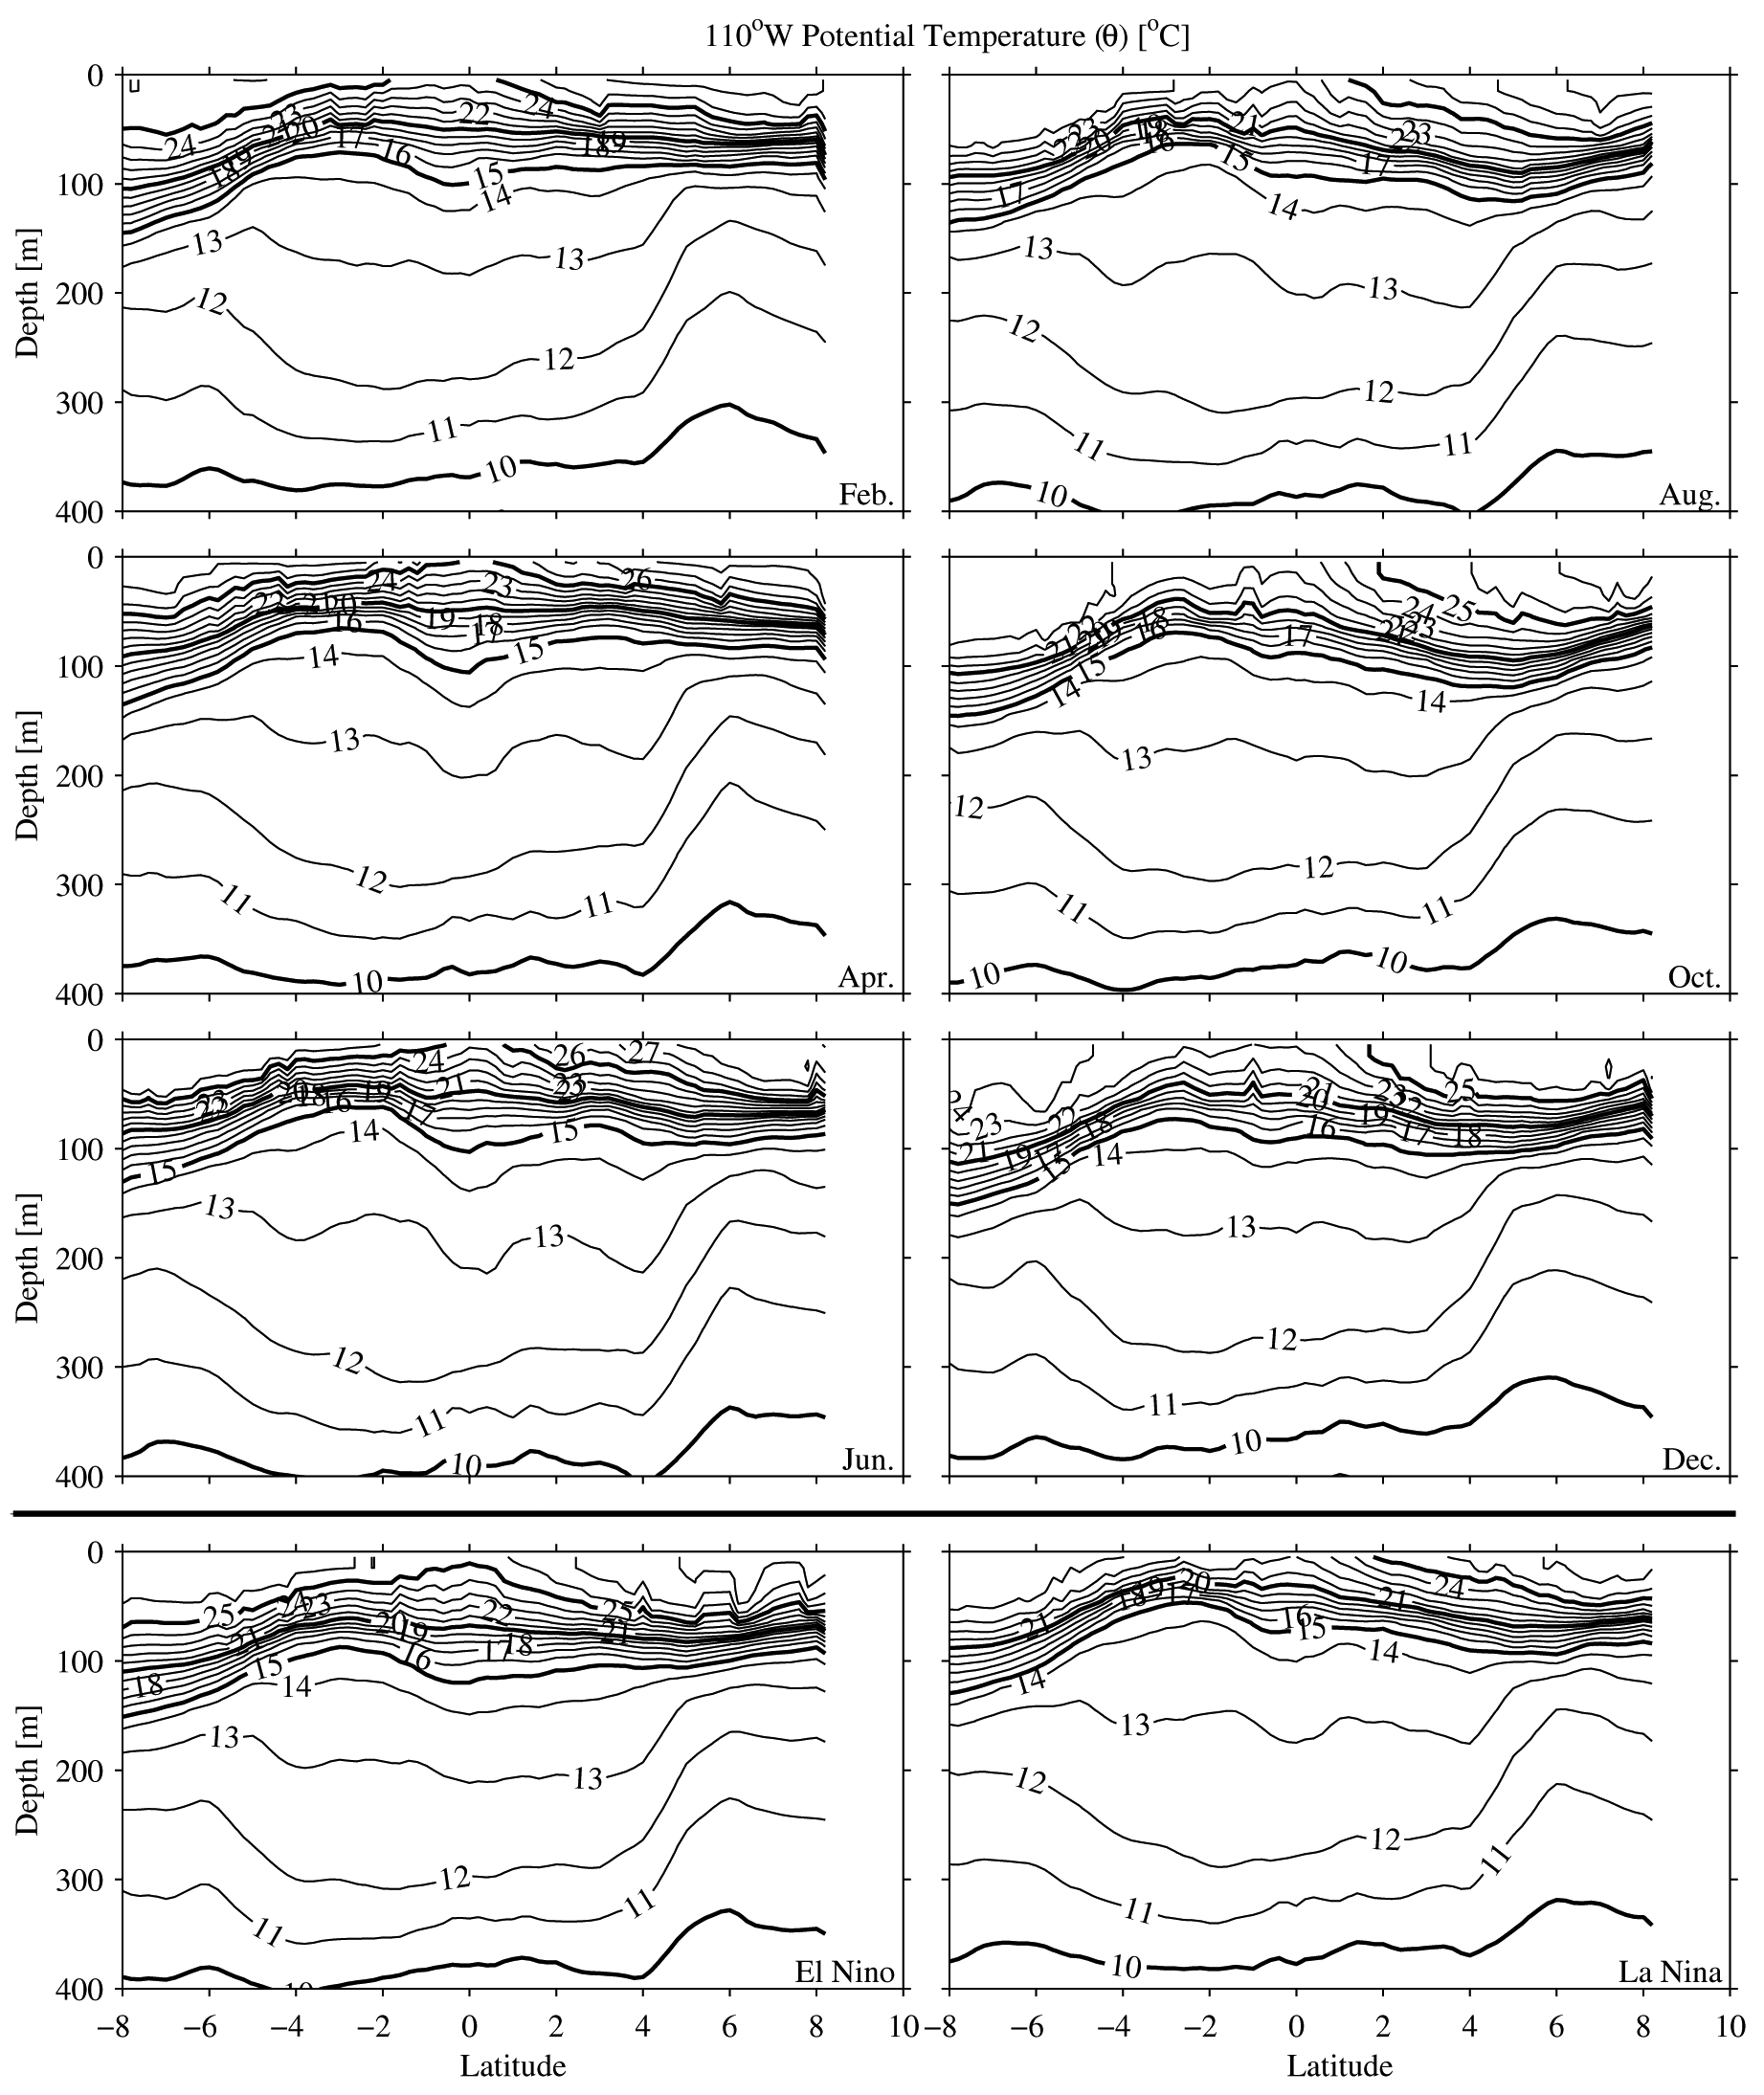
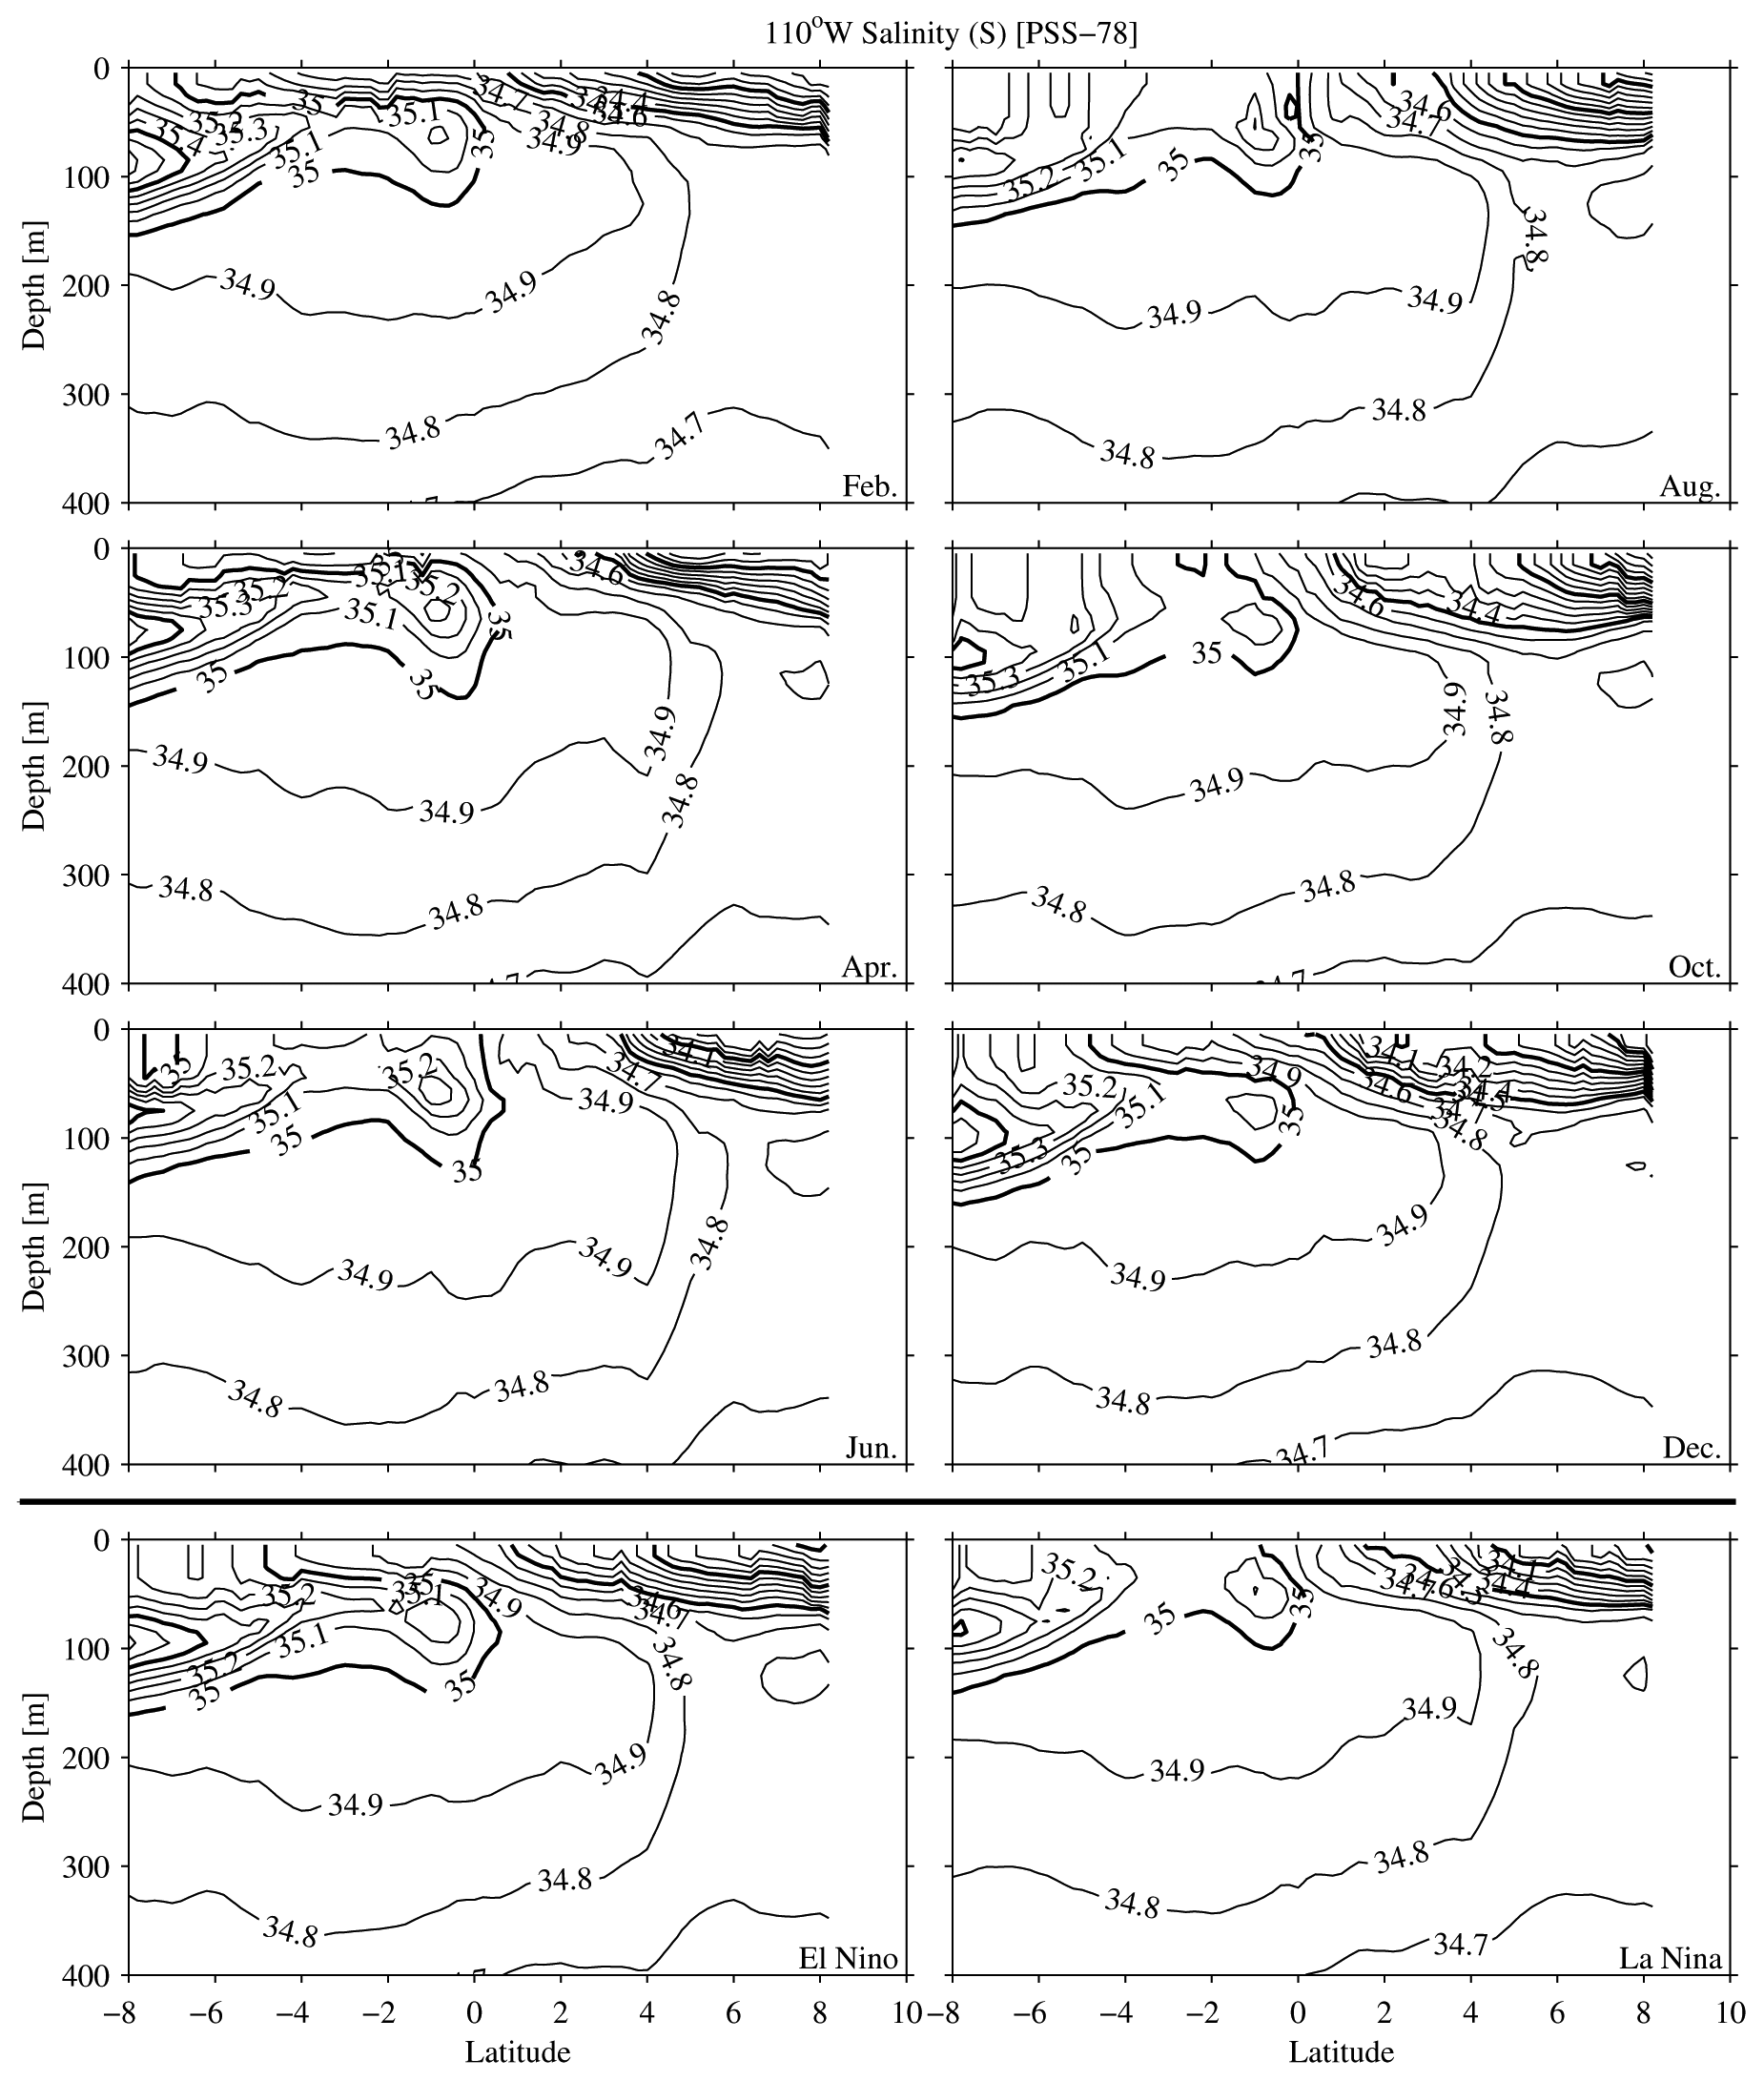
and eastern Pacific longitudes (e.g., Figs. 810).
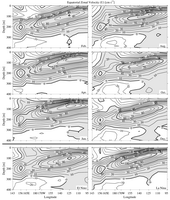
Fig. 5. Zonal sections of zonal velocity (U) along the equator estimated
for 6 months and both phases of the ENSO cycle. Six months of a SOI = 0
(normal) year are shown in the upper six panels as described in the text. SOI
= –1 (El Niño) is shown in the bottom left panel and SOI = +1
(La Niña) in the bottom right panel. Details follow Fig.
2.
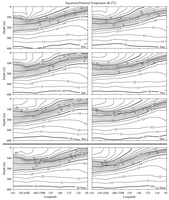
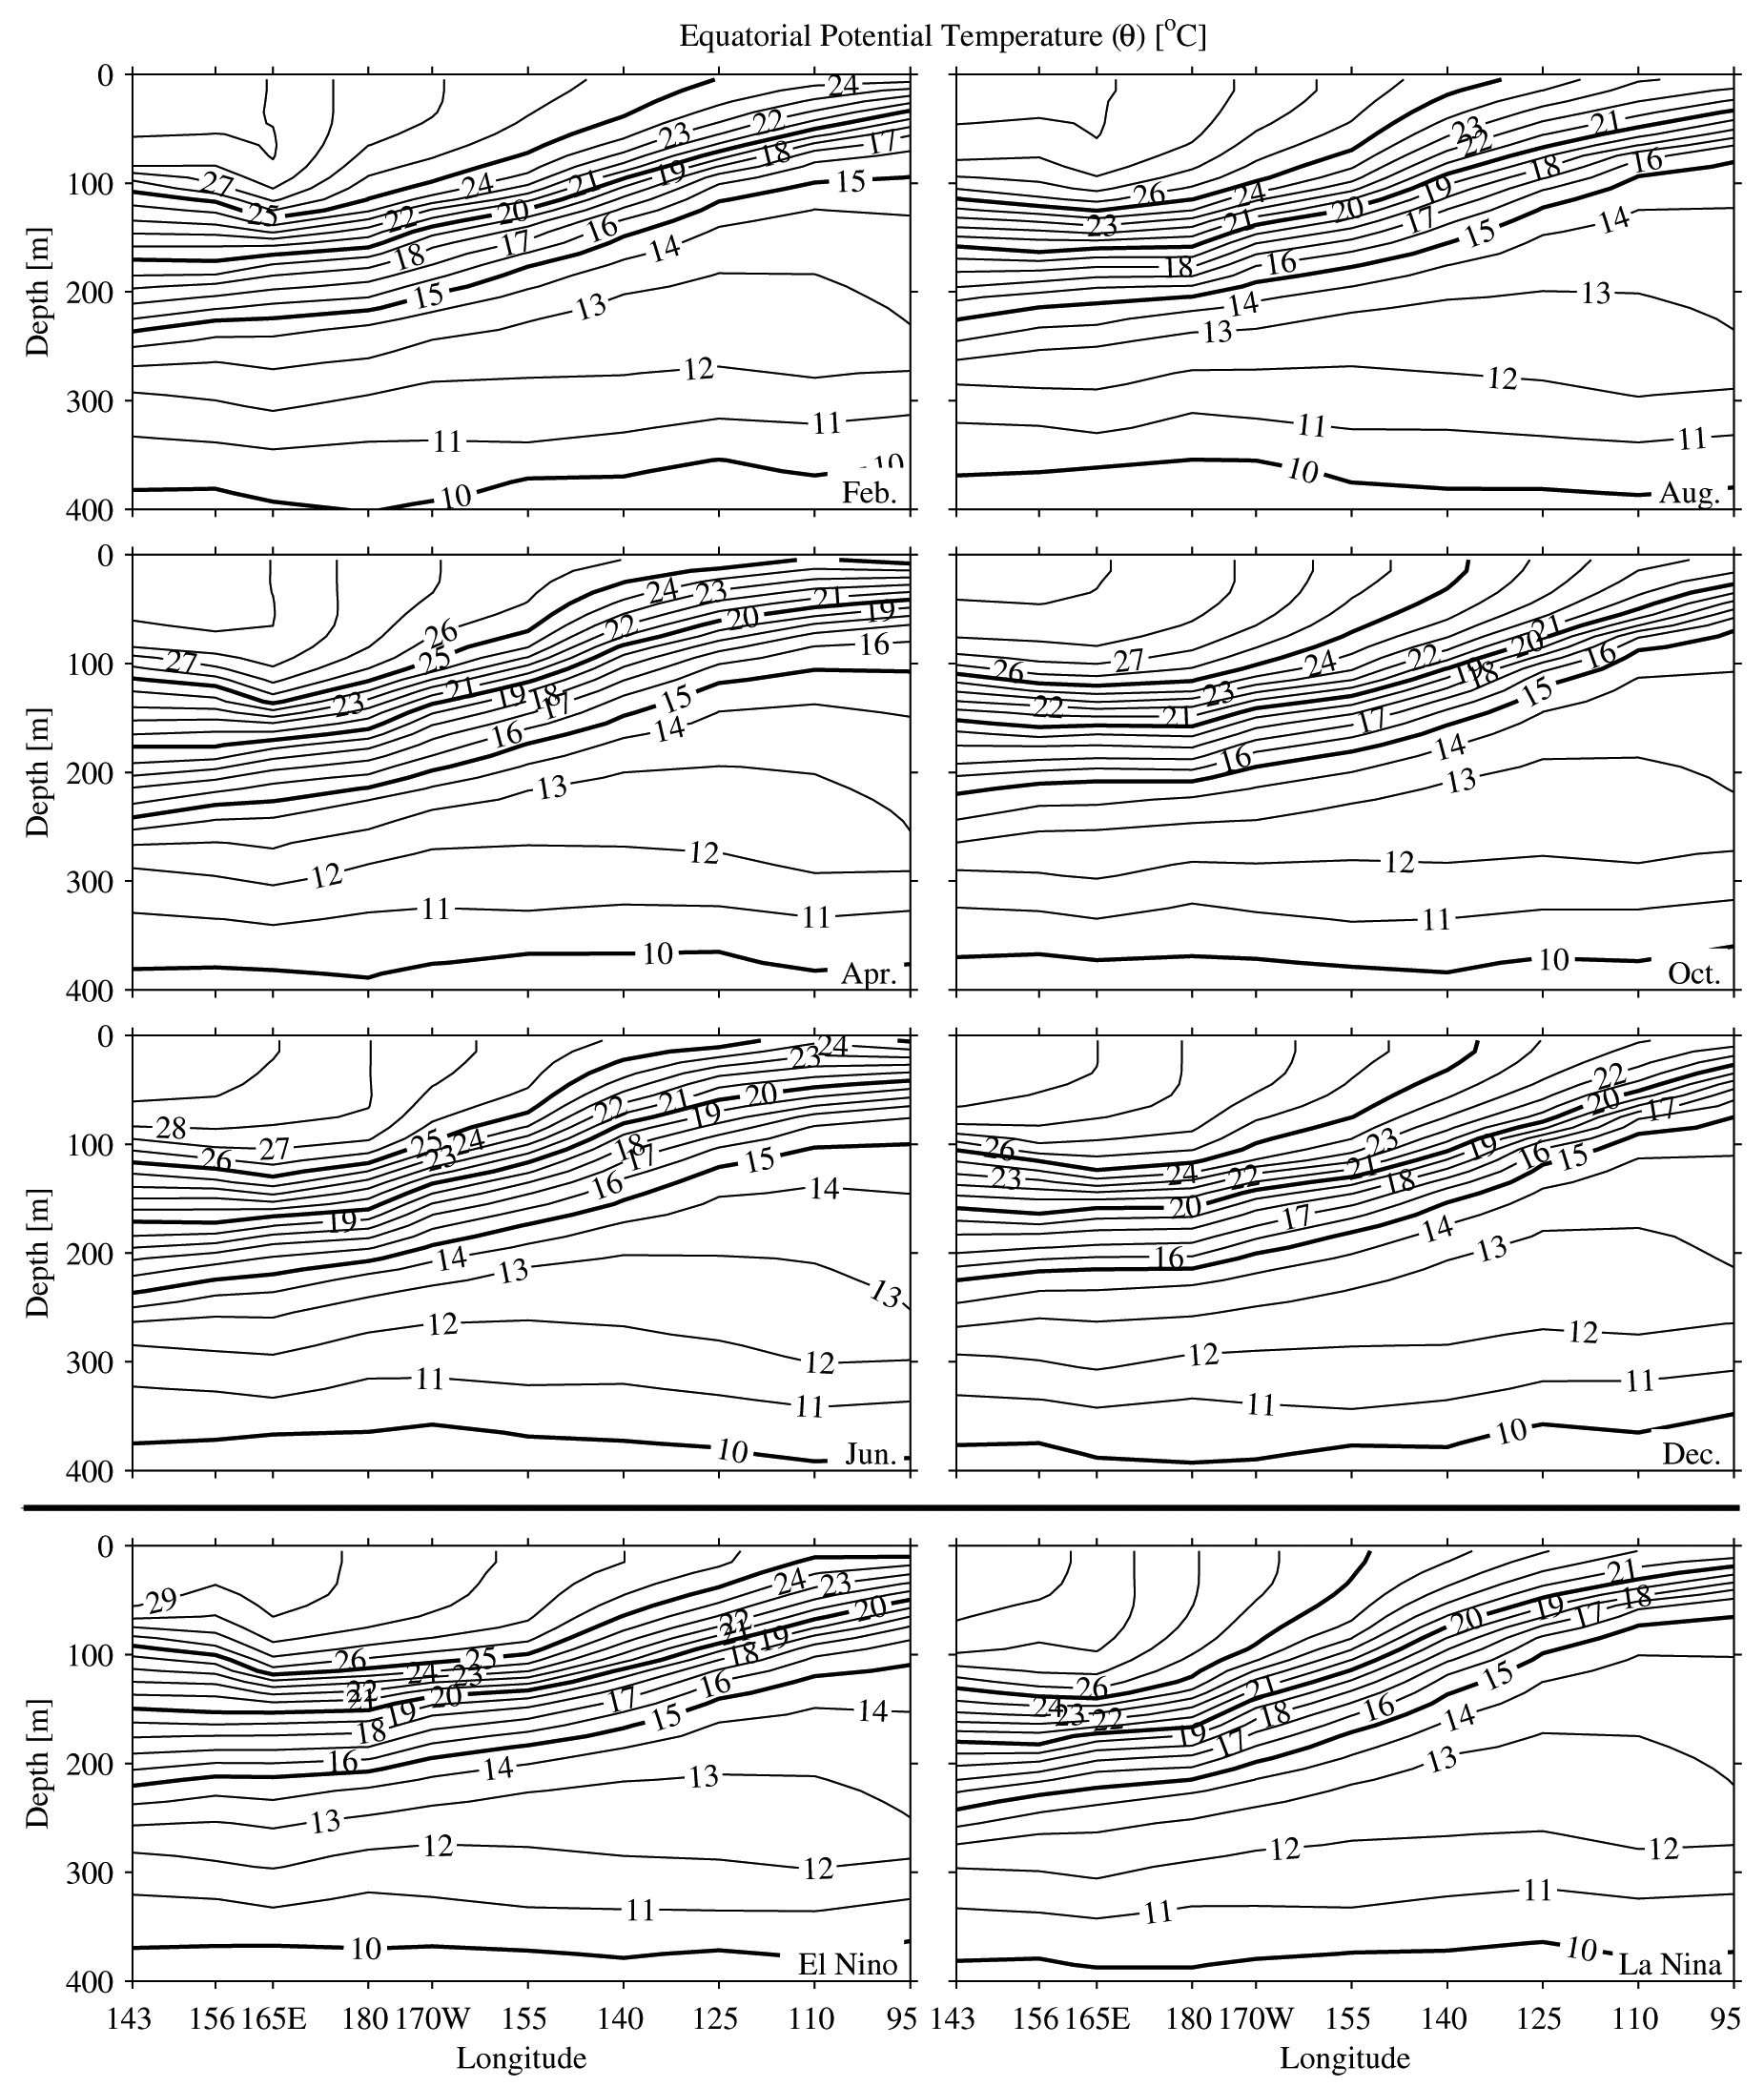
Fig. 6. Zonal sections of potential temperature ()
along the equator estimated for 6 months and both phases of the ENSO cycle.
Details follow Fig. 3.
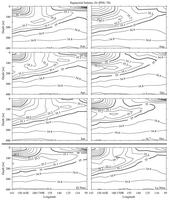
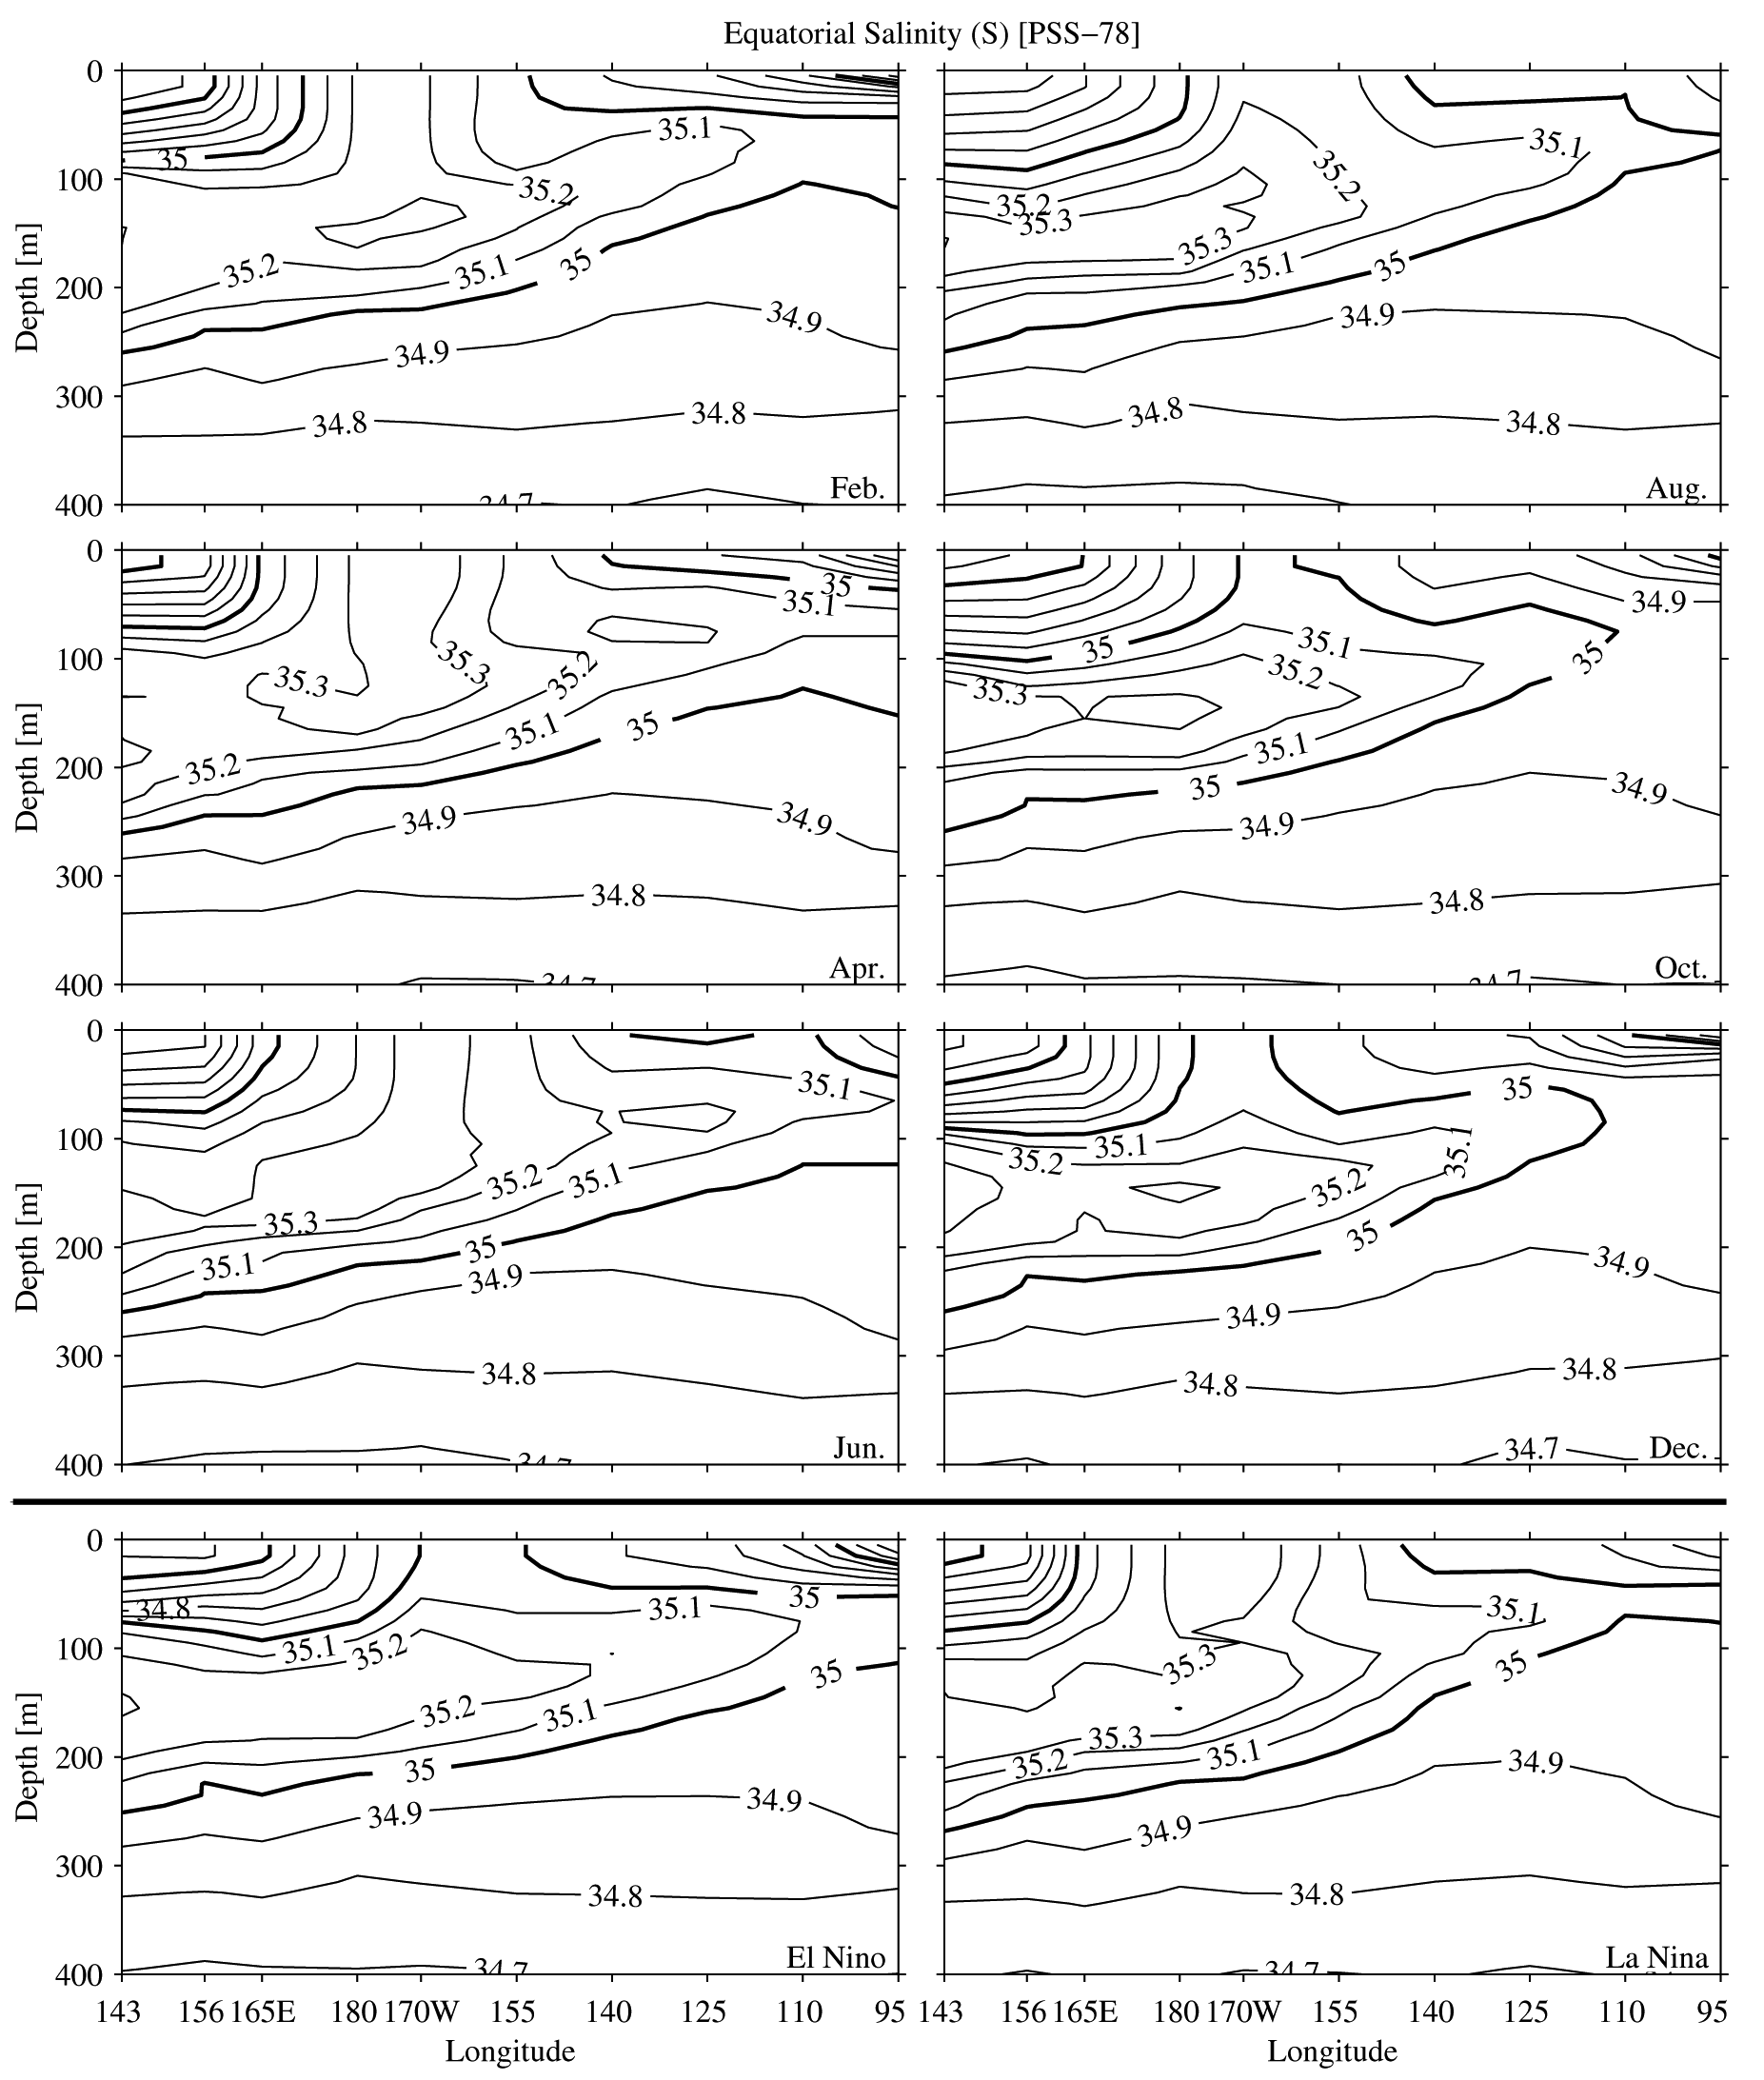
Fig. 7. Zonal sections of salinity (S) along the equator estimated
for 6 months and both phases of the ENSO cycle. Details follow Fig.
4.
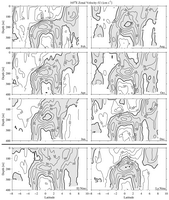
Fig. 8. Meridional sections of zonal velocity (U) at 165°E
estimated for 6 months and both phases of the ENSO cycle. Details follow
Fig. 2.
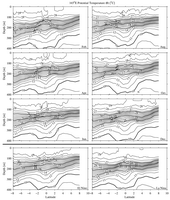
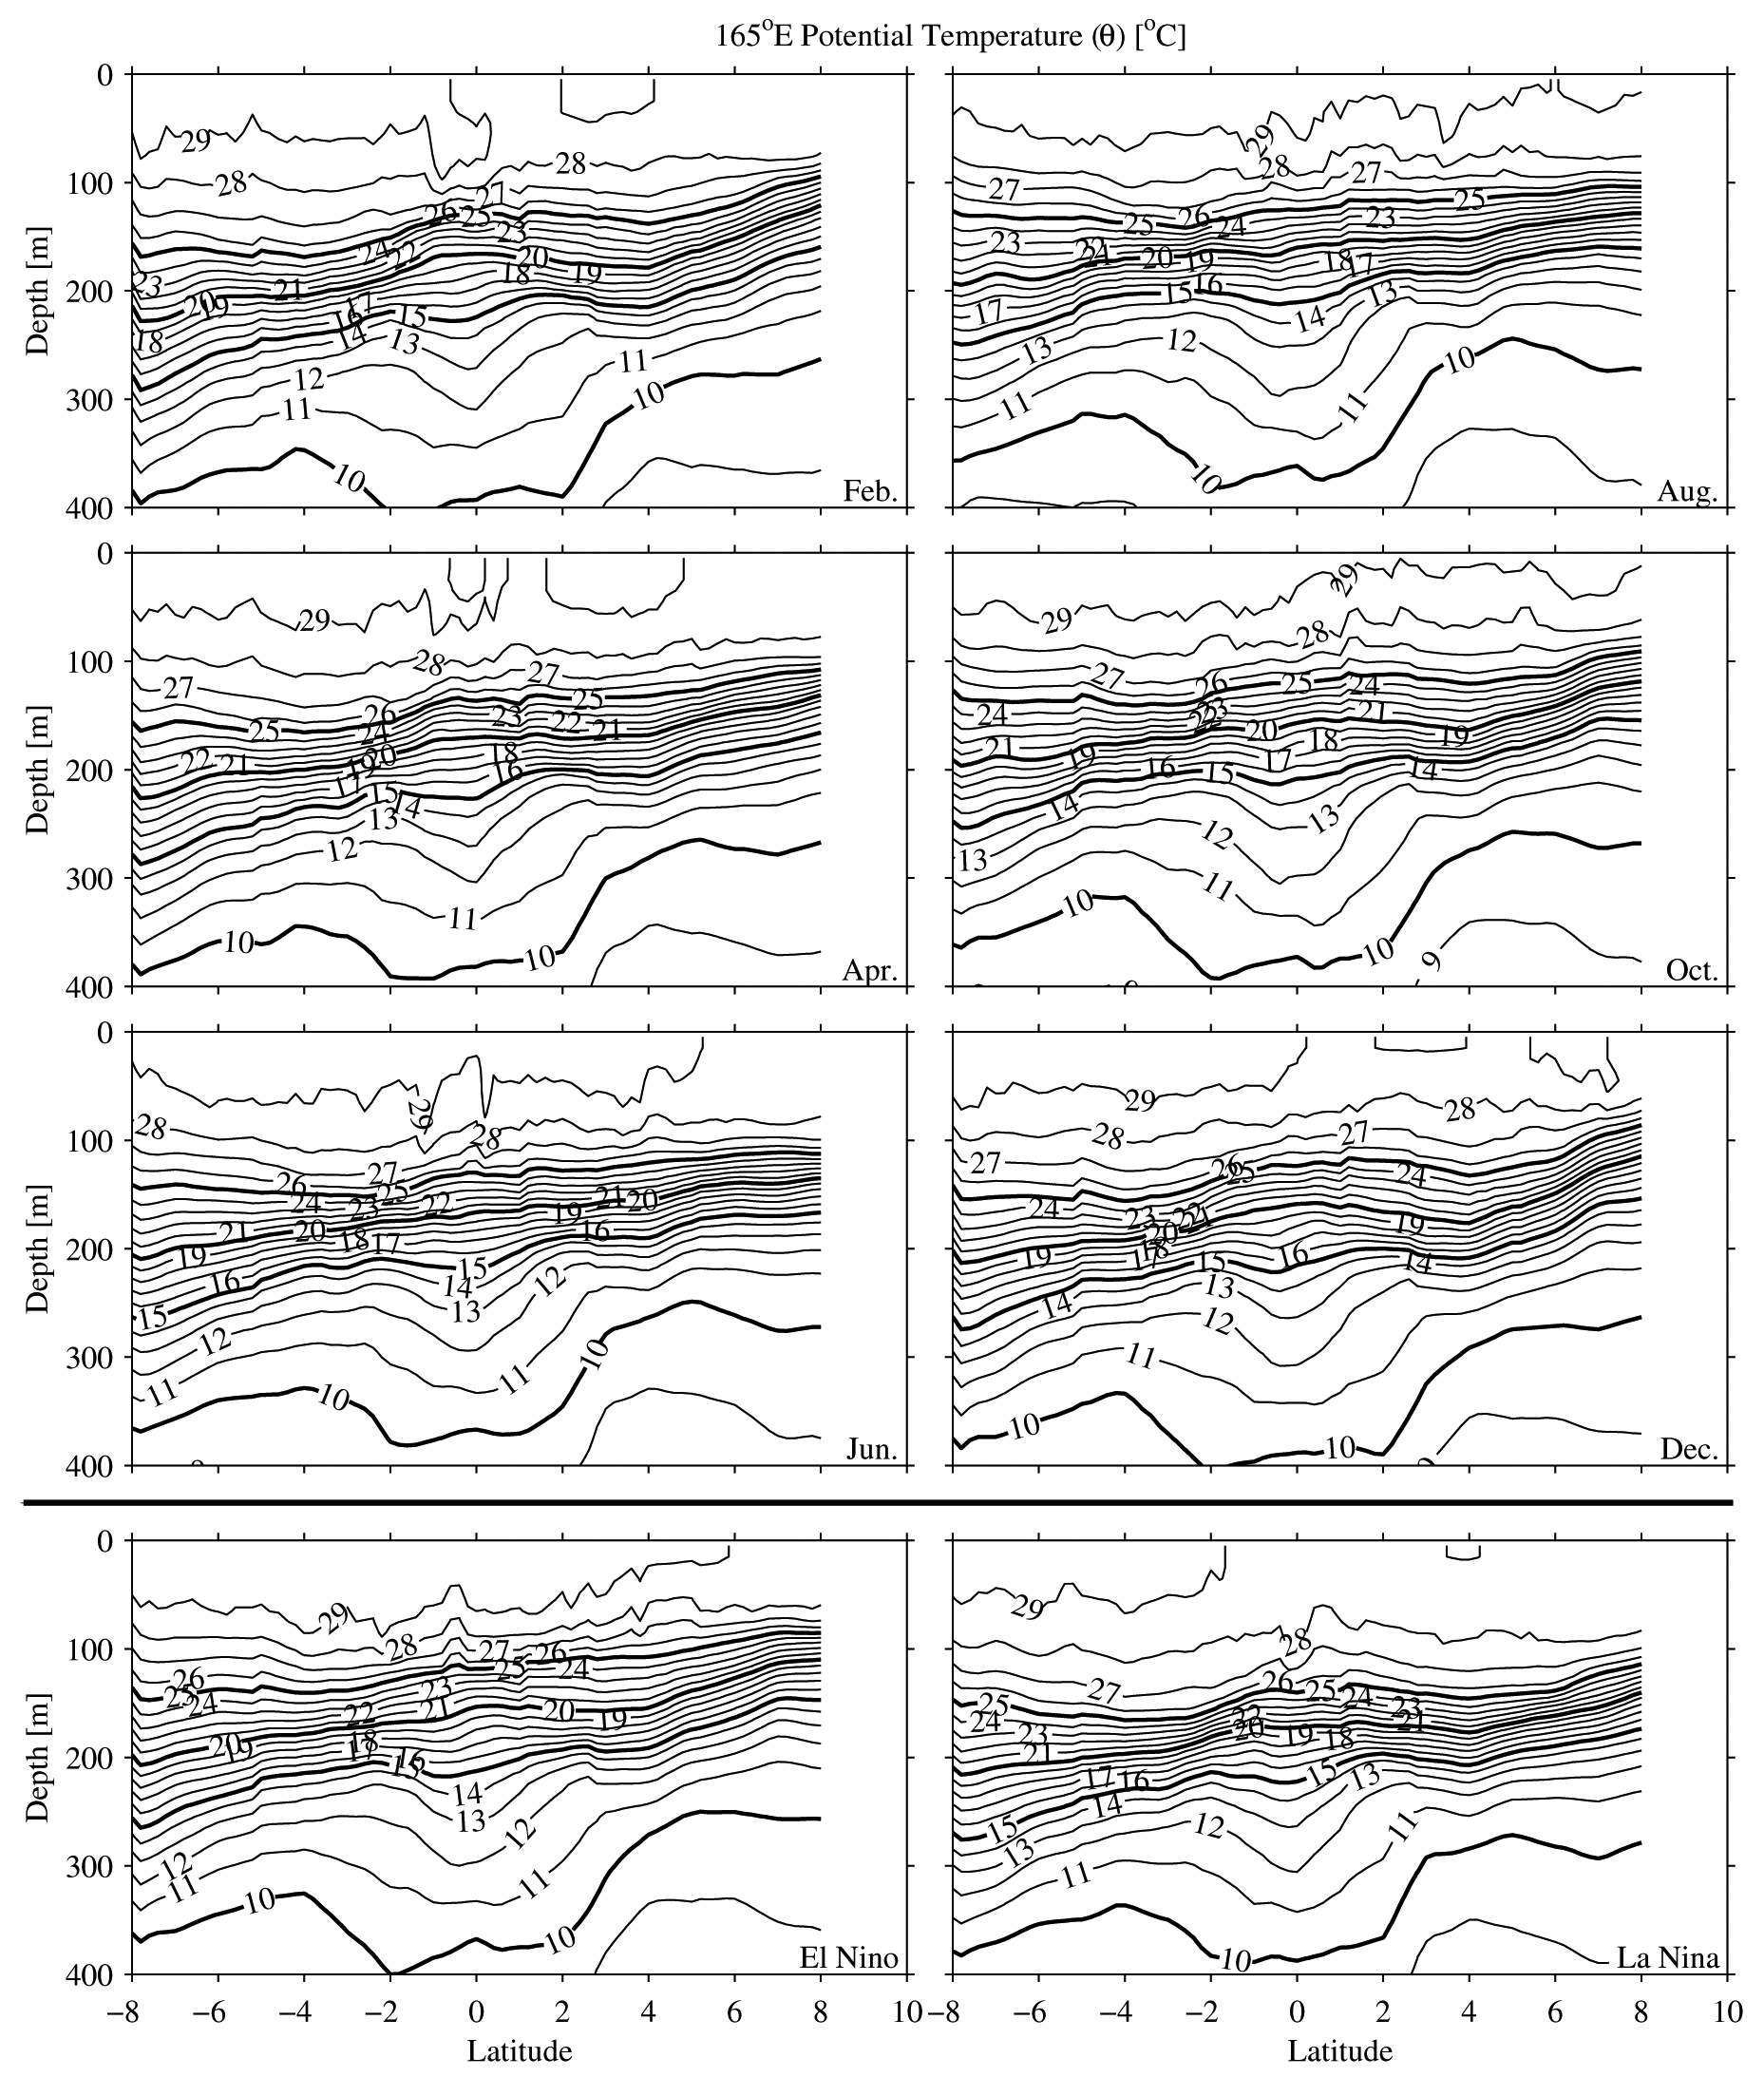
Fig. 9. Meridional sections of potential temperature ()
at 165°E estimated for 6 months and both phases of the ENSO cycle. Details
follow Fig. 3.
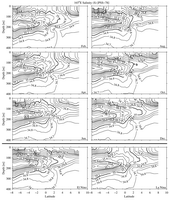
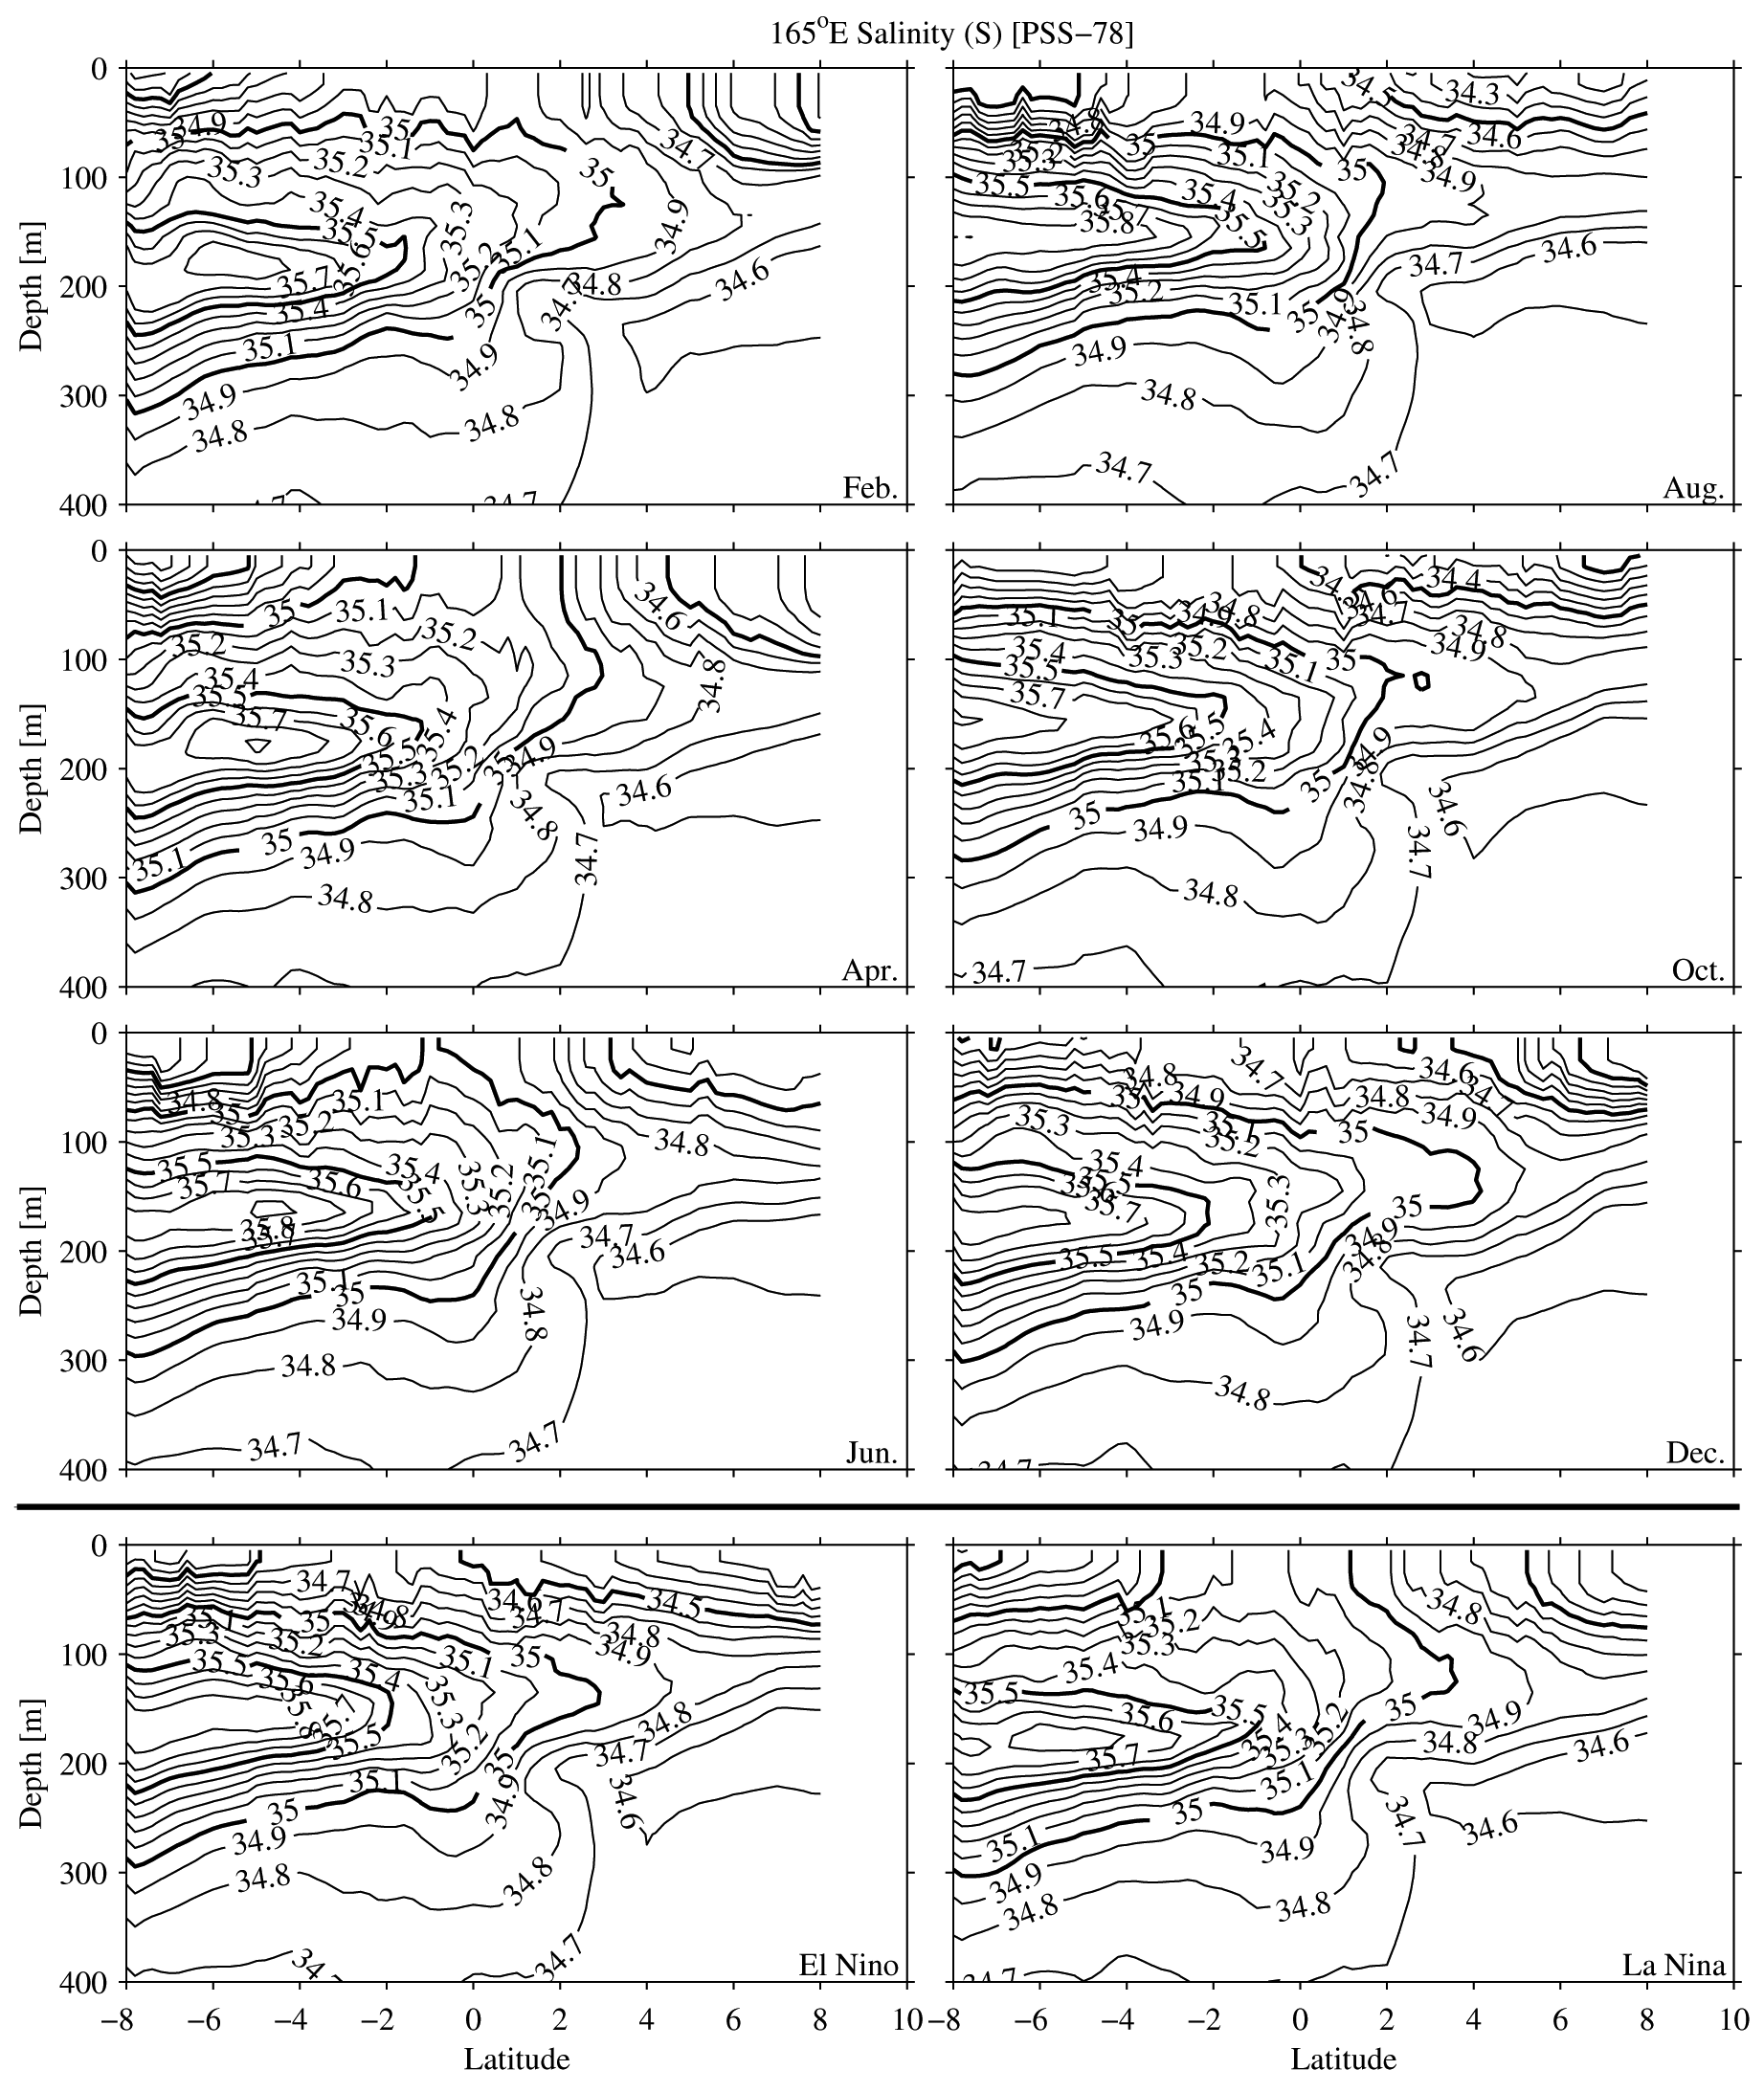
Fig. 10. Meridional sections of salinity (S) at 165°E estimated
for 6 months and both phases of the ENSO cycle. Details follow Fig.
4.
There were not sufficient degrees of freedom to include semi-annual harmonics
with any confidence in this analysis. TAO mooring data do suggest that near-surface
velocities in the western Pacific have a significant semi-annual signal (Yu & McPhaden,
1999), which has been missed here. Fortunately, these data also suggest that
the semi-annual signal on the equator is small at depth in the west and throughout
the water column in the east. A surface drifter velocity climatology is in
agreement with the TAO mooring data on the importance of the semi-annual harmonic
on the equator in the western Pacific (Reverdin et al., 1994). In addition,
this climatology suggests significant semi-annual energy in both branches of
the SEC in the central Pacific. The lack of a semi-annual harmonic in the present
work should be borne in mind, especially in these regions.
The isopycnal averaging framework allows more structure than one might expect
(below the mixed layer) given the annual harmonics and the linear regression
against the SOI. Since fits are made for both the potential isopycnal depths
and for the properties (zonal velocity, potential temperature, and salinity)
on isopycnals, there are twice as many degrees of freedom as for a similar
fit on isobaths. The depth of an isopycnal and the values of properties on
that isopycnal can vary in- or out-of-phase. This potential independence in
the phase and amplitude of isopycnal depth and isopycnal properties is why
the data have been presented using bimonthly sections, rather than by discussing
the harmonic amplitudes and phases.
3.2.1. Western Pacific
At 165°E the eastward-flowing EUC peaks in June (Figs.
8 and 5), but
variations in isothermal spreading about the equator associated with the seasonal
cycle are not obvious (Fig. 9). Fresher surface salinities may lag the eastward
surface velocities by a month (Figs. 7 and 5), perhaps a signature of eastward
advection of the fresh pool from the west during this season. In contrast,
the westward-flowing EIC and SEC(N) both peak in December. The eastward-flowing
NECC also peaks in December, consistent with the thermocline trough between
the SEC(N) and NECC being strongest during this time (Fig.
9). The SEC(S) is
maximum in FebruaryApril at 165°E (Fig. 8). The current also shows a
relatively weak seasonal cycle in the central Pacific (Fig.
11), and is maximum
in OctoberDecember at 110°W (Fig. 14).
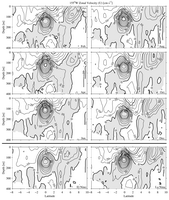
Fig. 11. Meridional sections of zonal velocity (U) at 155°W
estimated for 6 months and both phases of the ENSO cycle. Details follow
Fig. 2.
In FebruaryApril a chimney of salty water appears to extend upward from the
subsurface salinity maximum near the equator in the western Pacific (Figs.
10 and 7). This chimney results from some combination of equatorial upwelling,
westward advection of saltier water from the east (Figs.
5 and 7), seasonal
changes in local precipitation, and deep mixing from strong wind events in
NovemberMarch (Cronin & McPhaden, 1998).
At 165°E El Niño weakens the EUC at its core (Figs.
8 and 5), but a
strong eastward surface flow develops on the equator (Cronin, McPhaden, & Weisberg,
2000). The thermocline becomes shallower and relatively diffuse in the west
(Figs. 6 and 9) as the warm pool is drained by eastward advection (Picaut & Delcroix,
1995). Surface salinities are fresh during El Niño as precipitation migrates
east with the warm pool (Figs. 7 and 10; Delcroix & Picaut, 1998). In addition
a strong NECC is present around 5°N (Fig.
8; Kessler & Taft, 1987).
The EIC also appears to be stronger than normal. In contrast, La Niña conditions
see both a strong EUC and a strong SEC, while the NECC is pushed northward
to about 7°N. In other words, during La Niña the equatorial current system
is strengthened and looks more like the central Pacific than the western Pacific
as the easterly trade winds migrate westward. The trades drive both the equatorial
SEC (frictionally) and the EUC through the zonal pressure gradient. In addition,
during La Niña there is a relatively sharp and deep thermocline as the warm
pool builds in the west, in addition to salty surface conditions as the convection
shifts west and advection in the SEC carries saltier central Pacific waters
westward.
3.2.2. Central Pacific
At 155°W the EUC peaks in June (Figs. 11 and 5), and a contrast in the
spreading of the thermocline about the equator between June and December is
seen (Figs. 12 and 6). Highest EUC speeds occur when the current is at its
shallowest (Fig. 5), which occurs when equatorial easterly trade winds are
weakest. The very strong shears above the EUC and the interaction between the
eastward zonal pressure gradient and the westward surface stress indicate the
complexity of the mix of influences on the EUC (Philander & Pacanowski,
1980; McPhaden & Taft, 1988; Wacogne, 1990). At 155°W there is no surface expression of eastward equatorial flow in any
season (assuming that extrapolating the ADCP shear from below 20 m up to the
surface adequately describes the surface velocity). Perhaps as a result, there
is little change in the salinity field on the equator in the central Pacific
(Figs. 13 and 7). The SEC(N) appears strongest in December, and the NECC peaks
in October. This slight phase difference agrees with results from island sea
level data that span the entire SEC(N) (Wyrtki, 1974a). However, this shift
has not been noted in other studies, which could not resolve the near-equatorial
SEC fully (Kessler & Taft, 1987). The thermocline is very sharp, with a
strong seasonal cycle in the strength of the trough between the SEC(N) and
the NECC as these currents wax and wane. The most prominent cycle in salinity
at 155°W is found in the north, under the ITCZ, where very fresh surface
values occur in OctoberDecember.
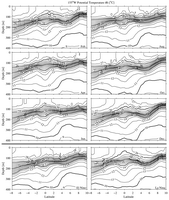
Fig. 12. Meridional sections of potential temperature ()
at 155°W estimated for 6 months and both phases of the ENSO cycle. Details
follow Fig. 3.
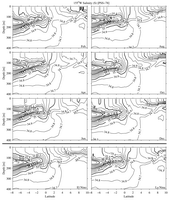
Fig. 13. Meridional sections of salinity (S) at 155°W estimated
for 6 months and both phases of the ENSO cycle. Details follow Fig.
4.
At 155°W the ENSO cycle of variation in the equatorial Pacific current
system can be seen (Fig. 11) as the trades weaken during El Niño and strengthen
during La Niña. The EUC and SEC are both weaker during El Niño compared to
La Niña. As at 165°E, the NECC shifts southward during El Niño and northward
during La Niña. Finally, as expected, the cold tongue is suppressed during
El Niño but enhanced during La Niña (Figs. 12 and 6).
While the meridional shifts of the NECC and the amplitude modulation of the
SEC(N) with the ENSO cycle are in accord with previous studies, the modest
NECC during El Niño is not (Wyrtki, 1974b; Taft & Kessler, 1991). The sparse
temporal and spatial sampling of the sections (Johnson et al., 2000) may not
resolve NECC amplitude changes associated with the SOI in the central Pacific.
The near-equatorial currents are strong during the boreal fall, winter and
La Niña. Their strength supports the generation of TIWs in the central and
eastern Pacific (Baturin & Niiler, 1997). These waves can be sufficiently
vigorous that they may alias the analysis in these regions. Examination of
individual sections suggests that TIWs are aliasing the currents in the central
Pacific, but not so much the eastern Pacific. During the La Niña phase of the
SOI, it appears that in the central Pacific TIWs have been sampled preferentially
in phases that reinforce the SEC(N) and NECC.
3.2.3. Eastern Pacific
At 110°W the relationships among zonal velocity, temperature, and salinity
in the EUC are all evident in the seasonal cycle. The EUC peaks in strength
around April, when it also surfaces (Figs. 14 and 5; Philander & Pacanowski,
1980). This far east, the thermocline is extremely sharp and shallow (Figs.
15 and 6). The equatorial spreading of the thermocline associated with the
EUC is noticeably stronger during April than in October, when equatorial SST
is lowest and the SEC is strongest. The laterally isolated salinity maximum
within the thermocline just south of the equator (Figs.
16 and 7) is strongest
when the EUC velocity is a maximum, or slightly thereafter. This lagged correlation
of maxima in EUC salinity and velocity agrees with results from slightly further
to the east (Lukas, 1986).
Fig. 14. Meridional sections of zonal velocity (U) at 110°W
estimated for 6 months and both phases of the ENSO cycle. Details follow
Fig. 2.

Fig. 15. Meridional sections of potential temperature ()
at 110°W estimated for 6 months and both phases of the ENSO cycle. Details
follow Fig. 3.
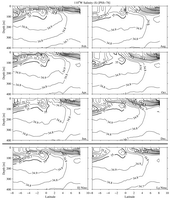
Fig. 16. Meridional sections of salinity (S) at 110°W estimated
for 6 months and both phases of the ENSO cycle. Details follow Fig.
4.
In the north, the NECC is minimum in strength near 110°W (Fig.
2), with
no eastward surface flow in DecemberFebruary and a surface expression that
peaks in August (Fig. 14). The thermocline trough between the SEC and NECC
is only apparent from August to October, again concordant with the zonal velocity
(Fig. 15). Interestingly, while the NECC is weak at 110°W, the NSCC and
SSCC are strong. These countercurrents also display a noticeable seasonal cycle
at 110°W, being stronger in the first half of the year than in the second.
At 110°W surface salinities under the ITCZ are freshest in October (Fig.
16), when the ITCZ is strongest. In addition, surface salinities are fresh
as far south as 7°S in December and February, advected west from fresh
coastal waters by the SEC, with westward surface velocities that peak a few
months earlier (Fig. 14).
As at 155°W, the current system at 110°W is spun up during La Niña, when compared to El Niño (Fig.
14). The
cold tongue is much stronger during La Niña and quite weak during El Niño (Fig.
15). Surface salinities are generally fresher during El Niño than during La
Niña (Fig. 16). These fresh salinities are at least partially a product of
local precipitation associated with eastward migration of warm sea surface
temperatures and convection and part a result of the reduced trade winds (Ando & McPhaden,
1997).
4. Zonal current properties and their variation
The EUC, NECC, and both branches of the SEC are analyzed for each synoptic
section. Quantities evaluated include zonal volume transport as well as velocity-weighted
latitude, depth, potential temperature, and salinity for each current at each
longitude. These quantities are estimated only where the sections have sufficient
meridional and vertical coverage in currents and water properties to sample
fully the current. The NECC was the least frequently sampled current by the
synoptic sections, followed by the SEC(S). These quantities are then fitted
in the same manner as the section data discussed above.
In this analysis, the EUC is defined as all eastward flow between 2°N
and 2°S (Gouriou & Toole, 1993) for potential densities of 23 <  < 26.5
kg m3. In the west, the latitudinal limits
help separate the EUC from the NSCC and the SSCC at depth, as well as from
the surface NECC. The lighter limit helps to distinguish the EUC from transient
eastward-flowing surface jets driven by local westerly wind events (Cronin
et al., 2000), especially in the west. The denser limit attempts to distinguish
the EUC from deeper eastward flows that are sometimes present below the EUC,
usually separated by a velocity reversal (the EIC) or a minimum in eastward
velocity.
< 26.5
kg m3. In the west, the latitudinal limits
help separate the EUC from the NSCC and the SSCC at depth, as well as from
the surface NECC. The lighter limit helps to distinguish the EUC from transient
eastward-flowing surface jets driven by local westerly wind events (Cronin
et al., 2000), especially in the west. The denser limit attempts to distinguish
the EUC from deeper eastward flows that are sometimes present below the EUC,
usually separated by a velocity reversal (the EIC) or a minimum in eastward
velocity.
The NECC is here defined as all eastward flow north of 2°N for < 26.0
kg m3. To be used for NECC estimates, the
velocity and density fields had to suggest that the northern edge of the NECC
was sampled. This restriction meant that the sections usually had to reach
to 8°N or beyond, which unfortunately, but unavoidably, creates some
potential for a biased sample. The 26.0 kg m3 density
limit is near the base of the thermocline and helps to distinguish the NECC
from the NSCC. The current separation is on the whole a bit denser than previous
ones at 165°E based on the minimum in eastward velocity (Gouriou & Toole,
1993), and at 110°W based on  (Hayes,
Toole, & Mangum, 1983).
(Hayes,
Toole, & Mangum, 1983).
The SEC(N) is defined as all westward flow between the equator and the NECC,
and again for < 26.0
kg m3. The SEC(S) is defined as all westward flow between 8°S
(because most of the sections stop at that latitude) and the equator for < 26.0
kg m3. In the far west, around 143°E, New Guinea is substituted
for 8°S as the southern limit of the SEC(S). In this region, upper portions
of the NGCUC are counted as part of the SEC(S). The density limit for both
branches of the SEC is consistent with that for the NECC.
The synoptic analysis presents a picture different from that of the mean section
analysis in at least three ways. First, in the synoptic analysis each section
is reduced to a set of single parameters before fitting. Thus the fits have
less structure than the mean analysis, since the mean analysis allows independent
variations in the properties on isopycnals and the depth of those isopycnals.
Deviations of current properties with respect to the ENSO cycle in the synoptic
analysis are just linear perturbations of the mean properties regressed against
the SOI and the seasonal cycle is a pure annual harmonic. Thus, only El Niño
fits are shown, since La Niña fits contain no additional information. For each
current and quantity the means and the variations with the ENSO cycle (shown
as a strong El Niño by evaluating the fits at SOI = 1.5) are presented as
functions of longitude. The seasonal cycle is shown separately.
The second difference is that the synoptic section analysis exactly follows
the currents as they move horizontally and vertically, within the density and
latitude limits noted above: a Lagrangian approach. However, while the mean
section analysis is quasi-Lagrangian in the vertical, since it is done on isopycnals,
it is closer to Eulerian in the meridional. The annual harmonics and regression
against the SOI in the mean section analysis accounts for some of the currents meridional
migrations, but not all of them. That is to say, currents are not completely
followed as they move north or south with various higher frequency motions
such as TIWs and other disturbances.
The third difference is that the synoptic section analysis defines currents
as all flow in a given direction and region as noted above. With this definition,
there are never any current reversals portrayed in individual sections, just
absences of currents, which are fitted as zero transport and omitted from the
other property fits. This situation contrasts with the mean section analysis,
which includes velocity reversals at any given latitude and isopycnal. These
last two differences combine for stronger current transports in the fits of
the synoptic section analysis than in the mean section analysis.
4.1. Zonal current volume transports
Variations of the equatorial zonal currents are closely connected to seasonal
and ENSO cycle changes in the equatorial easterlies. Equatorial zonal winds
affect the surface currents primarily through downwind frictional forcing and
setup of a zonal pressure gradient, which exerts an upwind forcing below the
frictional layer. Thus, when the easterly trade winds are strong, they tend
to spin up both the westward SEC at the surface and, after time, the eastward
EUC beneath. By elevating the equatorial thermocline (through upwelling caused
by local Ekman divergence and non-local wave adjustments), strong trades also
tend to produce meridional pressure gradients that foster westward off-equatorial
currents. During El Niño, or during the phase of the annual cycle with westerly
anomalies, the opposite changes occur.
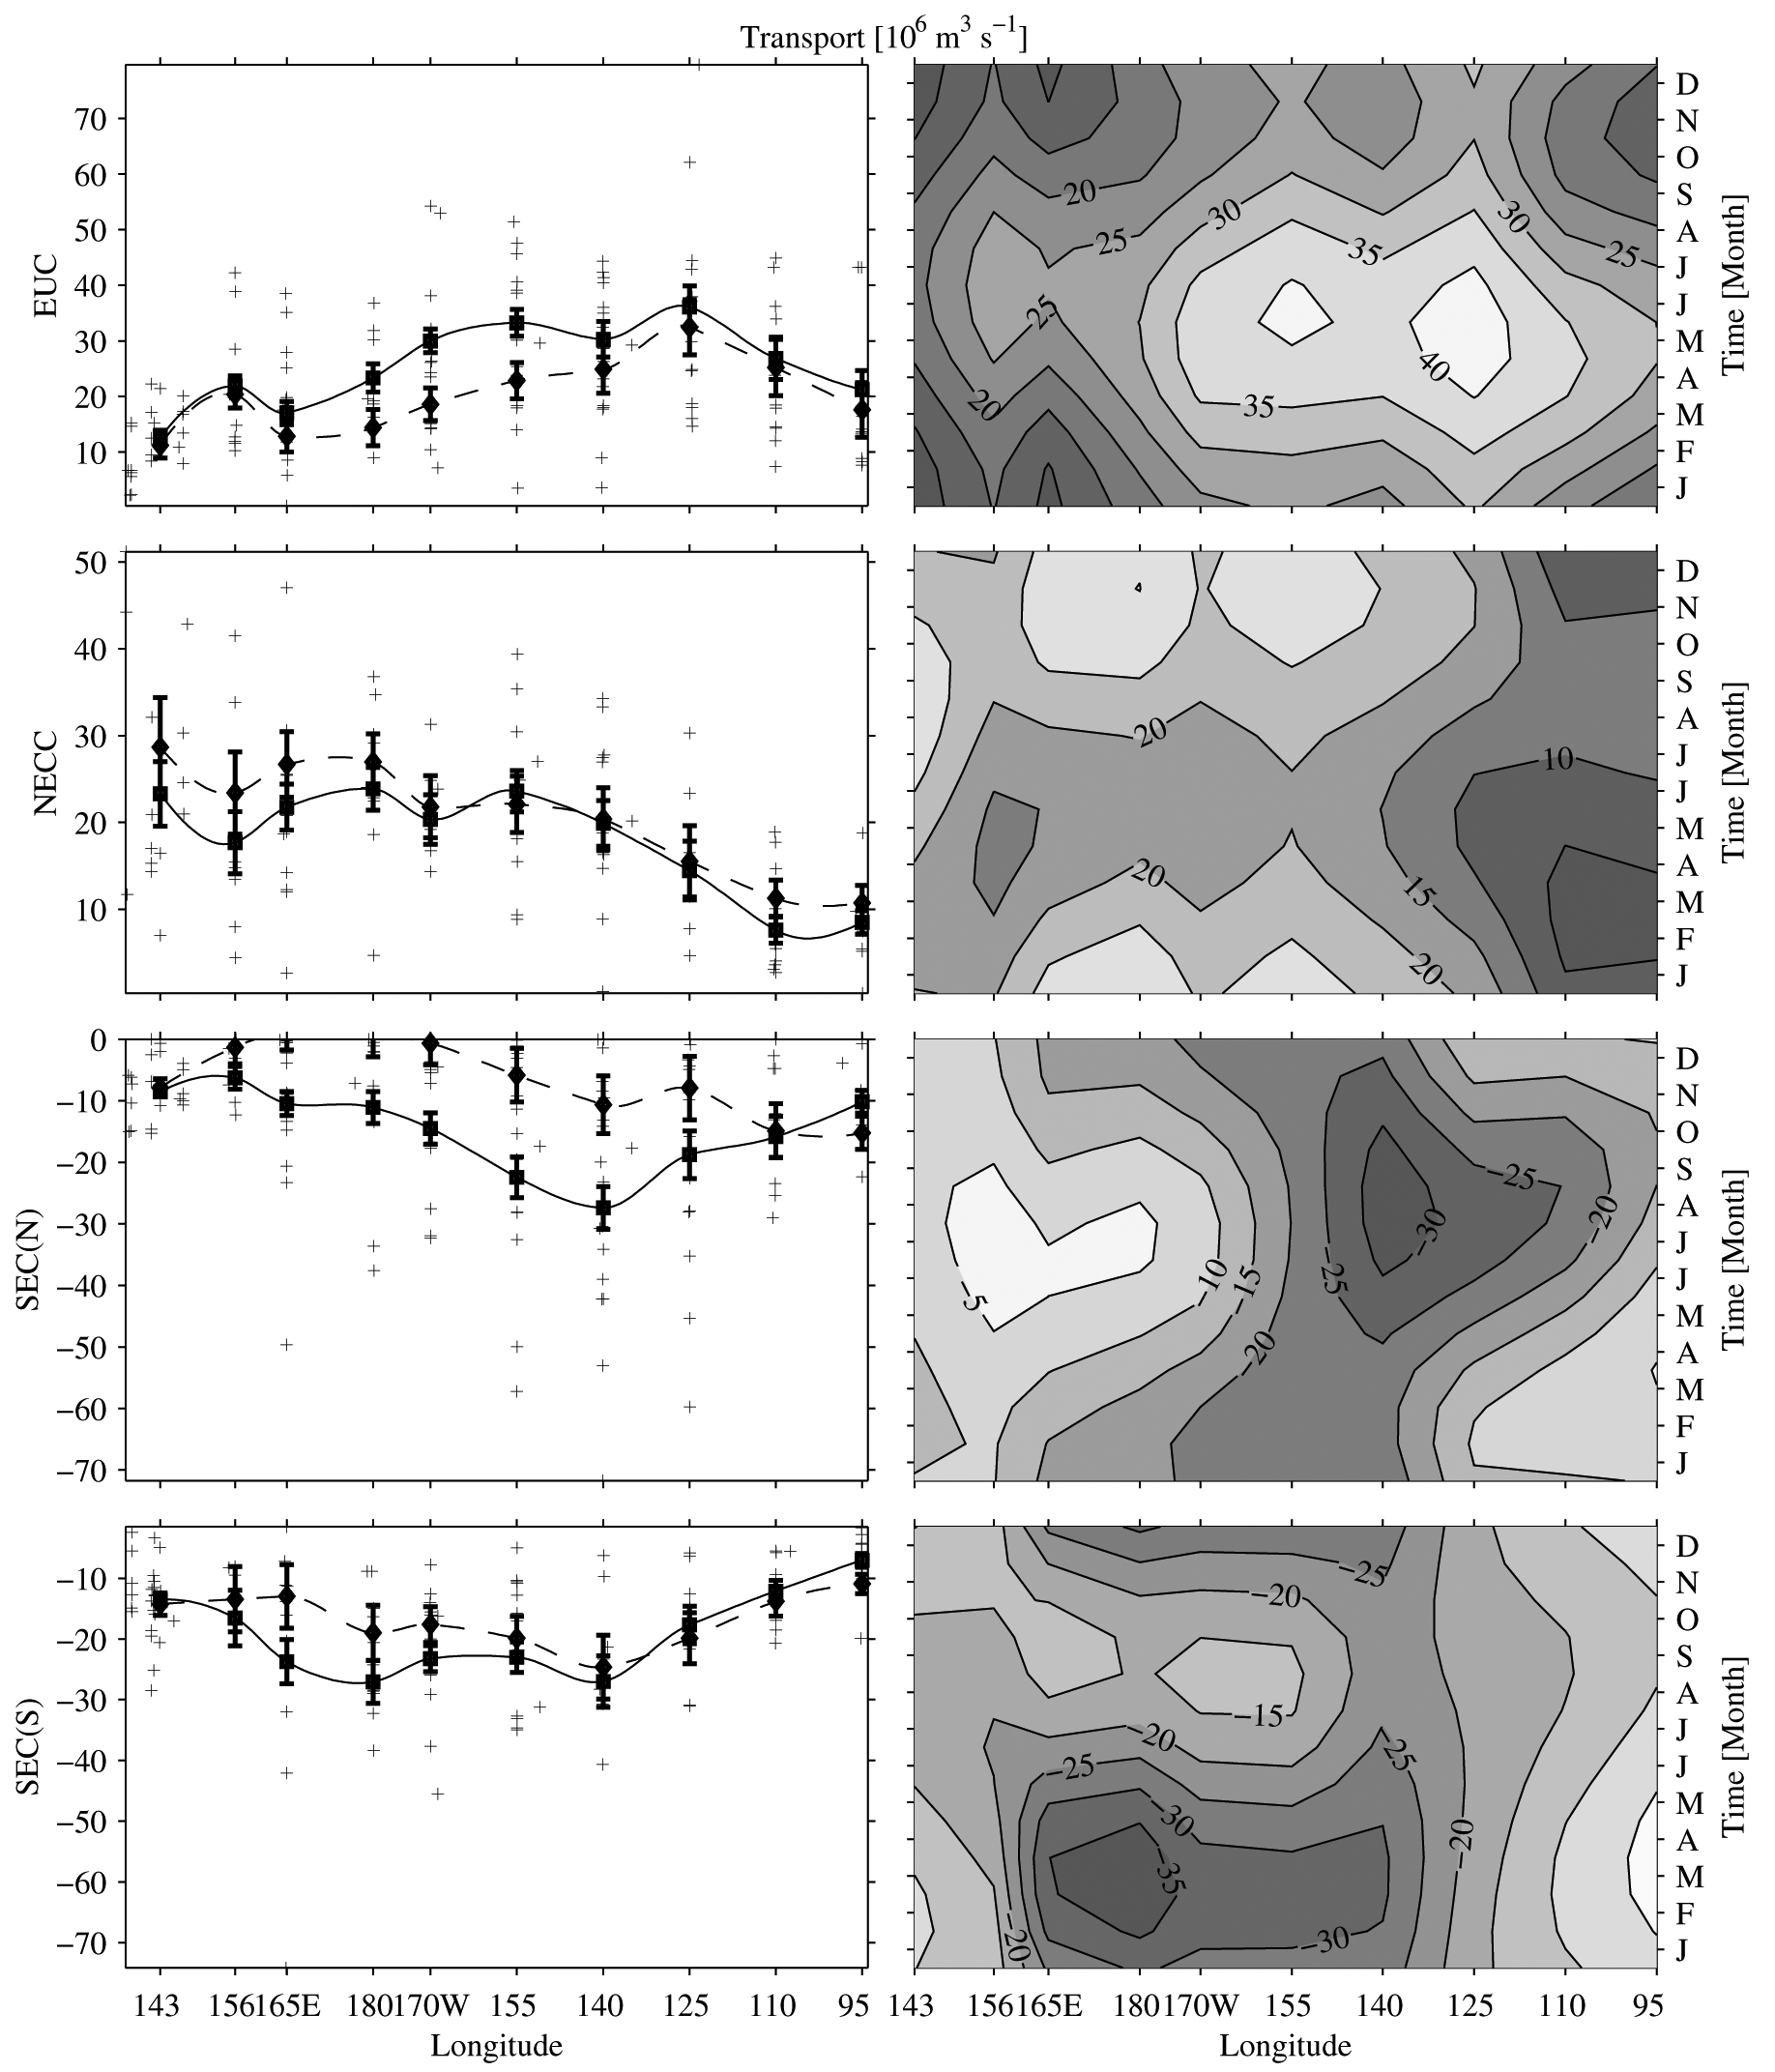
The mean volume transport of the EUC (Figs. 17 and 5) is larger in the central
Pacific than in the west or the east. In the central Pacific the trade winds
are strongest, the zonal thermocline slope and thus the zonal pressure gradient
is the biggest, and so the EUC is the largest. The seasonal cycle in EUC transport
is substantial at all longitudes. The phasing is such that EUC transport peaks
in mid-May in the east and late June in the west, as the relaxed trade winds
during this time allow increased eastward flow in the upper half of the EUC
(Philander, Hurlin, & Seigel, 1987). This westward phase propagation in
the EUC agrees with model results (Blanke & Raynaud, 1997) and empirical
analyses (Yu & McPhaden, 1999). The weakening or disappearance of the EUC
during the height of El Niño was observed during the events of 198283 (Firing,
Lukas, Sadler, & Wyrtki, 1983), 198687 (McPhaden, Hayes, Mangum, & Toole,
1990), 199192 (Kessler & McPhaden, 1995) and 199798 (Johnson et al.,
2000).
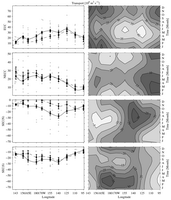
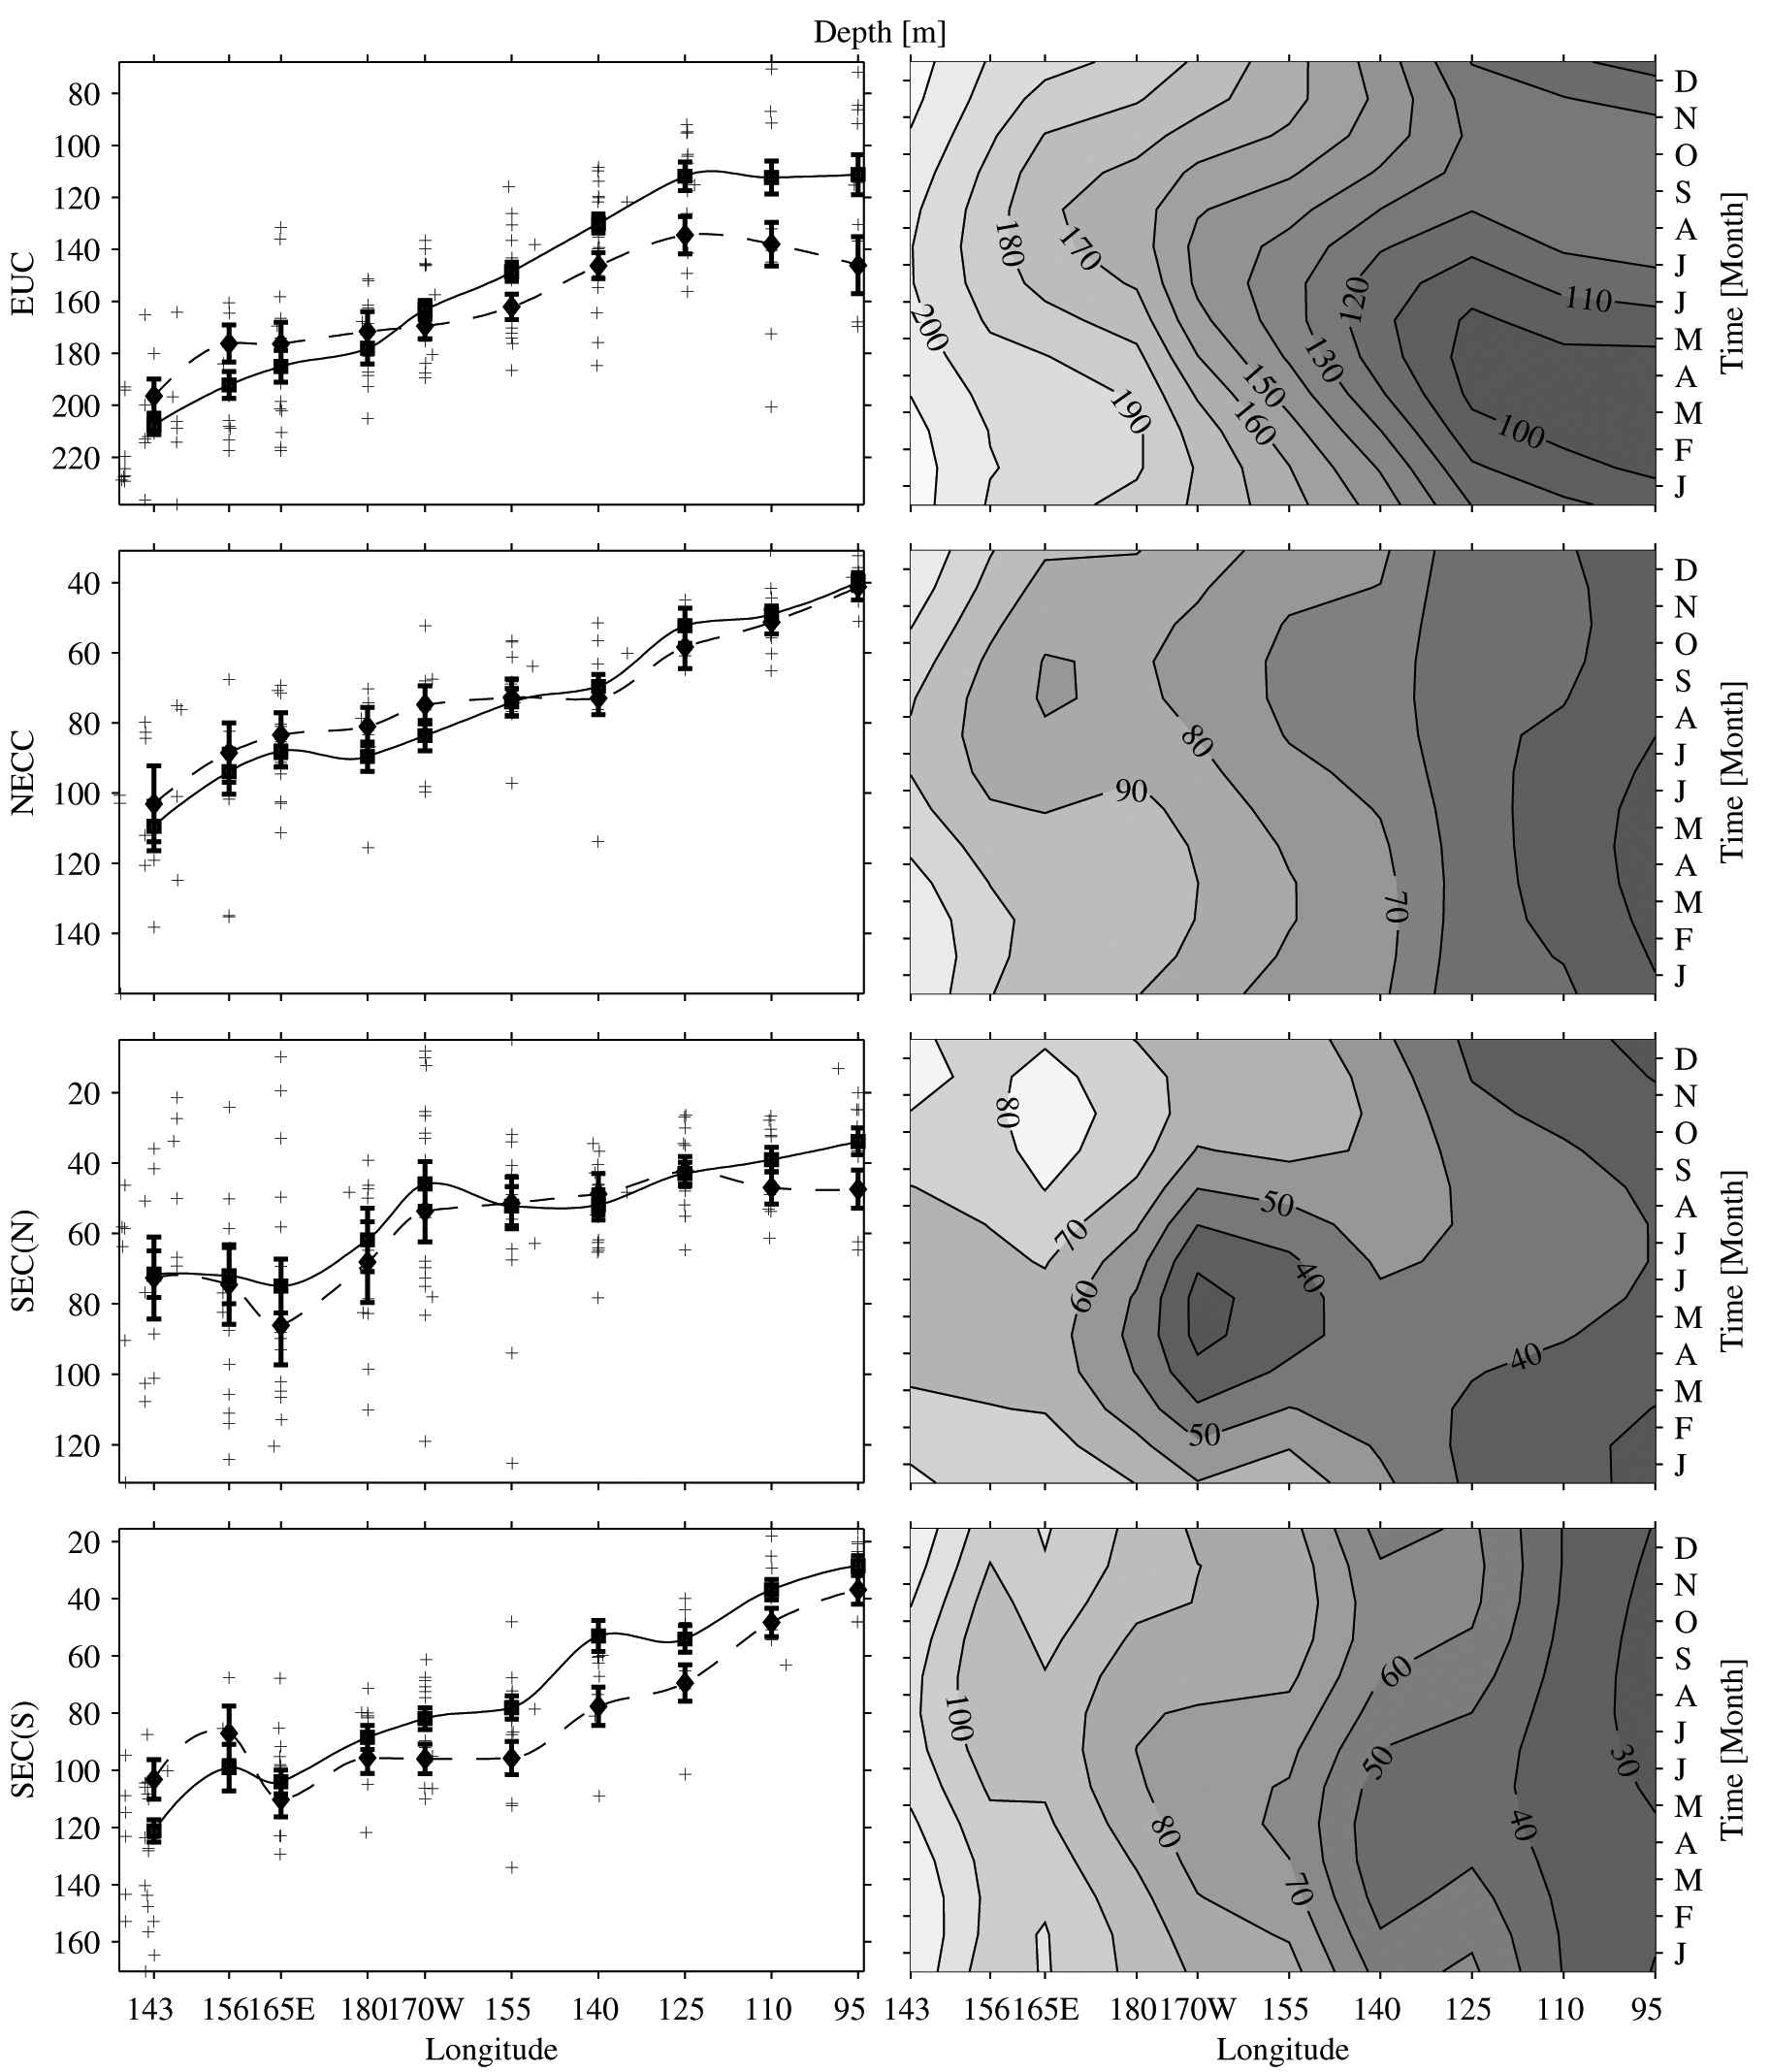
Fig. 17. Zonal current volume transport (106 m3 s–1)
for (from top to bottom) the EUC, NECC, SEC(N), and SEC(S). Left panels show
the quantity with error bars versus longitude for means (GRAPHIC_HERE joined
by solid lines), SOI = –1.5 strong El Niño (GRAPHIC_HERE joined
by dashed lines), and raw data (+). Right panels show contours of the seasonal
cycle versus longitude. Contour interval in the right panels is 5 × 10⁶ m3 s–1 and
the y-axis tick marks on the left panels are at twice that interval.
The mean transport of the NECC is fairly constant over the western and central
Pacific, but decreases in the east, becoming smallest around 110°W (Fig.
17). This minimum at 110°W is as expected from the Sverdrup relation
(Kessler, 2002). The sampling in the far west is sparse and the transport
uncertainties are correspondingly large. The seasonal cycle is a large fraction
of the mean transport of the NECC. The NECC has its largest transport in August
at 95°W, but at and west of 125°W the maximum in transport occurs
in OctoberDecember, except near 143°E, which probably sees the influence
of the western boundary. This shift with longitude is again a signature of
westward phase propagation. Around February the NECC is very weak east of 125°W.
During El Niño events, the NECC is important for export of water eastward from
the warm pool, and its transport increases by about 25% (Picaut, Ioualalen,
Menkes, Delcroix, & McPhaden, 1996). Central Pacific transport NECC variations
with the SOI are aliased by TIWs as discussed in Section 3.2.
Transport estimates for the westward-flowing SEC(N) are difficult and rarely
direct (Wyrtki, 1974a; Wyrtki & Kilonsky, 1984; Picaut & Tournier,
1991). The mean volume transport of this current peaks in amplitude in the
central Pacific (Fig. 17). Throughout the basin, but especially in the western
Pacific where the NECC is closest to the equator, the SEC(N) is sometimes absent.
The current transport estimated through the synoptic analysis in the west is
clearly large compared with the mean fields estimated on isopycnals (Fig.
8).
This example best highlights this difference between the synoptic current transport
analysis and the mean fit fields as discussed in Section 4.
Much like the NECC, the seasonal cycle of the SEC(N) volume transport is such
that the current is weakest in FebruaryMarch in the east, but this lull transitions
to around July in the west (Fig. 17; Wyrtki, 1974a). Depth fluctuations of
the thermocline trough near 4°N5°N affect both the SEC(N) to the south and the NECC to the north, by
simultaneously modulating the pressure gradients across the two currents. As
a result, their transport variations tend to be approximately in phase (Kessler & Taft,
1987). The local manifestation of an annual equatorial Rossby wave at 5°N
(Yu & McPhaden, 1999) accounts for most of the annual variability of the
depth of the trough (Kessler, 1990). This wave is forced by the wind stress
curl resulting from the annual northsouth migration of the ITCZ. The amplitude
of the seasonal cycle is large throughout the basin. Unfortunately, the SEC(N)
and NECC transport estimates around 140°W are aliased by energetic TIWs
sometimes present in the central Pacific as discussed in Section 3.2.2. The
TIW signal is reflected by the relatively wide distribution of transport estimates
for these currents in that region (Fig. 17).
West of 110°W, the SEC(N) is greatly reduced during El Niño, at least
partly because of the reduction in the trades. The deepening of the equatorial
thermocline reduces the meridional pressure gradient and results in anomalously
eastward surface geostrophic velocities during El Niño, with a reduced SEC
and an increased NECC. Momentum advection driven by cross-equatorial southerly
winds may also be important in the SEC(N) dynamics in the central to eastern
Pacific (Philander et al., 1987).
The SEC(S) mean volume transports (Fig. 17) build from fairly small values
at 95°W to nearly constant values west of 140°W, before diminishing
again west of 165°E. As mentioned before, at 143°E the upper part of the NGCUC is folded into these SEC(S) transport
estimates. The amplitude of the seasonal cycle is large only between 165°E
and 155°W, with the current being strongest in FebruaryMarch, roughly
in opposite phase with the SEC(N). The volume transport decreases significantly
only in the west during El Niño (except at 143°E where the NGCUC is strong
during that phase of ENSO). This change is a different, but much less dramatic,
response to the reduction in trade wind forcing than that seen in the SEC(N).
The zonal asymmetry may result from an enhancement of the South Pacific Convergence
Zone (SPCZ) during El Niño, which increases the SECC and reduces the SEC(S)
in the western Pacific (Kessler & Taft, 1987). It is important to remember
that there may be SEC(S) fluctuations beyond 8°S that are missed by this
data set.
4.2. Zonal current latitudes and depths
The mean latitude of the EUC (Figs. 18 and 2) is near the equator except at
143°E where the NGCUC is strong. The EUC core shifts slightly south of
the equator in the east, owing to the meridional circulation induced by predominantly
southerly winds in that region (Philander & Delecluse, 1983; Kessler, Rothstein, & Chen,
1998). Eastward shoaling of the EUC is apparent in the mean from 143°E
to 125°W, but the velocity-weighted EUC is relatively constant in depth
east of that longitude (Fig. 19) while the peak velocity continues to shoal
slightly (Fig. 3).
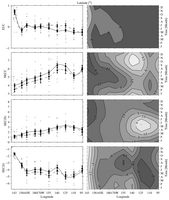
Fig. 18. Zonal velocity-weighted current latitude (°) for (from top
to bottom) the EUC, NECC, SEC(N), and SEC(S). Contour interval in the right
panels is 0.5° and the y-axis tick marks on the left panels are
at twice that interval. Details follow Fig. 17.
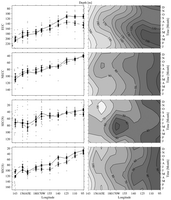
Fig. 19. Zonal velocity weighted current depth (m) for (from top to bottom)
the EUC, NECC, SEC(N), and SEC(S). Contour interval in the right panels is
10 m and the y-axis tick marks on the left panels are at twice that
interval. Details follow Fig. 17.
The seasonal cycle of EUC depth is very smooth and well defined. The current
shoals in March at 95°W, and this shoaling generally lags to the west
(except closest to the western boundary), with maximum shoaling in August by
165°E. This westward propagation is a signature of an annual Rossby wave
(Lukas & Firing, 1985; Kessler & McCreary, 1993). Shallower depths
are generally associated with large transports in the seasonal cycle, although
there are some phase differences between seasonal EUC transport and depth.
This correlation arises as the EUC picks up eastward transport in the shallower
layers with relaxed trade winds. The seasonal cycle of EUC latitude is very
small except in the far west. During El Niño the EUC shifts northward toward
the equator in the central Pacific. During this phase of ENSO the EUC deepens
considerably in the east, and shoals in the west, consistent with the reduced
zonal slope of the equatorial thermocline.
The mean latitude of the NECC moves gradually northward as the current progresses
from west to east, with an interruption of this tendency at 110°W (Figs.
18 and 2), where the mean transport is weakest (Fig.
17). At this longitude
the NECC and NSCC are difficult to distinguish because the NECC is very weak,
so there is little eastward velocity above the thermocline. The NECC also shoals
from west to east (Fig. 19) with the shoaling thermocline. The seasonal cycle
of latitude is such that the NECC is generally found furthest south when its
volume transport is at a minimum. The seasonal cycle of depth is notable only
west of 125°W, with the current being slightly deeper in FebruaryApril.
During El Niño the NECC is found south of its usual latitude in the western
and central Pacific, and it shoals in the western Pacific with a hint of deepening
in the east, as expected from the migration of the warm pool to the east during
this phase of ENSO.
The mean latitude of the SEC(N) starts near 2°N in the east, approaches
3°N in the central Pacific (Figs. 18 and 2), where the current is strongest,
and then tends southward to 1°N in the west where the current weakens. The SEC(N) also deepens to
the west (Fig. 19), again with the westward deepening of the thermocline until
it reaches the warm pool, where the depth remains constant. The seasonal cycle
of latitude is such that the SEC(N) is generally furthest north when its volume
transport is at a minimum, in contrast with the seasonal cycle of the NECC.
The current is shallowest in JanuaryFebruary in the east, with a westward
lag toward shallowest values in MayJune in the west. Deeper values are correlated
with larger transports. During El Niño the current moves southward as it weakens
in transport, again consistent with eastward migration of the warm pool. Interestingly,
during El Niño it also deepens in the west as its transport decreases, because
surface flow tends to be eastward during this time and the SEC(N) is sometimes
limited to a subsurface expression.
The SEC(S) is located from 4°S to 5°S in the mean (Fig.
18), except
near the western boundary where it is forced northward by New Guinea and joins
the NGCUC. Of course, this latitude is somewhat influenced by the southern
limit of 8°S in this analysis. Like the rest of the currents, the SEC(S)
deepens to the west (Fig. 19) with the thermocline. In the seasonal cycle,
the SEC(S) also generally shifts south when transports are weakest. The seasonal
cycle of the SEC(S) depth is such that it is shallowest in MayAugust, roughly
in phase with the SEC(N). The current shifts southward in the west and weakens
under El Niño conditions. During El Niño, like the SEC(N), the current deepens
(except in the far west where the NGCUC influences the analysis) for the same
reason: a tendency toward increased eastward surface flows.
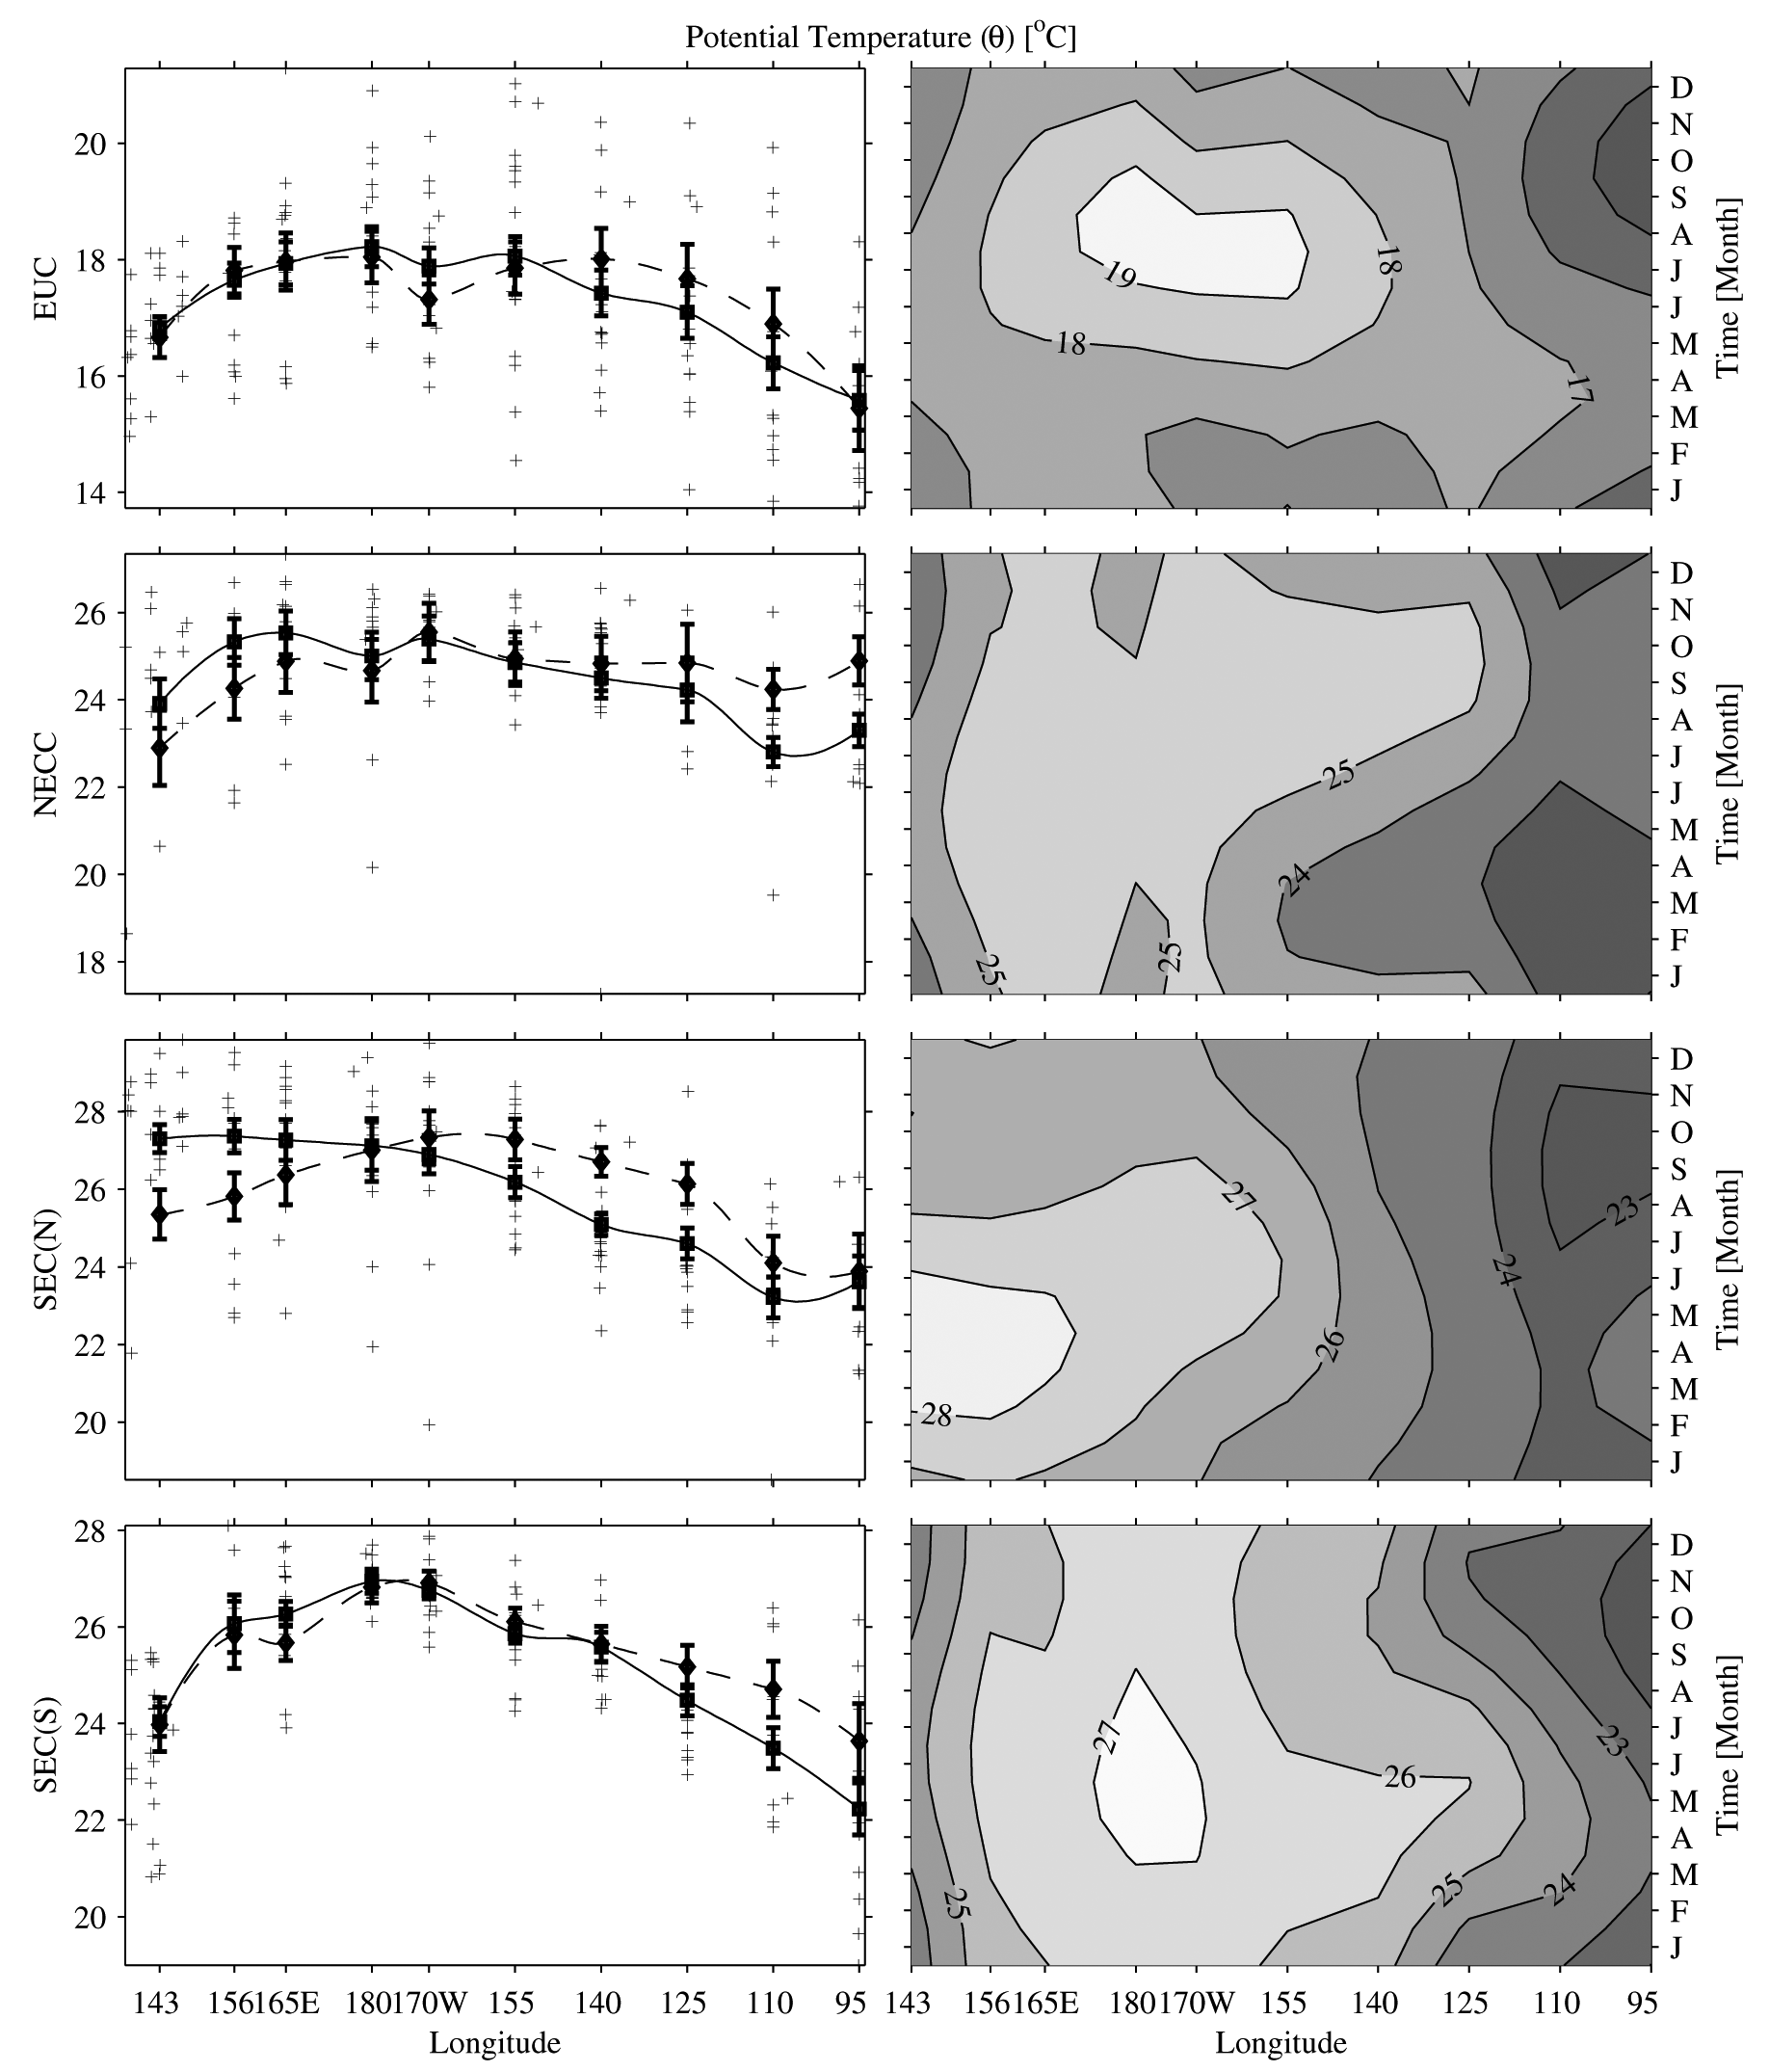
4.3 Zonal current temperatures and salinities
In the mean the EUC is warmest (Fig. 20) and saltiest (Fig.
21) near the dateline.
These changes occur because the current adds warm and salty water from the
southern hemisphere (Johnson & McPhaden, 1999) as it moves eastward, but
then as it surfaces in the east its warmer and saltier waters upwell into the
SEC. The seasonal cycle is such that the EUC is warmer and saltier when the
transport is largest, because the upper layers of the EUC, which are warmer
and saltier, make up most of the seasonal variability. During El Niño
there is some warming of the EUC in the eastern Pacific, owing to more near-surface
eastward flow under the relaxed trades. During El Niño there is also
some freshening of the EUC in the western Pacific, perhaps associated with
eastward migration of the fresh pool in the upper portions of the EUC.
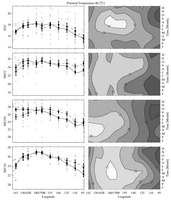
Fig. 20. Zonal velocity-weighted current temperature (°C) for (from
top to bottom) the EUC, NECC, SEC(N), and SEC(S). Contour interval in the right
panels is 1°C and the y-axis tick marks on the left panels are
at twice that interval. Details follow Fig. 17.
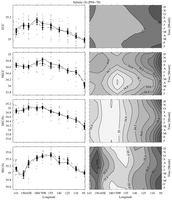
Fig. 21. Zonal velocity-weighted current salinity (PSS–78) for (from
top to bottom) the EUC, NECC, SEC(N), and SEC(S). Contour interval in the right
panels is 0.1 and the y-axis tick marks on the left panels are at twice
that interval. Details follow Fig. 17.
The NECC temperature is relatively warm (Fig. 20) and fresh (Fig.
21), but
it cools a little and freshens a lot in the mean as it flows eastward under
the high precipitation of the ITCZ. The seasonal cycle is such that the NECC
is warmest and freshest when the transports are largest, because near-surface
intensification accounts for much of the seasonal cycle. During El Niño
the NECC tends to be warmer in the east, and fresher in the central Pacific.
The latter change is probably a result of large-scale precipitation changes
and eastward advection of the fresh pool.
The SEC(N) is cool (Fig. 20) and fresh (Fig.
21) in the east where it flows
adjacent to the ITCZ and to the fresh coastal surface waters. It warms and
becomes increasingly salty to the west. The seasonal cycle of temperature is
such that larger transports are generally associated with cooler temperatures.
The seasonal cycle of salinity is really only large in the east, where the
current is freshest in January, a time when its transport is low and the ITCZ
has moved south over the current. As might be expected, the SEC(N) is slightly
warmer in the east during El Niño, when the cold equatorial upwelling
that feeds it is suppressed. The salinity shows no change with variations of
the ENSO cycle.
Like the SEC(N), the SEC(S) warms (Fig. 20) and gets saltier (Fig.
21) as
it transits from east to west, except that it cools slightly and freshens in
the far west, because of the presence of the SPCZ. The exception is the western
boundary where the cold, relatively fresh influence of the NGCUC is seen. The
current is generally warmest around April throughout the basin. However, it
is saltiest in the eastern Pacific around July when the ITCZ is far to the
north, and freshest in the western Pacific around the same time. During El
Niño the current warms slightly in the east; this is again not surprising,
since it is fed at least in part from equatorial and coastal upwelling, both
of which are much weaker and warmer during El Niño. The SEC(S) also
gets a bit saltier in the central Pacific during El Niño, mostly because
the current deepens, and additionally, is found only well south of the equator.
As a result of these changes, the current carries a lower fraction of fresher
surface equatorial water.
5. Conclusion
Meridional sections constructed from contemporaneous CTD and ADCP data taken
across the Pacific, primarily during the 1990s, have been used to describe
the mean zonal evolution of upper-ocean tropical zonal velocity, temperature,
and salinity, as well as the seasonal cycle and the ENSO cycle. The data are
unusual in that they allow direct estimates of properties of the near-equatorial
currents, including the SEC(N), EUC, and EIC. The large number of sections
taken, and the quality of the zonal velocity data, enable a four-dimensional
exploration of the upper ocean zonal velocity field. This analysis should be
useful for model comparisons. In addition it comprises a consistent climatology
of simultaneously sampled zonal velocity, temperature, and salinity for the
decade, to compare with past and future decades.
Some of the more novel results of this analysis involve the near-equatorial
and subthermocline currents. For instance, the westward intensification of
the EIC stands out in the mean velocity sections. A seasonal cycle of the EIC
is also to be seen in the west. Another intriguing result in the eastern Pacific
is the hint of a seasonal cycle of the SCCs at 110°W. Basin-wide estimates
of the SEC(N) and its properties are unusual. The SEC(N) has a central Pacific
transport maximum, a seasonal cycle nearly in phase with the NECC, and the
suggestion of a large reduction during El Niño. The inclusion of so many realizations
of the NGCUC in the analysis is also rare. The use of direct velocity data
also allows inclusion of ageostrophic effects both around the equator (Joyce
et al., 1988) and away from it. For instance, the subsurface velocity maximum
in the NECC is some combination of the wind-driven Ekman layer and geostropic
shear, a feature that geostrophic calculations alone would not resolve.
These data are also the backbone for an inverse model of the tropical Pacific
circulation. They are being combined with meridional velocities estimated through
geostrophy and Ekman dynamics, and the entire current system is adjusted to
conserve mass, heat, and freshwater, including the contributions of surface
fluxes. The model is initially being run using the mean fields, but will soon
include a seasonal cycle. The results are allowing diagnosis of the effects
of diapycnal mixing processes on the maintenance of the cold tongue. In addition,
the role of the subtropical cell in cycling water from the South Pacific to
the North Pacific to feed the Indonesian throughflow is being explored.
Acknowledgements
This work was partially funded by the NOAA Office of Oceanic and Atmospheric
Research, the NOAA Office of Global Programs, and the NASA Physical Oceanography
Program. This work was performed while BMS held a National Research Council
Research Associateship Award at NOAAs Pacific Marine Environmental Laboratory
(PMEL). The analysis would not have been possible without the careful and sustained
work of the TAO project, especially the officers, crew, and scientific parties
of the NOAA Ships Discoverer, Kaimimoana and Ronald H. Brown, especially
Dennis Sweeny. Eric Johnson and Patricia Plimpton processed the earlier NOAA
ADCP data. June Firing and Jules Hummon processed the later NOAA ADCP data
as well as much of the ADCP data from other sources. Data from R/V Kaiyo were
also essential, with contributions from the officers, crew, and all TOCS participants
both at sea and ashore. Discussions with Mike McPhaden were useful. PMEL Contribution
Number 2337.
References
Akima, H. (1970). A new method of interpolation and smooth curve fitting based
on local procedures. Journal of the Association for Computing Machinery,
17, 589-602.
Ando, K., & McPhaden, M. J. (1997). Variability of surface layer hydrography
in the tropical Pacific Ocean. Journal of Geophysical Research, 102, 23063-23078.
Baturin, N. G., & Niiler, P. P. (1997). Effects of instability waves in the
mixed layer of the equatorial Pacific. Journal of Geophysical Research,
102, 27771-27793.
Blanke, B., & Raynaud, S. (1997). Kinematics of the equatorial undercurrent:
an Eulerian and Lagrangian approach from GCM results. Journal of Physical
Oceanography, 27, 1038-1053.
Bryden, H. L., & Brady, E. C. (1985). Diagnostic model of the three-dimensional
circulation in the upper equatorial Pacific Ocean. Journal of Physical Oceanography,
6, 33-37.
Butt, J., & Lindstrom, E. (1994). Currents off the east coast of New Ireland,
Papua New Guinea, and their relevance to regional undercurrents in the western
equatorial Pacific Ocean. Journal of Geophysical Research, 99, 12503-12514.
Cornuelle, B. D., Morris, M. Y., & Roemmich, D. H. (1993). An objective mapping
method for estimating geostrophic velocity from hydrographic sections including
the equator. Journal of Geophysical Research, 98, 18109-18118.
Cronin, M. F., & McPhaden, M. J. (1998). Upper ocean salinity balance in the
western equatorial Pacific. Journal of Geophysical Research, 103, 27567-27587.
Cronin, M. F., McPhaden, M. J., & Weisberg, R. H. (2000). Wind-forced reversing
jets in the western equatorial Pacific. Journal of Physical Oceanography,
30, 657-676.
Delcroix, T., Eldin, G., & Henin, C. (1987). Upper ocean water masses and
transports in the western tropical Pacific (165E). Journal of Physical Oceanography,
17, 2248-2262.
Delcroix, T., Eldin, G., Radenac, M. -H., Toole, J., & Firing, E. (1992).
Variations of the western equatorial Pacific Ocean, 1986- 1988. Journal
of Geophysical Research, 97, 5423-5445.
Delcroix, T., & Henin, C. (1988). Observations of the equatorial intermediate
current in the western Pacific Ocean (165E). Journal of Physical Oceanography,
18, 363-366.
Delcroix, T., & Picaut, J. (1998). Zonal displacement of the western equatorial
Pacific fresh pool. Journal of Geophysical Research, 103, 1087-1098.
Donguy, J.-R., & Meyers, G. (1996). Mean annual variation of transport of
major currents in the tropical Pacific Ocean. Deep-Sea Research I, 43, 1105-1122.
Eldin, G. (1983). Eastward flows of the south equatorial central Pacific. Journal
of Physical Oceanography, 13, 1461-1467.
Eldin, G., Delcroix, T., Henin, C., Richards, K., du Penhoat, Y., Picaut,
J., & Rual, P. (1994). The large-scale structure of currents and hydrology
along 156 E during the COARE intensive observation period. Geophysical Research
Letters, 21, 2681-2684.
Firing, E., Lukas, R., Sadler, J., & Wyrtki, K. (1983). Equatorial undercurrent
disappears during the 1982-83 El Niño. Science, 222,1121-1123.
Firing, E., Wijffels, S. E., & Hacker, P. (1998). Equatorial subthermocline
currents across the Pacific. Journal of Geophysical Research, 103, 21413-21423.
Gouriou, Y., & Toole, J. (1993). Mean circulation of the upper layers of the
western equatorial Pacific Ocean. Journal of Geophysical Research, 98, 22495-22520.
Hayes, S. P. (1982). A comparison of geostrophic and measured velocities in
the equatorial undercurrent. Journal of Marine Research, 40, 219-229.
Hayes, S. P., Mangum, L. J., Picaut, J., Sumi, A., & Takeuchi, K. (1991).
TOGA-TAO: a moored array for real-time measurements in the tropical Pacific
Ocean. Bulletin of the American Meteorological Society, 72, 339-347.
Hayes, S. P., Toole, J. M., & Mangum, L. J. (1983). Water-mass and transport
variability at 110 W in the equatorial Pacific. Journal of Physical Oceanography,
13, 153-168.
Johnson, E. S., & Luther, D. S. (1994). Mean zonal momentum balance in the
upper and central equatorial Pacific Ocean. Journal of Geophysical Research,
99, 7689-7705.
Johnson, E. S., & Plimpton, P. E. (1999). TOGA/TAO shipboard ADCP data
report, 1991-1995. NOAA Data Rep., ERL PMEL-67, 23 pp.
Johnson, G. C. (2001). The Pacific Ocean subtropical cell surface limb. Geophysical
Research Letters, 28, 1771-1774.
Johnson, G. C., & McPhaden, M. J. (1999). Interior pycnocline flow from the
subtropical to the equatorial Pacific Ocean. Journal of Physical Oceanography,
29, 3073-3098.
Johnson, G. C., McPhaden, M. J., & Firing, E. (2001). Equatorial Pacific Ocean
horizontal velocity, divergence, and upwelling. Journal of Physical Oceanography,
31, 839-849.
Johnson, G. C., McPhaden, M. J., Rowe, G. D., & McTaggart, K. E. (2000). Upper
equatorial Pacific Ocean current and salinity variability during the 1996-1998
El Niño-La Niña cycle. Journal of Geophysical Research, 105, 1037-1053.
Johnson, G. C., & Moore, D. W. (1997). The Pacific subsurface countercurrents
and an inertial model. Journal ofPhysical Oceanography, 27, 2448-2459.
Joyce, T. M., Lukas, R., & Firing, E. (1988). On the hydrostatic balance and
equatorial geostrophy. Deep-Sea Research, 35, 1255-1257.
Kashino, Y., Hase, H., Ando, K., Yoneyama, K., Takatsuki, Y., Kuroda, Y., & Mizuno,
K. (2001) TOCS Data Report 2: 1995-2000. Ocean Observations and Research
Department, Japan Marine Science and Technology Center, 2-15 Natsushima, Yokosuka
237-0061, Japan, TOCS No. 4, 327 pp.
Kessler, W. S. (1990). Observations of long Rossby waves in the northern tropical
Pacific. Journal of Geophysical Research, 95, 5183-5217.
Kessler, W. S. (1999). Interannual variability in the subsurface high-salinity
tongue south of the equator at 165 E. Journal of Physical Oceanography,
29, 2038-2049.
Kessler, W. S. (2002). Mean three-dimensional circulation in the northeast
tropical Pacific. Journal of Physical Oceanography,
32, 2457–2471.
Kessler, W. S., & McCreary, J. P. (1993). The annual wind-driven Rossby wave
in the subthermocline equatorial Pacific. Journal of Physical Oceanography,
23, 1192-1207.
Kessler, W. S., & McPhaden, M. J. (1995). The 1991-93 El Niño in the
central Pacific. Deep-Sea Research I, 42, 295-333. Kessler, W. S., Rothstein,
L. M., & Chen, D. (1998). The annual cycle of SST in the eastern tropical Pacific,
as diagnosed in an ocean GCM. Journal of Climate, 11, 777-799.
Kessler, W.S., Rothstein, L.M., & Chen, D. (1998). The
annual cycle of SST in the eastern tropical Pacific, diagnosed in an ocean
GCM. Journal of Climate, 11, 777–799.
Kessler, W. S., & Taft, B. A. (1987). Dynamic heights and zonal geostrophic
transports in the central tropical Pacific during 1979- 84. Journal of Physical
Oceanography, 17, 97-122.
Lagerloef, G. S. E., Mitchum, G. T., Lukas, R. B., & Niiler, P. P. (1999).
Tropical Pacific near-surface currents estimated from altimeter, wind, and
drifter data. Journal of Geophysical Research, 104, 23313-23326.
Lozier, M. S., McCartney, M. S., & Owens, W. B. (1994). Anomalous anomalies
in averaged hydrographic data. Journal of Physical Oceanography, 24, 2624-2638.
Lukas, R. (1986). The termination of the equatorial undercurrent in the Eastern
Pacific. Progress in Oceanography, 16, 63-90. Lukas, R., & Firing, E.
(1984). The geostrophic balance of the Pacific equatorial undercurrent. Deep-Sea
Research, 31, 61-66.
Lukas, R., & Firing, E. (1985). The annual Rossby wave in the central equatorial
Pacific Ocean. Journal of Physical Oceanography, 15, 55-67.
McPhaden, M. J., Busalacchi, A. J., Cheney, R., Donguy, J. -R., Gage, K. S.,
Halpern, D., Ji, M., Julian, P., Meyers, G., Mitchum, G. T., Niiler, P. P.,
Picaut, J., Reynolds, R. W., Smith, N., & Takeuchi, K. (1998). The Tropical
Ocean-Global Atmosphere (TOGA) observing system: a decade of progress. Journal
of Geophysical Research, 103, 14169-14240.
McPhaden, M. J., Hayes, S. P., Mangum, L. J., & Toole, J. M. (1990). Variability
in the western equatorial Pacific during the 1986- 87 El Niño/Southern
Oscillation event. Journal of Physical Oceanography, 20, 190-208.
McPhaden, M. J., & Taft, B. A. (1988). Dynamics of seasonal and interannual
variability in the eastern equatorial Pacific. Journal of Physical Oceanography,
18, 1713-1732.
McTaggart, K. E., & Johnson, G. C. (1999). CTD measurements during 1997
and 1998 as part of the Global Ocean -Atmosphere-Land System (GOALS)/Pan
American Climate Studies (PACS). NOAA Data Report ERL PMEL-66, 770 pp.
Merle, J., Rotschi, H., & Voituriez, B. (1969). Zonal circulation in the tropical
western South Pacific at 170°E. Bulletin of the Japanese Society of Scientific
Fisheries, Special Number (Professor Udas commemorative papers), 91-98.
Moum, J. N., Chereskin, T. K., Park, M. M., & Regier, L. A. (1987). Monitoring
geostrophic currents at the equator. Deep-Sea Research, 34, 1149-1161.
Murray, J. W., Johnson, E., & Garside, C. (1995). A U.S. JGOFS process study
in the equatorial Pacific (EqPac). Introduction. Deep-Sea Research I, 42, 275-293.
Philander, S. G. H., & Delecluse, P. (1983). Coastal currents in low latitudes
(with application to the Somali and El Niño currents). Deep-Sea Research,
30, 887-902.
Philander, S. G. H., Hurlin, W. J., & Seigel, A. D. (1987). Simulation of
the seasonal cycle of the tropical Pacific Ocean. Journal of Physical Oceanography,
17, 1986-2002.
Philander, S. G. H., & Pacanowski, R. C. (1980). The generation of equatorial
currents. Journal of Geophysical Research, 91, 14207-14211.
Picaut, J., & Delcroix, T. (1995). Equatorial wave sequence associated with
warm pool displacements during the 1986-1989 El Niño- La Niña. Journal
of Geophysical Research, 100, 18393-18408.
Picaut, J., Hayes, S. P., & McPhaden, M. J. (1989). Use of the geostrophic
approximation to estimate time-varying zonal currents at the equator. Journal
of Geophysical Research, 94, 3228-3236. Picaut, J., Ioualalen, M., Menkes,
C., Delcroix, T., & McPhaden, M. J. (1996). Mechanism of the zonal displacements
of the Pacific warm pool: implications for ENSO. Science, 274, 1486-1489.
Picaut, J., & Tournier, R. (1991). Monitoring the 1979-1985 equatorial Pacific
current transports with expendable bathythermograph data. Journal of Geophysical
Research, 96, 3263-3277.
Reid, J. L. (1959). Evidence of a south equatorial countercurrent in the Pacific. Nature,
184, 209-211.
Reid, J. L. (1961). On the geostrophic flow at the surface of the Pacific
Ocean with respect to the 1000-db surface. Tellus, 13, 489-502.
Reverdin, G., Frankignoul, C., Kestenare, E., & McPhaden, M. J. (1994). Seasonal
variability in the surface currents of the equatorial Pacific. Journal of
Geophysical Research, 99, 20323-20344.
Rowe, G. D., Firing, E., & Johnson, G. C. (2000). Pacific equatorial subsurface
countercurrent velocity, transport, and potential vorticity. Journal of
Physical Oceanography, 30, 1172-1187.
Taft, B. A., & Kessler, W. S. (1991). Variations of zonal currents in the
central tropical Pacific during 1970 to 1987. Sea level and dynamic height
measurements. Journal of Geophysical Research, 96, 12599-12618.
Tsuchiya, M. (1975). Subsurface countercurrents in the eastern equatorial
Pacific Ocean. Journal of Marine Research, 33, 145-175.
Tsuchiya, M., Lukas, R., Fine, R. A., Firing, E., & Lindstrom, E. (1989).
Source waters of the Pacific equatorial undercurrent. Progress in Oceanography,
23, 101-147.
Vintzileos, A., Delecluse, P., & Sadourny, R. (1999). On the mechanisms in
a tropical ocean-global atmosphere coupled general circulation model. Part
I: mean state and the seasonal cycle. Climate Dynamics, 15, 43-62.
Wacogne, S. (1990). On the difference in strength between the Atlantic and
Pacific undercurrents. Journal of Physical Oceanography, 20, 792-799.
Webster, P. J., & Lukas, R. (1992). TOGA-COARE: the coupled ocean-atmosphere
response experiment. Bulletin of the American Meteorological Society, 73, 1377-1416.
Wyrtki, K. (1974a). Sea level and the seasonal fluctuations of the equatorial
currents in the western Pacific Ocean. Journal of Physical Oceanography,
4, 91-103.
Wyrtki, K. (1974b). Equatorial currents in the Pacific 1950 to 1970 and their
relation to the trade winds. Journal of Physical Oceanography, 4, 372-380.
Wyrtki, K., & Kilonsky, B. (1984). Mean water and current structure during
the Hawaii-to-Tahiti shuttle experiment. Journal of Physical Oceanography,
14, 242-254.
Yu, X., & McPhaden, M. J. (1999). Seasonal variability in the equatorial Pacific. Journal
of Physical Oceanography, 29, 925-947.
Return to Abstract
PMEL Outstanding Papers
PMEL Publications Search
PMEL Homepage