U.S. Dept. of Commerce / NOAA / OAR / PMEL / Publications
Ocean Model Studies of Upper-Ocean Variability at 0°N, 160°W during the 1982–1983
ENSO: Local and Remotely Forced Response
D.E. Harrison
NOAA, Pacific Marine Environmental Laboratory, 7600 Sand Point Way NE, Seattle, WA
98115
A.P. Craig
School of Oceanography, University of Washington, Seattle, WA 98195
Journal of Physical Oceanography, 23(3), 426-451 (1993)
Copyright ©1993 American Meteorological Society. Further electronic distribution is not
allowed.
ABSTRACT
A hindcast of the 1982-1983 ENSO event using a primitive equation ocean circulation
model forced by monthly mean wind stresses based on the SADLER pseudostress fields shows
very good agreement with observations at 0°, 159°W between June 1982 and March 1983. The
hindcast experiment is analyzed to explore the processes that caused the large
accelerations, decelerations, and thermal changes observed during this time. Several
hindcast experiments incorporating variations of the SADLER wind field and several
idealized experiments incorporating a western Pacific westerly wind event are analyzed and
compared with the 1982-1983 SADLER hindcast to explore the importance of local and remote
forcing, the relative importance of zonal and meridional wind stress changes, and the
dynamical signatures of the processes at work. Meridional wind stress changes have little
effect on either the zonal velocity or temperature fields. Local zonal wind stress
variations can account for the qualitative changes in the upper-ocean zonal flow, but
cannot reproduce the observed thermal changes or the timing and quantitative evolution of
the zonal flow. Remote forcing is needed to account for these latter aspects of the
observations. Eastward-propagating Kelvin response appears to be quite important, but
westward-propagating Rossby variance forced during 1982 from east of 160°W does not
appear to play any significant role. The idealized remote-forcing experiments indicate
that westerly events can account for the variability not explained by local forcing; the
essential aspect is how the forcing projects onto the vertical modes defined by the
stratification under the forcing at the time of the wind event. Modes higher than the
first and second can be strongly forced and the sum over modes produces vertical
structures in the near field of the forcing similar to those observed. Simple linear
Kelvin mode ideas thus are useful for understanding the response to remotely forced
variability. However, nonlinear processes affect the quantitative response, both by
changing the stratification under the forcing region as the forcing event proceeds (and
thereby altering the modal projection of the forcing) and through zonal advection and
interaction between the response and the background mean flow. The dynamical balance of
terms for zonal momentum in the SADLER hindcast is quite complex and the difficulty of
identifying remote forcing from the balance of terms, even during periods when remote
forcing is the primary agent of change, is discussed. This detailed study of a
particularly interesting period of equatorial flow and thermal variability illustrates the
many processes at work on the equator in the central Pacific during periods of substantial
local and remote wind stress variability. It also illustrates some of the challenges that
might be encountered in interpreting the results of an oceanic local dynamics experiment
under conditions like these.
1. Introduction
The upper-ocean profiles taken near 160°W in 1982-83 (Firing et al. 1983) reveal
some of the most dramatic equatorial current changes ever observed in the central
Pacific. The equatorial undercurrent (EUC) and near-surface South Equatorial
Current each underwent periods of rapid acceleration and deceleration. Flow
at the normal depth of the EUC core reversed direction and became westerly for
a period of more than a month. The normally westward near-surface current became,
for about two months, a surface-trapped eastward-flowing jet with a maximum
speed in excess of 1 m s . Unusually large
displacements of the thermocline and changes in stratification were also observed.
Although no time series of multiyear duration are available for this site, mooring
data from 140°W suggest that subsurface behavior during a non-ENSO period would
involve only modest variations from time-mean conditions (McPhaden
and Hayes 1991).
. Unusually large
displacements of the thermocline and changes in stratification were also observed.
Although no time series of multiyear duration are available for this site, mooring
data from 140°W suggest that subsurface behavior during a non-ENSO period would
involve only modest variations from time-mean conditions (McPhaden
and Hayes 1991).
Firing
et al. (1983) offered a qualitative description of processes that could
lead to the observed behavior, based on the surface wind stress fields produced
by Jim Sadler and his coworkers at the University of Hawaii. They found it plausible
to attribute a significant amount of the behavior to the remote forcing of Kelvin
wave pulses by zonal wind fluctuations west of the region. McCreary
and Lukas (1986) offered the hypothesis that resonantly forced Kelvin waves
could account for the unusual vertical structure of the near-surface zonal velocity
changes during the undercurrent deceleration phase. In a different analysis,
Philander
and Seigel (1985) used a multilevel primitive equation ocean circulation
model forced by a monthly mean wind stress field based on the National Meteorological
Center (NMC) operational analysis to carry out a hindcast of the 1982-83 ENSO.
They note that the results from the model reproduce some aspects of the observed
behavior, and suggest that the behavior of the ocean prior to November 1982
was likely a near-equilibrium response to their slowly varying wind field, followed
by a Kelvin-type response to the abrupt return of easterlies west of the date
line in November-December 1982. They do not attempt to explore the behavior
at 160°W in any detail. Other studies of the generalized ENSO phenomenon, rather
than of 1982-83 specifically, using simple coupled models, suggest that both
eastward-propagating Kelvin waves and westward-propagating Rossby waves are
central parts of the ENSO cycle (e.g.,
Battisti and Hirst 1988; Schopf
and Suarez 1989).
Harrison
et al. (1989) carried out hindcasts similar to that of Philander
and Seigel (1985), using five different analyses of the monthly mean surface
wind stress field. The different wind stress fields were qualitatively similar
but had large quantitative differences and many differences in detail. These
differences were sufficient to produce a variety of oceanic responses in the
various hindcasts. Harrison
et al. (1990) described the SST evolution and the processes controlling
SST variation in these hindcasts and found that the warming and cooling patterns
of the different hindcasts often resulted from a range of different processes.
The only common elements were that the equatorial midocean warmed in mid-1982
primarily due to increased zonal advection and that the equatorial midocean
cooled in late spring 1983 with the return of surface easterlies that resulted
in upwelling and advection of cool water.
A comparison of the five hindcasts at 0°, 160°W with the observed data of Firing
shows that the hindcast that used the SADLER wind stress field (referred to
as SADLER hereafter) reproduces the observed currents and temperatures during
the period from July 1982 through March 1983 well. No other hindcast reproduces
so much of the observed timing and amplitude of the oceanic fluctuations. With
this in mind, the SADLER hindcast experiment will be analyzed in this paper
to investigate possible scenarios for the variability and the dynamics underlying
this variability of the equatorial Pacific at 160°W during the 1982-83 El Nińo.
Other related experiments will also be analyzed to investigate the importance
of local versus remote forcing and zonal versus meridional forcing. In the next
section, the observations from Firing
et al. (1983) at 0°N, 159°W and the results from the SADLER hindcast experiment
are compared. Section 3 discusses the importance of local forcing in the SADLER
hindcast, and section 4 discusses the importance of remote forcing. A brief
discussion of the balance of terms in the zonal momentum and heat equations
for some of the various experiments is presented in section 5. Section 6 offers
some summary and discussion of our findings.
2. Comparison of observations at 0°N, 160°W and SADLER hindcast results
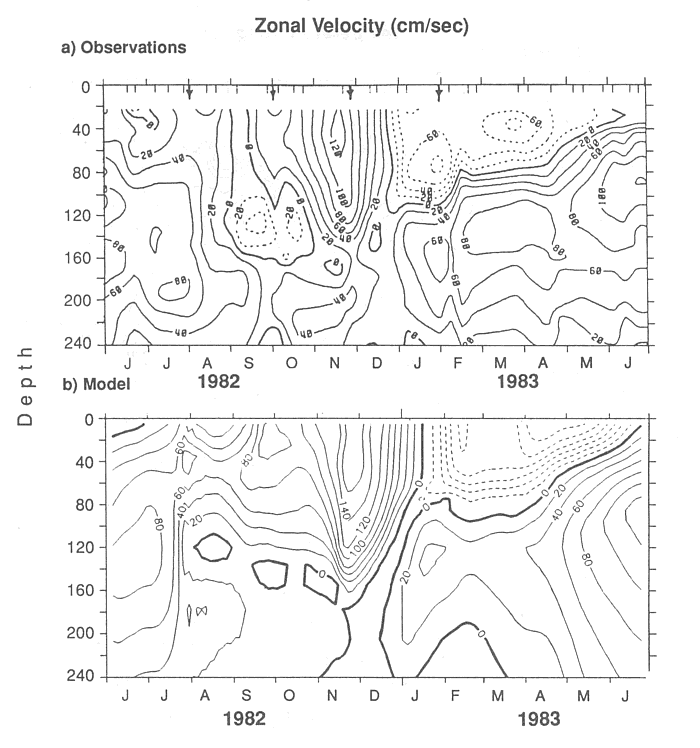
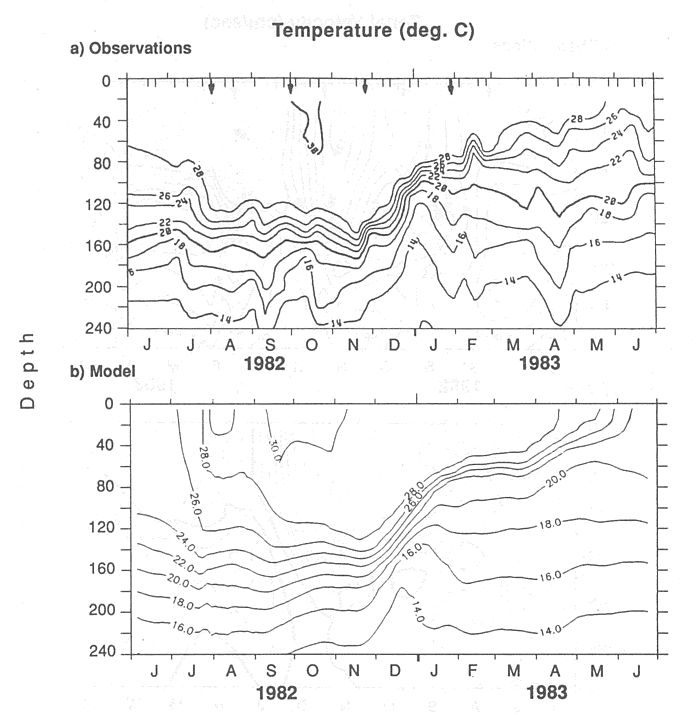
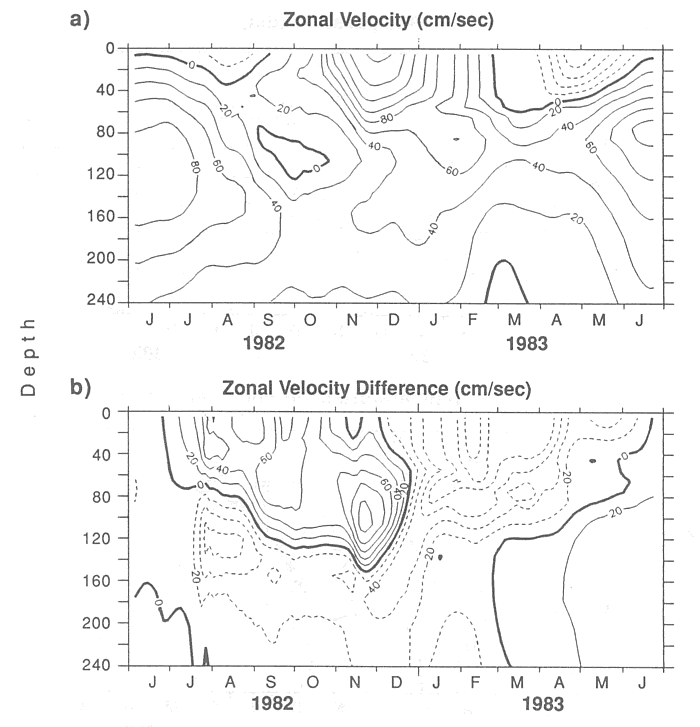
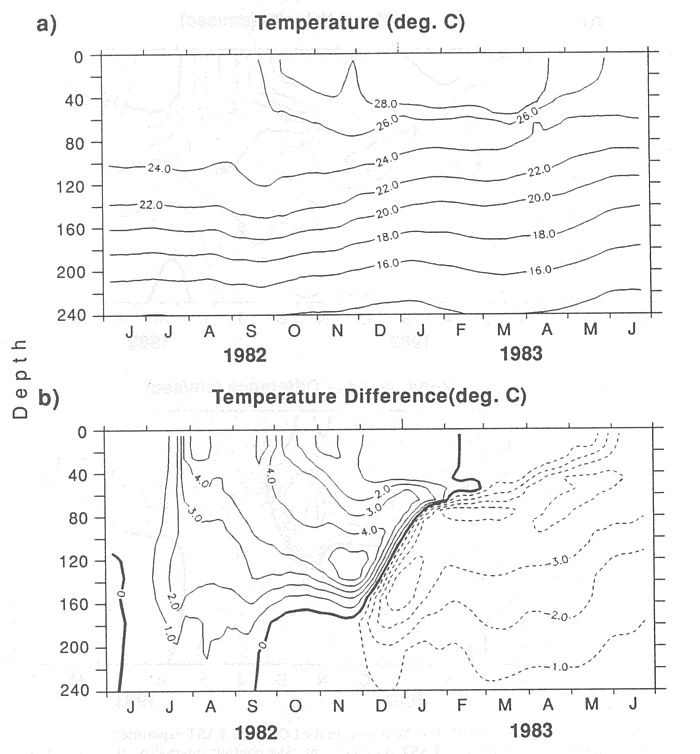
Figures 1a and 2a
present the depth-time plots of zonal current and temperature from Firing
et al. (1983). The interval between July 1982 and March 1983 will be focused
upon because the currents went through the largest variations during this time.
From mid-June 1982 to mid-September 1982, the core of the EUC decelerates from
over 80 cm s maximum speed eastward to westward
flow at about 120-m depth. From mid-October 1982 to mid-November 1982, eastward
acceleration of the surface flow forms a strong surface-trapped jet with weak
westward flow just beneath it. From mid-November 1982 to mid-January 1983, the
eastward surface jet decelerates rapidly and the surface flow becomes westward
while the deep flow accelerates eastward late in this period. By mid-February,
the EUC has returned. During the spring, the EUC shallows slightly and surface
flow returns to more normal conditions.
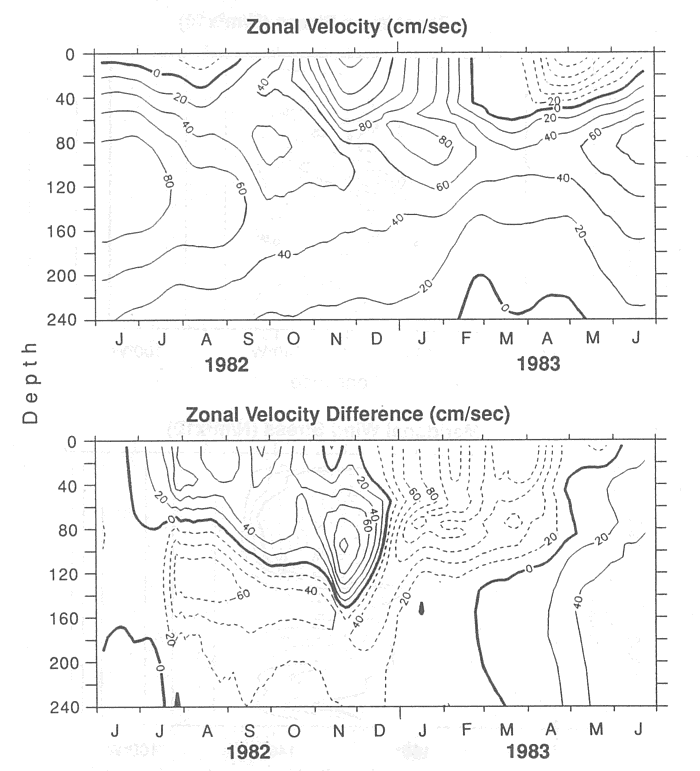
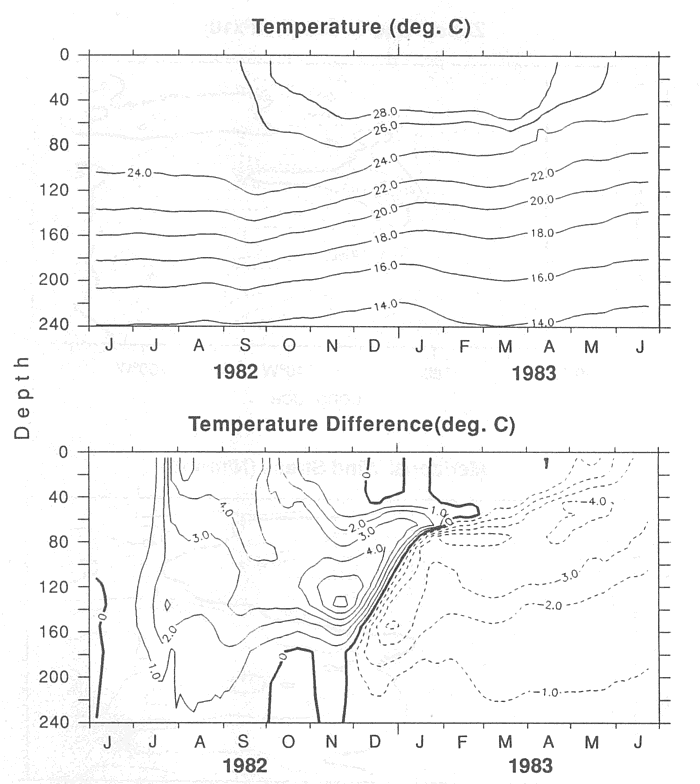
Figure 1. Zonal velocity during 1982-1983. (a) profiles from Firing et al.
(1983) at (0°, 159°W), (b) results from the model using the SADLER wind stress
field (Harrison
et al. 1989) at 0°N, 160°W. The contour interval is 20 cm s
in both plots.
Figure 2. As for Fig. 1, except for temperature. The contour interval is 2°C.
There is also interesting thermal evolution (Fig. 2a)
during the same period. In July, there is rapid warming throughout the water column. From
August 1982 to November 1982, there is weak warming above 160 m. Water warmer than 30°
appears above 70 m in October. From late November 1982 through January 1983, there is
shoaling and intensification of the thermocline. During this period the thermocline is
very sharp and the 28° and 18°C isotherms are separated by only about 30 m. In January
there is rapid warming of water colder than 18°C. From February 1983 through spring 1983,
the thermocline gradient weakens dramatically as isotherms greater than 22°C continue to
rise while isotherms less than 22°C deepen.
Figures 1b and 2b
present the corresponding fields from the SADLER hindcast experiment. The hindcast
reproduces all of the major features of the observational data, with scales
of variability close to those observed. The largest discrepancies are in the
delayed return of the EUC in 1983 in the hindcast, and the differences in the
near-surface temperatures before July 1982 and after April 1983. Otherwise,
these timing discrepancies are typically smaller than one month, which is the
resolution of the imposed monthly mean wind stress field of the hindcast. This
is at least as successful a longterm simulation of observations as any known
to the authors; the hindcast has quantitative skill, in the sense discussed
by Harrison
et al. (1989), between July 1982 and January 1983.
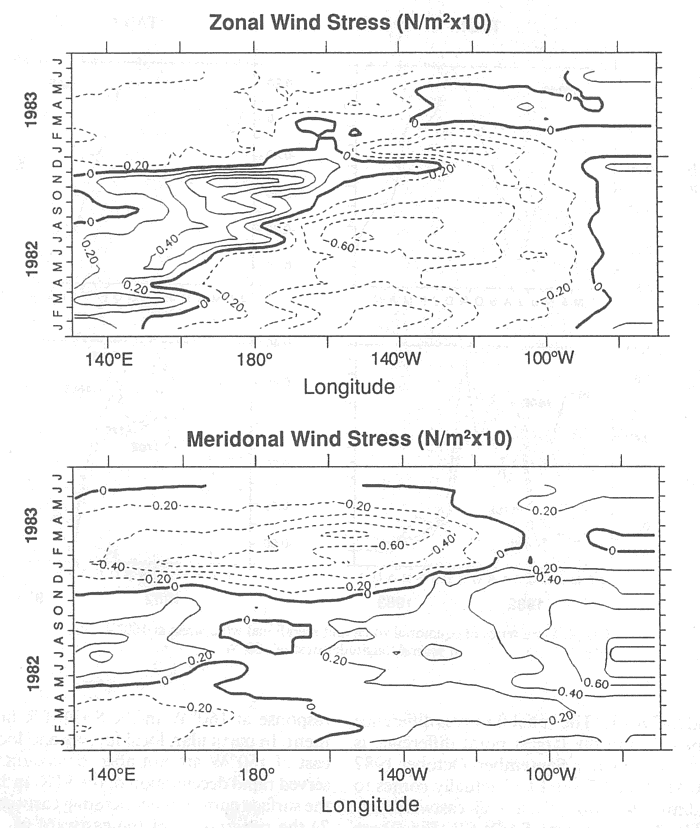
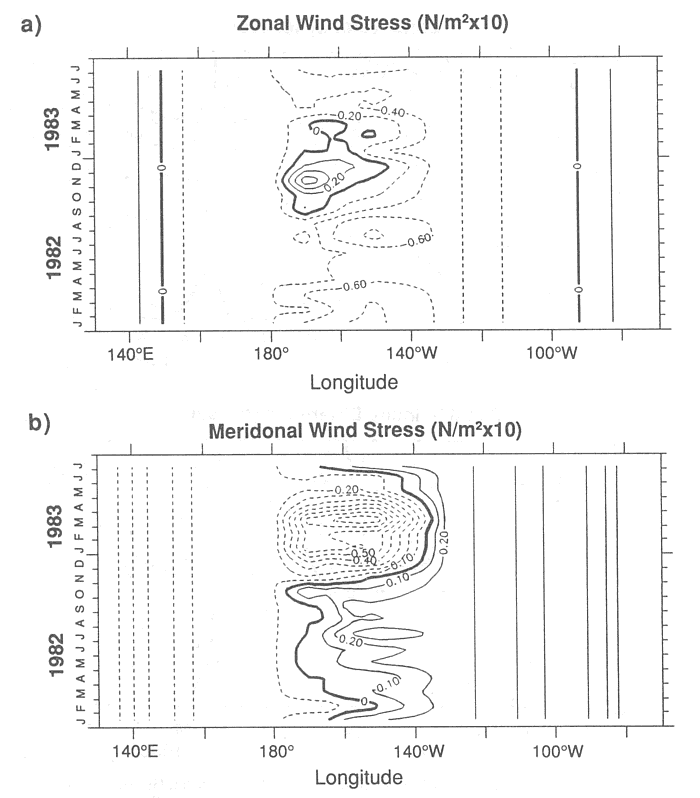
Figure 3 presents the equatorial zonal and meridional
wind stress fields for the SADLER hindcast experiment as a function of longitude
and time. These wind stress fields were calculated by multiplying the SADLER
pseudostress results by a drag coefficient of 1.2 × 10 and air density of 1.2 × 10 gm cm
(Harrison
et al. 1989). This C
and air density of 1.2 × 10 gm cm
(Harrison
et al. 1989). This C value is consistent with the values of Large
and Pond (1981) for the windspeed range of this area over this period. Climatologically
there are easterlies across the region between 160°W and 160°E throughout the
seasonal cycle (see Harrison
et al. 1989 for more comparison between the 1982-83 stresses and the climatological
stresses), so that the westerlies and weak easterlies found during 1982 are
strongly anomalous, as are the strong meridional winds in late 1982 through
early 1983.
value is consistent with the values of Large
and Pond (1981) for the windspeed range of this area over this period. Climatologically
there are easterlies across the region between 160°W and 160°E throughout the
seasonal cycle (see Harrison
et al. 1989 for more comparison between the 1982-83 stresses and the climatological
stresses), so that the westerlies and weak easterlies found during 1982 are
strongly anomalous, as are the strong meridional winds in late 1982 through
early 1983.
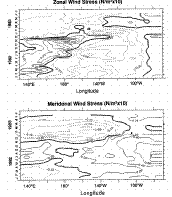
Figure 3. SADLER analysis of the monthly mean zonal and meridional wind stress along
the equator, 1982-1983. The contour interval is 0.02 N m in both plots.
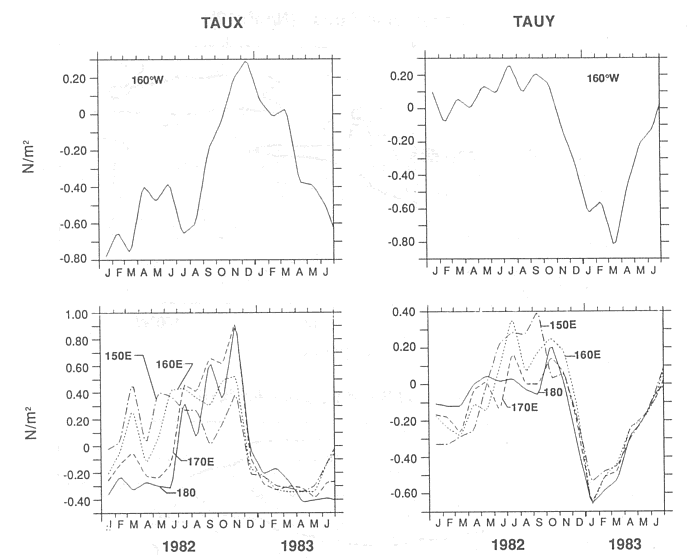
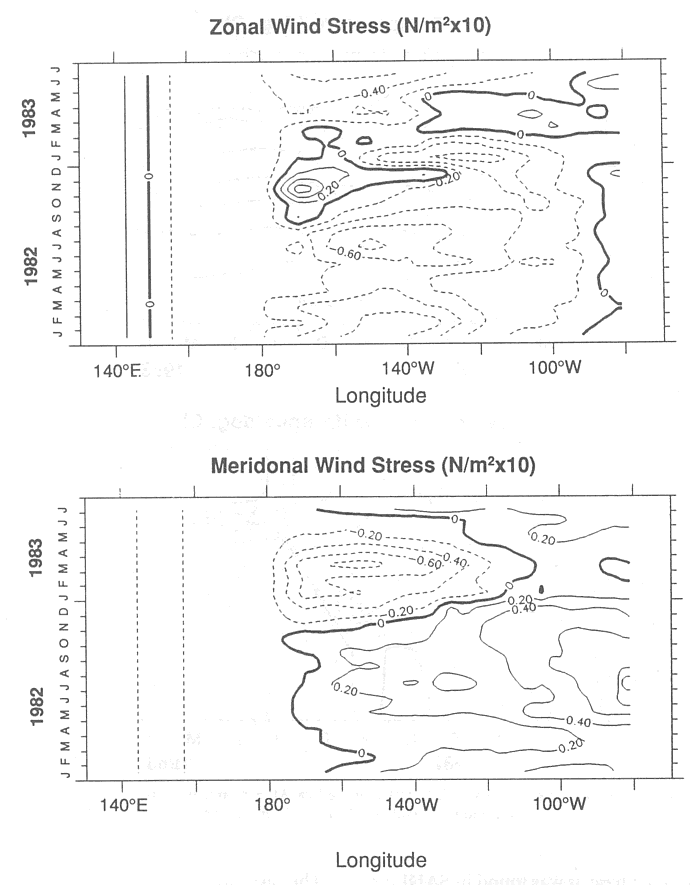
Figure 4 presents time series of zonal and meridional
stress at 160°W as well as at several longitudes west of 160°W. With the short
periods of enhanced westerly wind west of the date line and the abrupt termination
of the period of westerlies in December 1982, linear theory predicts that Kelvin
pulses will be generated and then propagate eastward away from the region of
westerly winds. Eastward propagation of the zonal stress forcing occurs during
some periods; this can affect the rate at which remote response occurs (Harrison
and Schopf 1984) or lead to resonant Kelvin forcing (McCreary
and Lukas 1986). A number of papers have discussed the elements of the physics
of forced Kelvin pulses (see, e.g., Giese
and Harrison 1990). At the observation site (0°, 160°W) there is also substantial
local wind forcing, however, so the behavior there will likely also depend on
the local forcing. In the next section, we examine how much of the response
is produced by local forcing.
Figure 4. Time series of equatorial zonal and meridional wind stress at 160°W and at
several longitudes west of 160°W.
3. Local forcing
The effect of local forcing is examined via a model experiment (LOCAL hereafter) that
is identical to the SADLER hindcast experiment in every way except the wind forcing is
restricted to the vicinity of 160°W as follows: the stresses west of 180° and east of
130°W are maintained at their January 1982 values throughout the two-year period; between
170°W and 180° and between 150°W and 130°W, a linear interpolation was carried out.
This wind stress field is shown in Fig. 5. The zonal winds
at 160°W (see Fig. 4) in the LOCAL experiment are
substantial easterlies until September 1982. They begin decreasing in August and become
westerly in late October 1982, reaching their maximum westerly value in December. They
increase to weak easterlies in January 1983 and return to something near their
climatological easterly value in April 1983. At 170°W, the LOCAL wind field also has a
relatively strong period of westerly wind stress from October 1982 to December 1982. The
meridional wind stress is weakly southerly before November 1982, becomes northerly in
November, and increases to a substantial northerly value by January 1983. A steady
decrease begins in May 1983 and continues until there is little meridional stress by May.
Figure 5. Monthly mean zonal and meridional wind stress along the equator, 1982-1983
for the LOCAL experiment. The contour interval is 0.02 N m and 0.01 N m,
respectively.
Figures 6 and 7
show the zonal velocity and temperature results from LOCAL and the difference
(SADLER minus LOCAL) on the same scales as Figs.
1 and 2. A striking aspect of Fig.
6a is that many aspects of the oceanic response between June 1982 and March
1983 from Fig. 1 are present: the EUC decelerates
(although much less rapidly than before) in the fall of 1982; there is significant
near-surface acceleration in November and December 1982; somewhat weaker near-surface
deceleration occurs during the first few months of 1983; and then conditions
start returning toward a more normal state during the spring of 1983. Although
there are quantitative differences almost as large as the observed current changes
themselves (Fig. 6), so that the LOCAL hindcast
has at best "marginal skill" in zonal velocity in the sense discussed
by Harrison
et al. (1989), the qualitative behavior of the zonal velocity changes can
be accounted for by the local wind stress changes. Figure
7 shows that the same statement cannot be made for the temperature field.
In LOCAL, the deepening and intensification of the thermocline and its abrupt
shoaling are greatly reduced compared with SADLER. Point differences exceed
4°C, both warm and cold; the LOCAL hindcast has "no skill" in temperature
in the sense discussed by Harrison
et al. (1989).
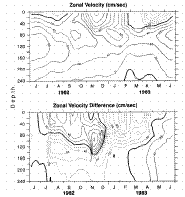
Figure 6. Zonal velocity at (0°, 160°W) (a) from the LOCAL experiment, (b) the
difference (SADLER - LOCAL). The contour interval is 20 cm s in both plots.
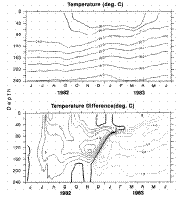
Figure 7. Temperature at (0°, 160°W) for the LOCAL experiment, as for Fig. 6. The contour interval is 2° and 1°C, respectively.
Two additional local experiments were carried out (LOCAL + EAST, LOCAL + EAST-TAUY).
Again, the only changes from the SADLER and LOCAL experiments are modifications to the
wind field. In the LOCAL + EAST experiment, the stresses west of 170°W are as in LOCAL,
and the SADLER stresses are used everywhere east of 170°W. Comparison of this experiment
with LOCAL will let us explore the importance of remote forcing from the east (i.e.,
propagation of forced Rossby waves). In the LOCAL + EAST-TAUY experiment, the zonal stress
is identical to that in LOCAL + EAST, but the meridional stress is zero everywhere. This
experiment will offer some perspective on the importance of meridional wind stress forcing
at and east of 160°W, but does not address the role of remote meridional wind forcing
west of the date line. The LOCAL + EAST winds are shown in Fig.
8.
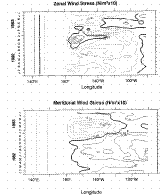
Figure 8. Monthly mean zonal and meridional wind stress along the equator, 1982-1983
for the LOCAL + EAST experiment. The contour interval is 0.02 N m in both plots.
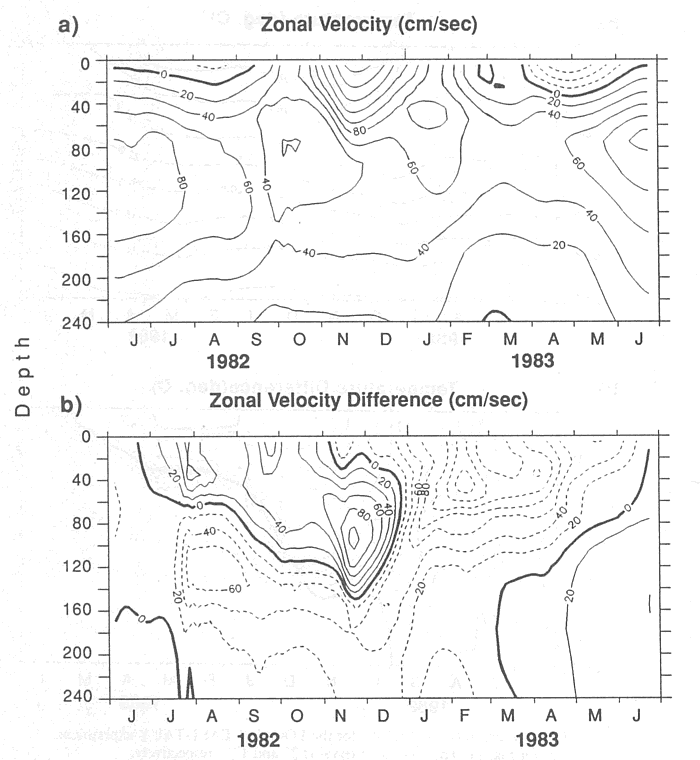
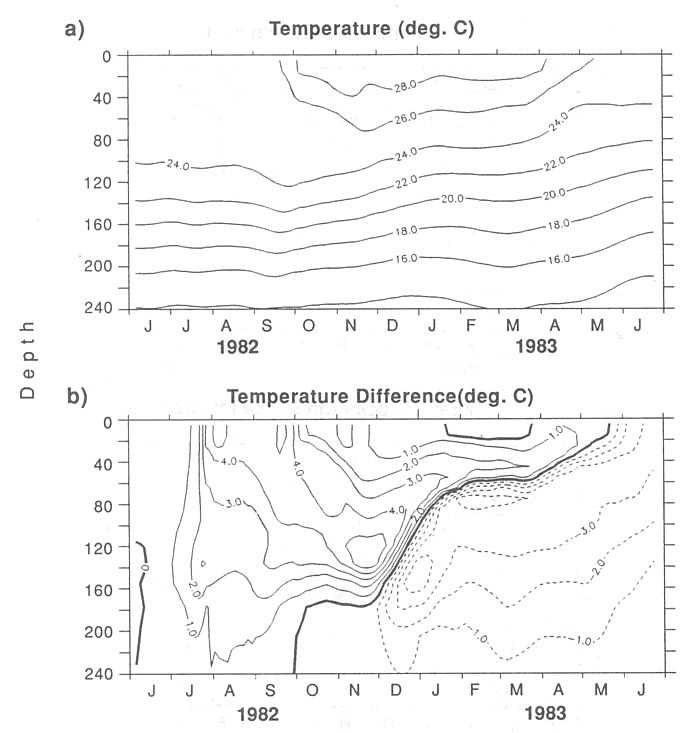
Zonal velocity and temperature time series for LOCAL + EAST are shown in Figs. 9 and 10. The differences
between these results and the LOCAL results (Figs. 6 and 7) are not large, particularly when compared with the
differences between either of these experiments and SADLER. The zonal flow rms difference
is about 5 cm s, and the largest point difference is
about 40 cm s at 100 m in September-October 1982 when
in LOCAL + EAST the EUC actually comes to rest, while it diminishes simply to a weak
eastward flow in LOCAL. The differences with SADLER (Fig. 9)
are very similar to those of Fig. 6.
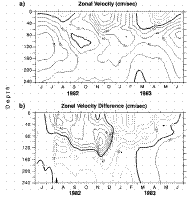
Figure 9. Zonal velocity at (0°, 160°W) (a) from the LOCAL + EAST experiment, (b) the
difference [SADLER - (LOCAL + EAST)] experiment. The contour interval is 20 cm s in both plots.
Figure 10. Temperature at (0°, 160°W) for the LOCAL and EAST experiment as for Fig. 9. The contour interval is 2° and 1°C, respectively.
Zonal velocity and temperature time series for LOCAL + EAST-TAUY, and for the
differences [SADLER - (LOCAL + EAST-TAUY)] are shown in Figs.
11 and 12. The most significant difference is again in
the deceleration of the EUC in September and October 1982. In LOCAL + EAST-TAUY, the EUC
does not come to rest as it does in LOCAL + EAST. It maintains a flow of about 20 cm s, similar in form to that of the LOCAL experiment. The
thermal changes and other zonal current changes are almost the same as those in LOCAL +
EAST. Evidently, meridional wind stress changes east of the date line play little role in
forcing the variability at (0°, 160°W) during this period.
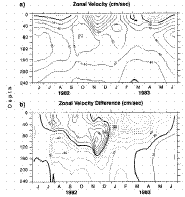
Figure 11. Zonal velocity at (0°, 160°W) (a) from the LOCAL + EAST-TAUY experiment,
(b) the difference [SADLER - (LOCAL + EAST-TAUY)]. The contour interval is 20 cm s in both plots.
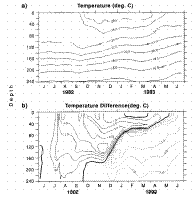
Figure 12. Temperature at (0°, 160°W) for the LOCAL + EAST-TAUY experiment as for Fig. 11. The contour interval is 2° and 1°C, respectively.
4. Remote forcing
The local experiments suggest that remote forcing west of 170°W plays a significant
role in the equatorial response at 160°W in the SADLER hindcast experiment.
In particular, local forcing and local plus forcing east of 160°W are not able
to account for 1) the observed rapid deceleration of the EUC in July 1982 while
the surface current is accelerating eastward more gently; 2) the penetration
of the eastward surface jet during November 1982 and its rapid deceleration
during December 1982; 3) the sharp warming between the surface and the thermocline
in July 1982; 4) the shallowing and intensification of the thermocline during
December 1982; and 5) the lower thermocline spreading during January 1983. In
this section, results from several idealized westerly wind burst forcing experiments
are presented to gain a better understanding of the model central Pacific response
to such forcing. While other types of westerly variability occur, and are present
in 1982, westerly wind bursts are a prominent aspect of west Pacific variability
during ENSO periods (e.g., Luther
et al. 1983; Harrison
and Giese 1991). Both nearly linear and nonlinear model experiments will
be considered. Idealized forcing is used because the actual wind variability
west of 170°W during 1982 is quite complicated (Figs.
3, 4), and we were not able to devise a straightforward
way to isolate particular periods of 1982 while maintaining the preexisting
oceanic structure until the forcing period. We shall examine how much the initial
state of the ocean under the forcing region and the conditions that prevail
east of the forcing affect the central Pacific response.
a. Idealized westerly forced experiments
According to linear wave theory for a horizontally uniform, initially resting fluid
with an exponential density profile in the vertical, the first several Kelvin wave modes
all have the same sign of zonal velocity amplitude above the thermocline. Furthermore, the
response to westerly wind events from these modes is a pulse of eastward acceleration
above the thermocline and a deepening of the thermocline. Conversely, easterly wind events
cause a zonal flow deceleration and shallowing of the thermocline from the lowest modes.
Thus, far enough from the forcing region that the different vertical modes have separated
due to their different eastward phase speeds, one expects to see a series of zonal surges
and slowings as a function of depth in response to a single wind event that includes a
wind extremum followed by a return to prevailing conditions. A wind change in which the
wind simply decreases or increases will lead to the first part of the behavior induced by
a pulselike event.
Giese
and Harrison (1990) show model results for a 0.02 N m
wind burst on an exponentially stratified, resting ocean (their experiment B24,
which we shall denote WBex0.02, for westerly burst/exponential stratification/0.02/stress).
The idealized westerly wind event is Gaussian in time with half-amplitude points
ten days apart, Gaussian in latitude about the equator with half-amplitude points
3 degrees apart, and is uniform between 150°E and 170°E. The wind field is shown
in Fig. 13. Giese
and Harrison (1990) found that the far-field model results from this case
agree well with linear theory. Kelvin modes propagate away from the forcing
region at speeds consistent with linear theory, and the amplitudes of the wave
perturbation as a function of depth agree with the theorized structure of the
various baroclinic modes. They also noted that while modes 3 through 6 are strongly
forced for zonal velocity, their sea level signal is small. We are interested
in the equatorial central Pacific response.
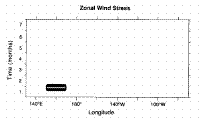
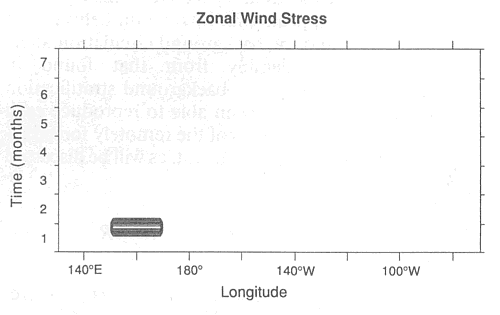
Figure 13. Zonal wind stress along the equator for the WBex0.02 experiment (0.02
N m wind burst). Meridional wind stress is identically
zero for the same period. The vertical axis is months.
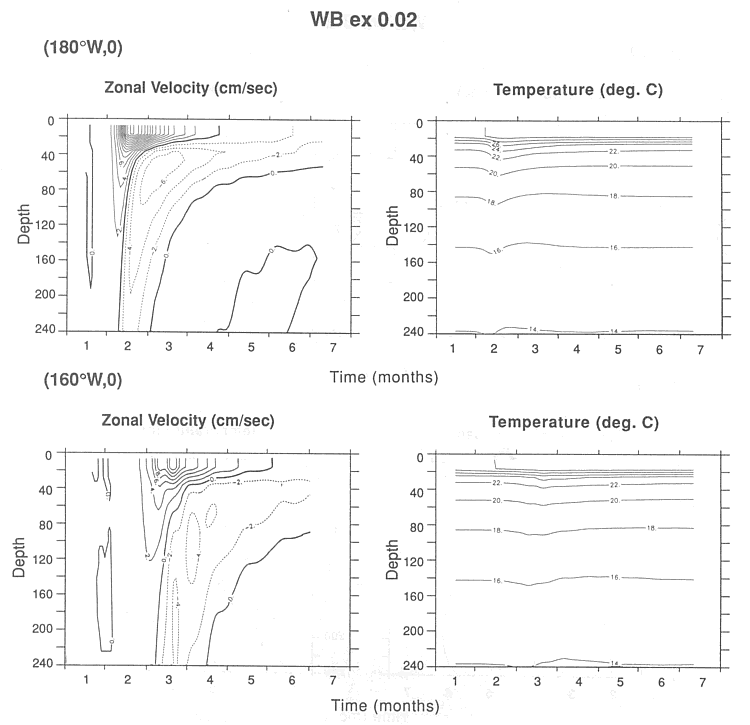
The WBex0.02 zonal velocity and temperature time series at 160°W and
180°, 30°, and 10°, respectively, east of the forcing, are shown in Fig.
14. Recall from Fig. 13 that the forcing
event begins early in month 1 and ends early in month 2. At 180° the zero crossing
of the total zonal velocity perturbation rises to thermocline depth by the middle
of month 2. It is not useful to try to identify particular modes, as most of
the Kelvin modes have not separated. Linear theory says that the third and fourth
modes receive the strongest zonal velocity forcing, followed closely by the
fifth and the second modes; the first mode receives about one-third of the forcing
that the third mode receives (Giese
and Harrison 1990). The relationship between the zonal velocity perturbation
seen in Fig. 14 and the thermal structure is
simple; positive zonal velocity perturbations are associated with downwelling
and local warming while negative zonal velocity perturbations are associated
with upwelling and local cooling.
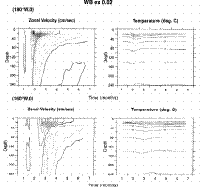
Figure 14. Zonal velocity and temperature at (0°, 160°W) and (0°, 180°) for WBex0.02
(0.02 N m burst over a resting ocean with exponential
density profile in depth). The contour intervals are 2 cm s and 2°C, respectively.
As predicted, vertical modes higher than the second play an important role and lead to
westward flow at depths as shallow as 40 m in the first month following the forcing event.
Even from this linear perspective, forcing like this can lead to near-surface eastward
acceleration simultaneous with thermocline westward acceleration, as was found in SADLER
in July 1982; however, the vertical structure of the thermal changes shows no significant
intensification of stratification during the shallowing phase as was found in SADLER
during December 1982-January 1983. At 160°W the lowest modes are slightly better
separated than at the date line, but the overall pattern of response is similar, just
stretched out some in time; westward subsurface flow begins in the thermocline about the
middle of month 3. We next consider the effects of more realistic forcing amplitude,
vertical density stratification and background circulation.
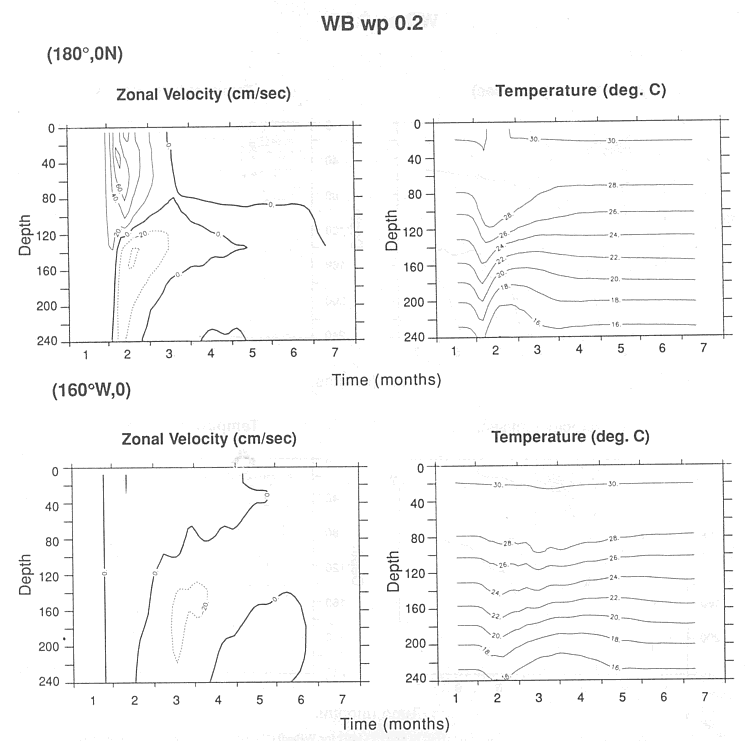
In the next experiment (WBwp0.2), a 0.2 N m
version of the same westerly wind event as used in WBex0.02 is introduced
over a resting ocean in which the stratification is typical of 160°E. In the
third experiment (WBcl0.2), a similar wind event is superimposed on a
climatological annual mean wind stress field that has already been used to spin
up the ocean to its mean circulation. These experiments are described in detail
and correspond, respectively, to B32 and B34 in Giese
and Harrison (1990).
The eastward phase speeds of the low vertical modes in WBwp0.2 are not
far from linear predictions, based on far-field arrival times (Giese
and Harrison 1990), and are substantially faster than for the WBex0.02
case. The zero crossings for zonal velocity are substantially deeper, and the
zonal velocity forcing of the low vertical modes is quite different than in
WBex0.02. These differences result entirely because of the stratification
change. Now the strongest forcing is of the first mode, followed by the second,
fourth, and then third mode. The third mode receives about half the forcing
of the first mode. This simple calculation serves as a reminder of the well-known
importance of stratification on the vertical structure and response of forced
Kelvin motions (e.g.,
Busalacchi and Cane 1988; Cane
and Sarachik 1976).
Figure 15 presents time series of temperature and zonal
velocity at 160°W and 180°, respectively, for WBwp0.2. Note that the contour
interval for zonal velocity has been changed from 2 cm s to 20 cm s, to reflect
the tenfold increase in wind stress forcing. At 160°W the largest velocity change is
westerly flow in the thermocline between the middle of months 3 and 4. The velocities are
less than ten times those seen in WBex0.02, but the pattern is similar in form
after allowing for the deeper zero crossings and faster phase speeds of WBwp0.2;
the forcing projection onto the different vertical modes accounts for most of this
difference. This example illustrates that stratification plays a significant role in the
magnitude of the forced response as well as its vertical structure. The temperature field
is generally depressed initially and shoals later, but the character of the changes
depends significantly on the depth of interest; there is little near-surface displacement.
At depth, rapid warming occurs, followed by significant cooling, and then warming again as
more normal temperatures return. During the shoaling phase a modest increase occurs in
thermocline stratification.
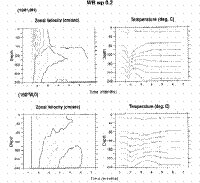
Figure 15. Zonal velocity and temperature at (0°, 160°W) and (0°, 180°) for WBwp0.2
(0.2 N m burst over a resting ocean with density
profile typical of 160°E). The contour intervals are 20 cm s and 2°C, respectively.
At 180° there is substantial positive zonal velocity perturbation, initially between
the surface and about 200 m; subsequently the zonal flow remains eastward down to about
100 m into month 3, and is westward below about 100 m until the end of month 2. The
largest zonal velocity change (100 cm s) occurs early
in month 2 at about 40-m depth; the maximum thermocline zonal flow change (40 cm s) occurs a little past the middle of month 2. The
temperature perturbations show rapid deepening early in month 2 followed by shoaling and
an increase in stratification between 28°C and the deepest temperature plotted (16°C)
until the end of month 2. In month 3 the midthermocline temperature (say 22°C) flattens
out while warmer isotherms shallow and cooler isotherms deepen.
At the date line a significant departure from linear Kelvin wave dynamics is
near the surface during month 2, when there is a near-surface eastward jet with
maximum flow of about 1 m s at 40 m. A surface
jet forms directly under the wind patch and its strong zonal currents carry
the jet eastward to 180° and strong associated downwelling forces the jet deeper
into the water column. In this case, the jet lasts a few weeks. Giese
and Harrison (1990) note other nonlinear aspects to the response to 0.2
N m forcing.
This experiment shows that remote forcing with a stronger wind event and over a more
realistic initial density profile can produce thermocline evolution much more similar to
that seen in SADLER than was found in the linear westerly event forcing experiment. The
distance from the forcing region has a considerable effect on the character of the
response, both in zonal flow and thermal evolution; the closer to the forcing, the more
aspects of the thermal structure changes resemble those seen in SADLER in July 1982.
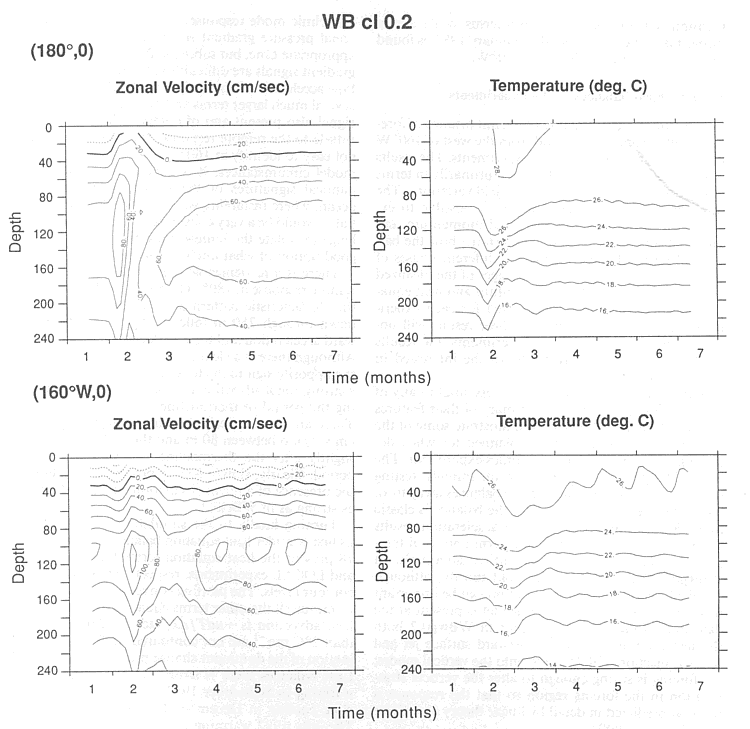
Results for WBcl0.2, in which the westerly event is superimposed on
an ocean spun up under climatological mean wind stress, are shown at 160°W and
180° in Fig. 16. The response at 160°W involves
acceleration of the undercurrent from about 100 cm s
to over 120 cm s, followed by a deceleration
to about 60 cm s between the middle of month
2 and early in month 3. Subsequent to month 3, the instability waves, which
are a part of the climatological flow in this experiment, dominate the zonal
flow changes. There is little near-surface zonal flow change, never more than
about 20 cm s. The thermocline deepens and
the near surface warms during month 2; then the thermocline shoals and the near
surface returns to its initial temperature during month 3. As in Harrison
and Giese (1988), the remotely forced response alters the phase of the instability
waves, so that subtracting out the climatological circulation does not greatly
simplify observing the remotely forced response; we know from the previous studies
that the period of maximum interest is months 2 and 3, during which clear variability
is evident.
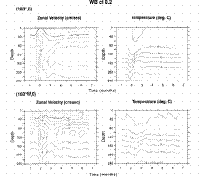
Figure 16. Zonal velocity and temperature at (0°, 160°W) and (0°, 180°) for WBcl0.2
(0.2 N m burst over an ocean forced to statistical
equilibrium to climatological annual mean wind stress, with a simple heat flux
parameterization). The contour intervals are 2 cm s
and 2°C, respectively.
At 180° the instability process is weaker, so that the remote response is more easily
seen than at 160°W. Early in month 2, the zonal velocity increases about 20 cm s from the surface to about 200 m and the thermocline
deepens. During the second half of month 2 a rapid zonal velocity deceleration occurs
initially in the thermocline (from almost 100 cm s to
40 cm s), as well as a shallowing of isotherms and
increase of stratification. During this phase the near-surface zonal velocity decrease is
much smaller, typically 20 cm s. About mid-month 2
there is rapid near-surface warming. At the end of month 2 and through month 3, the zonal
velocity increases eastward and conditions begin returning to normal.
The depth of the thermocline and thermocline stratification under the forcing in WBwp2.0
and WBcl2.0 are similar, yet some aspects of the remote response are quite
different. The undercurrent deceleration in WBcl2.0 is much greater; the zonal flow
change is larger and occurs more abruptly. The strong surface zonal flow response in WBwp2.0
is not present in WBcl0.2, yet WBcl0.2 has much larger near-surface
temperature change than WBwp0.2. Another difference between the two experiments is
the lack of a surface-trapped jet at 180° in WBcl2.0. Apparently the surface jet
under the forcing is not advected to 180° because there is sufficiently strong westward
surface flow in the climatological flow to offset the zonal advective tendency of the
equatorial jet. It appears that interaction between the forced response and the background
circulation alters the response considerably from that found in WBwp0.2, even
though the background stratification is similar. We have now been able to reproduce each
of the characteristic features of the remotely forced response in the SADLER experiment,
as will be discussed more thoroughly below.
b. Forcing west of 160°W in the SADLER experiment
Now we attempt to explain the elements of the remotely forced response at 160°W in the
SADLER experiment due to westward forcing. Recall the zonal velocity and thermal response
differences between the LOCAL experiment and the SADLER experiment. The zonal velocity
differences between SADLER and LOCAL show up as local difference extrema in Fig. 6; the major ones are late July through August 1982 at
120 m, mid-November through mid-December 1982 at about 100 m, and late January through
early February 1983 between the surface and about 80 m. The EUC decelerates faster and
sooner and the surface eastward jet penetrates deeper and decelerates faster in SADLER. Figure 7 shows the thermal differences in an equally clear
fashion; warming begins earlier in SADLER, and SADLER remains warmer than LOCAL from the
surface down into the thermocline until early December 1982 at 160 m and late January 1983
at the surface; the maximum temperature difference is about 6°C in November 1982 at 120
m. Thereafter, LOCAL is cooler than SADLER into mid-1983; differences between 2°C and
4°C are common in the upper thermocline. LOCAL does not have the rapid thermocline
shoaling and intensification of SADLER in November-December 1982. The 30° water at the
surface in October in the SADLER experiment is not present in the LOCAL experiment.
In order to begin to sort out the remote response, look again at the wind stress
changes. The largest remote zonal wind changes occur in the June-September 1982 and
November-December 1982 periods (Figs. 3 and 4). The mid-1982 remote zonal wind stress changes involve an
eastward-propagating westerly anomaly that begins near 150°E in April and appears farther
and farther east until about June 1982 when there is a westerly event at 170°E and 180°.
Between June and July the largest monthly westerly stress changes occur and are at 170°E
and 180°. The simplest approach to representing this variability would be as a westerly
event or as a one-sided westerly change in June-July near the date line. Late in 1982
there is a substantial westerly event in November-December at both 170°E and 180°; a
more modest event occurs at 160°E and 150°E. The zonal stress continues to strengthen
toward the east through December, and becomes weakly easterly by January 1983. Thus, from
the idealized perspective, there is a substantial westerly event immediately followed by a
one-sided (in time) return to easterly stress. The longitudinal extent of the late 1982
wind changes is the greatest of any during this event, so the integrated forcing is the
greatest.
From our idealized remote response experiments it is clear that westerly wind changes
west of 170°W can account qualitatively for the differences in zonal velocity and
temperature behavior in July-August 1982. There is nothing inconsistent with westerly
remotely forced Kelvin processes and the deceleration of the EUC as it occurred in SADLER;
reasonably near to the forcing region strongly forced higher vertical modes can provide
just this type of behavior (see WBwp0.2 and WBcl0.2). Further, the extra
thermocline zonal velocity acceleration in November 1982 and the thermocline uplifting and
intensification during December 1982-January 1983 are also possible from westerly remotely
forced Kelvin response (see WBcl0.2 particularly). The wind stress variability west
of 170°W in SADLER is sufficiently complex in space and time that it is not
straightforward to identify particular wind events with details of the response at 160°W
in SADLER, particularly given that the presence of higher vertical modal forcing means
that it can take two to three months for the response to propagate even 20° or 30° of
longitude east of the forcing region. Thus, at 160°W the ocean is responding not only to
forcing from, say, 160° or 170°E from about ten days to three months previous but also
to forcing from 180° from about a few days to two months previous and also to its local
forcing (especially for the September 1982-February 1983 period).
Two aspects of the wind field present themselves as likely candidates for forcing
the mid-July to August 1982 behavior: the near-date line westerly event in July
1982 and the eastward-propagating westerly event that began near 150°E in April
1982. We have not examined the consequences of eastward propagation of a westerly
event in our idealized studies; Harrison
and Schopf (1984) considered one aspect, and McCreary
and Lukas (1986) considered the possibility of resonant forcing from such
behavior. It seems plausible that both aspects of the wind field contribute
to the observed mid-July-August response, but it is worthy of note that resonant
forcing is not required in order to explain the observed zonal velocity vertical
structure.
Westerly remote forcing can also help account for the vertical penetration and
amplitude of the surface easterly jet in November 1982 and its rapid deceleration and
concomitant thermocline uplift and intensification in December 1982-January 1983. The
picture is necessarily less clear than during July-August 1982 because significant local
wind stress changes are playing a substantial role in the local response. Because the
thermocline is deep and there is little stratification above it during this part of 1982,
the WBcl2.0 experiment is most relevant. The thermocline eastward acceleration in
November 1982 followed by deceleration and thermocline uplift and intensification are
characteristic of the early response at 180° in WBcl2.0. Continued rising of
warmer isotherms while cooler isotherms deepen, as is found in January 1982, is found
during month 3 in WBcl2.0 at 180°W.
5. Dynamical balances in the experiments
A reasonably clear picture of the importance of forcing locally, from the east,
and from the west of 160°W has emerged from the previous experiments. The results
of these studies have been discussed primarily in terms of the zonal flow and
temperature field variations. The numerical model, however, makes it possible
to examine all of the terms in the zonal momentum and temperature equations
and to determine how the balance of terms changes during the different phases
of the ENSO event, or in different stages of the idealized forcing studies.
The zonal momentum and heat equation balances have been scrutinized for each
experiment. In the interest of brevity these results will not be presented for
most of the experiments; the results of all experiments are available for the
interested in Harrison
and Craig (1992).
Although these balances are not essential to any of the previous results, a
brief summary of their features may be of interest, and serves to illustrate
some of the behavior that may have to be planned for when designing an equatorial
local dynamics experiment. The idealized forcing experiments in an initially
resting ocean typically have rather simple balances away from the forcing region.
In WBex0.02 the balance is classic linear Kelvin physics; local zonal
acceleration results from the zonal pressure gradient term and local temperature
change results from vertical advection. In WBwp0.2 the same balances
hold mostly, although zonal advection of zonal momentum can be important near
the surface when the surface jet is present at the date line. Nonlinearity is
present in WBwp0.2 both through the presence of the eastward surface
jet and in the projection of the forcing onto the vertical modes; the forcing
is strong enough to alter the vertical stratification in the forcing region
so that the response is not that predicted in detail by linear theory (see
Giese and Harrison 1990).
In WBcl0.2 the balances are more complex, because there is a preexisting
circulation. In the climatological mean circulation the balances are rather
involved, but will be touched on in the SADLER discussion below. The reader
particularly interested in the mean and seasonal cycle balances under climatological
forcing should consult Harrison
and Hankin (1992) in which these balances are discussed in detail. The presence
of instability waves means that the remote response is not so easily observed
as in the resting state experiments, and the presence of the remote response
causes a phase shift in the instability waves that would otherwise exist so
that even subtracting the climatological flow does not greatly simplify looking
at the balances. The first baroclinic mode response, with its vertically coherent
zonal pressure gradient signal, can be located at the appropriate time, but
subsequent modal zonal pressure gradient signals are difficult to discern. The
local zonal flow acceleration is typically a small difference between several
much larger terms and, with the instability wave signal also present and of
comparable or larger magnitude to the remote response, the remote response is
not easy to identify at 160°W. Even under these ideal model circumstances, it
is difficult to isolate the dynamical signatures of the remote response. In
the ocean, where instability wave amplitudes are substantial, it would be a
very considerable observational challenge to isolate the remote response even
with a very good notion of what one was looking for.
There is a recognizable dynamical signature of the remote response at 180°. The zonal
acceleration shows the characteristic pattern of an eastward acceleration down through 250
m followed by thermocline westward acceleration and then weak eastward acceleration.
Although there is a clear pressure gradient tendency of the opposite sign to the local
acceleration, there is also a strong zonal advection component, particularly during the
period of thermocline westward acceleration. There are also vertical advection changes of
up to 40 cm s/mo between 80 m and the surface during
and slightly after the thermocline westward acceleration period. Clearly, simple Kelvin
processes are altered in the presence of a mean circulation when the forcing is as strong
as in WBcl0.2.
Turning finally to the simulation experiments, let us first consider heat equation
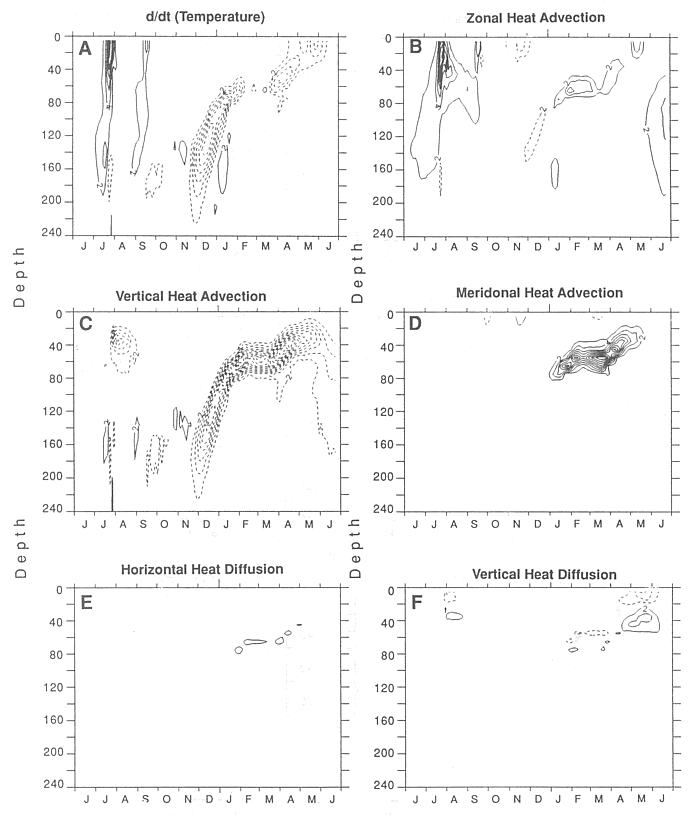
balances. Figures 17 and 18
present the heat equation terms for the SADLER and LOCAL experiments, respectively, with
the same contour levels. The plotting convention is such that d/dt minus all the
other terms equals zero, that is, zonal heat advection is -udT/dx, etc. Tendencies
smaller than 2°C mo are not contoured, to facilitate
examination of the dominant change processes. In the SADLER balances there is strong
surface-to-thermocline warming in September 1982; there is strong thermocline cooling in
December 1982 and January 1983. The July 1982 warming results almost entirely from zonal
heat advection; in August 1982 there is an episode of near-surface cooling tendency from
vertical advection that is balanced out by the other terms so that there is actually no
substantial warming or cooling. The December 1982-January 1983 thermocline cooling results
almost entirely from vertical heat advection in December, and is somewhat resisted by a
warming tendency from meridional heat advection in January.
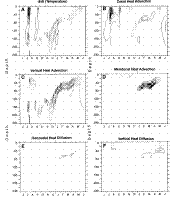
Figure 17. The individual temperature equation terms for the SADLER experiment at (0°,
160°W). The convention is that local temperature change = all other terms, so,for
example, the zonal advection tendency is -u*dt/dtx. Only warming and cooling
tendencies greater than 2°C mo are contoured, to
emphasize the major change periods. Positive (negative) values correspond to warming
(cooling) tendencies. Contour interval is 2°C mo. (a)
Zonal velocity at (0°, 160°W) from the B32 experiment, (b) temperature at (0°, 160°W)
from the B32 experiment. The contour intervals are 5 cm s and 2°C.
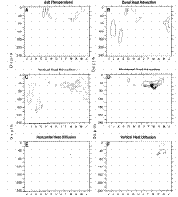
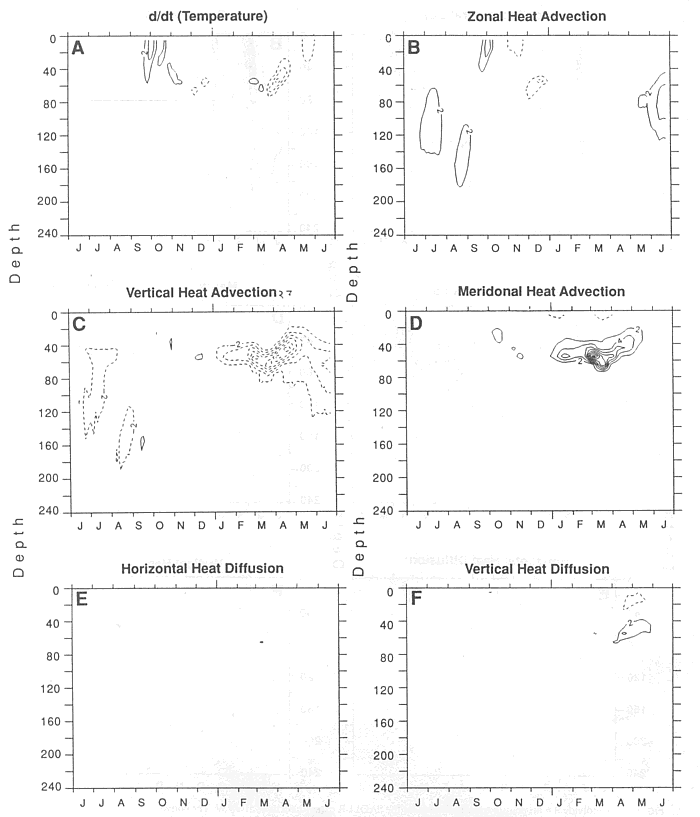
Figure 18. The individual temperature equation terms at (0°, 160°W) for the LOCAL
experiment, as in Fig. 17.
We have seen that remote forcing plays a significant role both in the July 1982 warming
and the November-December 1982 thermocline cooling (uplift). How well can we relate simple
Kelvin process ideas to these thermal balances? The simplest Kelvin balances involve
heating or cooling entirely through vertical advection, but this balance assumes a
horizontally uniform resting ocean. In the presence of zonal temperature gradients, zonal
advection of heat from the Kelvin zonal flow can be significant. Vertical advection of
heat from Kelvin upwelling or downwelling will be noticeable whenever there is significant
vertical temperature gradient. In the SADLER experiment, the initial eastward surge
advects warmer western Pacific water eastward and downwelling provides a little
thermocline depression and warming. We saw above that zonal advection of heat dominates
the SADLER balance during July; this is a rather extreme form of what might be expected
from remotely forced Kelvin processes and apparently occurs because there is little
upper-ocean stratification. The November-December thermocline cooling, which is dominated
by vertical advection, is much more what would be expected from simple Kelvin-type
processes.
In the LOCAL heat equation balances, the only significant warming on the scale of what
occurred in SADLER takes place near the surface in late September-October 1982; there is
no cooling of comparable magnitude in December-January. Nontrivial thermocline zonal
advection warming tendency in July and August-September is offset by a vertical advection
cooling tendency. Nontrivial cooling tendency from vertical advection in January-June 1983
is offset by a meridional heat advection warming tendency between January and May and by a
zonal advection tendency in June 1983. Horizontal and vertical heat diffusion is not
significant on these scales in the July 1982-March 1983 period. The LOCAL balances are
very different from the SADLER balances, further confirming that very different processes
were at work in the two experiments.
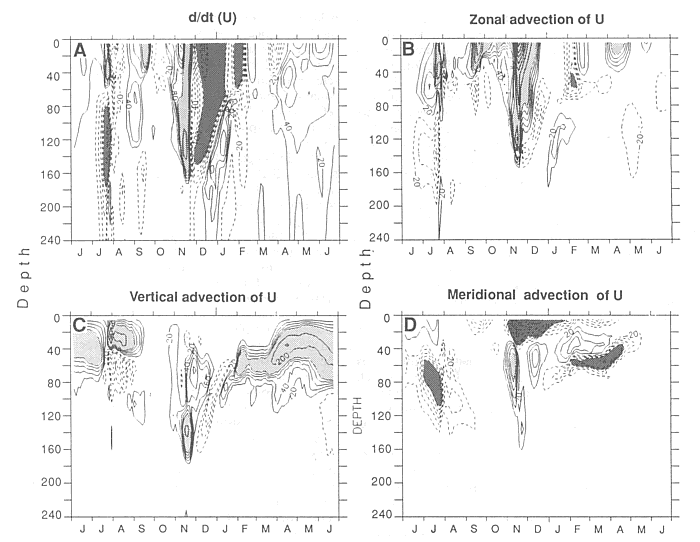
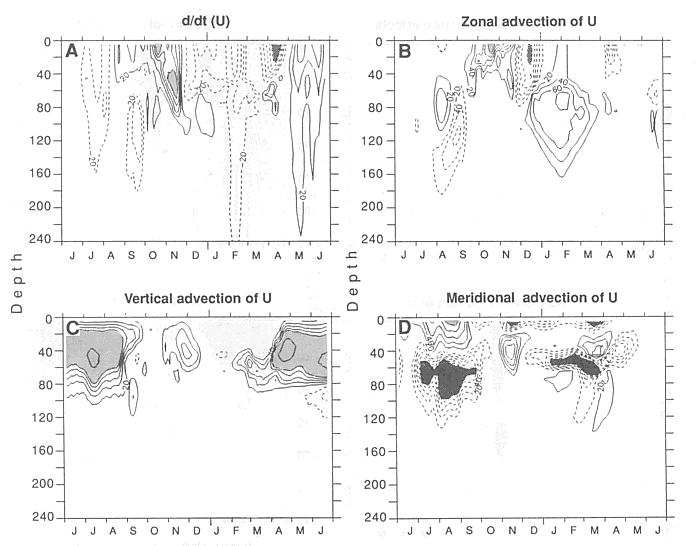
The SADLER momentum equation terms are shown in Fig.
19. To facilitate identifying the major features in these complex plots,
periods of eastward and westward acceleration in excess of 100 cm s/mo
are shaded light and dark, respectively. Before and after the large ENSO changes,
say June 1982 and after March 1983, an eastward tendency from the zonal pressure
gradient from the surface through the thermocline and an eastward tendency from
vertical advection above the thermocline tend to be balanced by a westward tendency
from vertical diffusion (which includes the surface wind stress) above the thermocline,
and by zonal advection and horizontal diffusion below the thermocline. The mean
and seasonal variations of the near-equatorial zonal momentum balances are discussed
in much more detail in Harrison
and Hankin (1992).
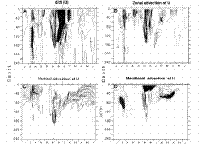
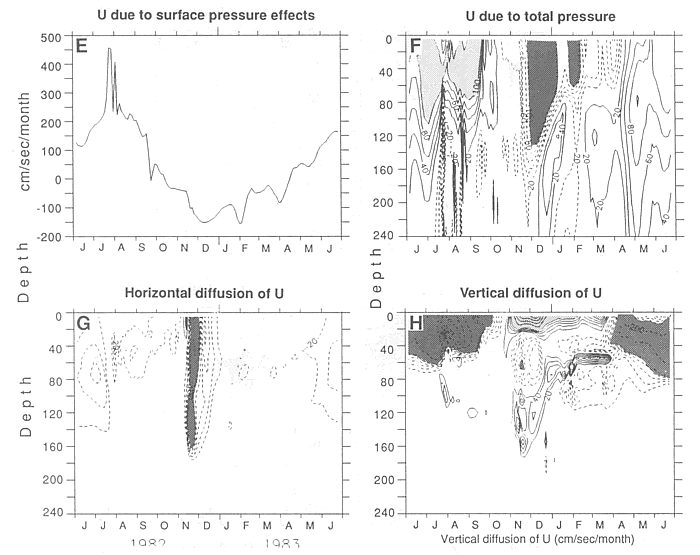
Figure 19. The individual zonal momentum equation terms at (0°, 160°W) for the SADLER
experiment. (a) local zonal acceleration, (b) zonal advection, (c) vertical advection, (d)
meridional advection, (e) surface zonal pressure gradient, (f) total zonal pressure
gradient, (g) horizontal diffusion, and (h) vertical diffusion. The total pressure
gradient term (f) is the sum of the baroclinic pressure gradient term (not shown) and the
surface pressure gradient term (e) (see text); the vertical diffusion term includes the
wind stress. The zonal momentum balance is (a) = (b) + (c) + (d) + (f) + (g) + (h).
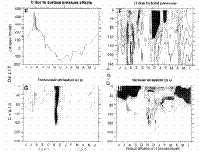
Figure 19 (Continued). The contour interval is 20 cm s/mo for accelerations below 100 cm s/mo and 100 cm s/mo for
accelerations above 100 cm s/mo. The zero contour line
is not shown. Dark shading is westward acceleration greater than 100 cm s/mo, light shading is eastward acceleration greater than
100 cm s/mo.
The GFDL primitive equation model in the form used by Philander
and Seigel (1985) does not permit explicit evaluation of the surface pressure
gradient term in the horizontal momentum equation unless every time step is
available, so this term has to be estimated from the residual in the zonal momentum
equation balance and then added to the zonal pressure gradient resulting from
vertically integrating the horizontal gradient of the density field. We find
that with our 3-day sampling interval in time, the best zonal momentum equation
balances are obtained if the "surface" pressure gradient term is evaluated
from the momentum equation imbalance well below the thermocline. In this calculation
the 21st vertical level, with a nominal depth of 490 m, is used. This surface
pressure gradient term is shown in the zonal momentum equation term balances
for reference, but is not a separate zonal momentum equation tendency term.
In our discussion in the text, references to "the zonal pressure gradient
tendency" always correspond to the "U due to total pressure"
panel.
The ENSO period changes in the zonal momentum terms in SADLER begin with the July 1982
strong thermocline deceleration accompanied by near-surface acceleration. There is a sharp
brief reduction in the zonal pressure gradient in the near surface and a reversal in the
thermocline, the vertical advection term briefly goes to zero, horizontal diffusion drops
almost to zero, zonal advection is eastward near the surface and westward in the
thermocline, and meridional advection is westward in the upper thermocline. In short, everything
changes in the zonal momentum balance. It was the complexity of the signal in these
terms that led us initially to try more restricted experiments in the hope of simplifying
the response and learning more about the dynamical signatures of different types of simple
responses. While our simpler studies indicate that the observed zonal current and thermal
field changes are consistent with remote Kelvin forcing, it would be difficult to try to
argue this position on the basis of the July 1982 zonal momentum equation balances.
The next major zonal flow change is the November eastward acceleration of the surface
jet, and its rapid penetration into the thermocline. We have seen that purely local winds
also produce eastward acceleration at this time, but that the resulting vertical
penetration is less and the amplitude is reduced from the full wind stress experiment. The
three terms with near-surface eastward tendency in November are 1) vertical diffusion down
to about 30 m (recall that this term includes the wind stress through the vertical
boundary condition), 2) zonal advection down to about 120 m, and 3) vertical advection
between about 80 m and 180 m and meridional advection between about 40 m and 120 m. The
retarding terms are horizontal diffusion and the zonal pressure gradient, which vanished
in early October and remains reversed from normal until April 1983.
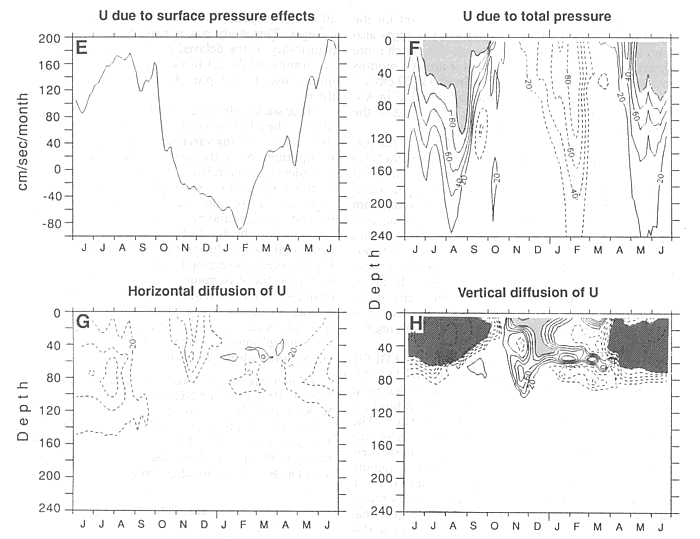
It is instructive to compare these terms with those of the LOCAL experiment (Fig. 20). LOCAL shows eastward acceleration in November from
the surface to about 100 m. The eastward tendency terms are zonal advection from the
surface to 60 m, vertical and meridional advection (weakly) from about 20 m to 60 m, and
vertical diffusion from the surface to 100 m. The primary westward term is horizontal
diffusion (the zonal pressure gradient is very weakly westward). Thus, the balance of
terms during this period is not very different from that in SADLER, even though we have
established that remote forcing is significant in SADLER.
Figure 20. The individual zonal momentum equation terms at 0$#176;, 160$#176;W for the
LOCAL experiment as in Fig. 19.
Figure 20. (Continued)
Now consider the deceleration phase of the eastward surface jet during December 1982
and January 1983. The eastward terms in SADLER are zonal advection (near the surface until
mid-December), vertical advection (with a complex vertical structure, and until
mid-December), vertical diffusion (very near the surface), and meridional advection (40 m
to 80 m). The largest westward terms are the zonal pressure gradient and meridional
advection very near the surface; smaller contributions come from horizontal diffusion,
zonal advection (below the near-surface eastward tendency in December and then at most
depths into January), and vertical advection. The pattern is complex, but the tendency
toward Kelvin-type dynamical patterns is present in the fact that the zonal pressure
gradient is a major factor over the entire period and depth range of the deceleration.
However, again, it would be rather bold to infer solely from these patterns that remote
forcing was a major element of this deceleration phase, given the magnitude of the other
terms and their changes.
The zonal momentum equation terms in LOCAL during this period are quite different from
those in SADLER. There is no sharp westward deceleration phase in December, to begin with,
and the only term to exceed 100 cm s/mo tendency is
the eastward vertical diffusion of momentum. Zonal advection, zonal pressure gradient,
meridional advection (very near the surface), and horizontal diffusion are all weakly
westward over the depth range of interest.
From our perspective, examination of the zonal momentum equation balance of terms is
interesting in the complexity it reveals. Only with the benefit of the various simpler
cases of 1982-83 winds and of the idealized westerly remote forcing studies are we able to
make reasonably confident assertions about the relative importance of local and remote
forcing, and particularly about the role of Kelvin-type physics in the response to
westerly remote forcing. In the presence of a strongly nonlinear background circulation
undergoing large changes like those of this region during this period, the zonal momentum
equation balance of terms reveals great complexity in space and time.
6. Summary and discussion
A primitive equation general ocean circulation model has been used to explore the
processes that may have been responsible for the dramatic temperature and current changes
observed on the equator at 159°W in 1982-83. Although the SADLER hindcast experiment
using the wind stress analysis of J. Sadler at the University of Hawaii does not perfectly
reproduce the observations, it offers as good a point comparison between model results and
data as has been published for the tropical Pacific. All of the major observed features
have counterparts in the hindcast, with comparable amplitudes. For this reason we judged
it defensible to study the model results in order to try to make inferences about the
processes responsible for the behavior of the ocean during this time.
A series of experiments was conducted to explore the importance of local and remote
forcing in the SADLER hindcast experiment. Neither local nor remote wind stress changes
alone suffice to account for the observed behavior. LOCAL forcing alone can account
qualitatively for the character of the variability in the zonal current records but does
not reproduce the thermal field evolution nor the quantitative current changes well.
Remote forcing to the east of 160°W seems to account for only a very small portion of the
remote forcing response, and meridional wind stress at and east of the date line has
little effect. Almost all of the remotely forced response at 160°W is propagated into the
region from the west.
The idealized remote forcing experiments illustrate the importance of vertical modes
higher than the second nonlinearity in the response through alteration of the
stratification under the forcing event as the forcing proceeds, zonal advective processes
and mean flow interaction. The more realistic the forcing event and the background field
on which it acts, the more the elements of the response resemble those seen in SADLER
during the periods of EUC deceleration, easterly surface jet formation and decay, and
thermocline uplift and intensification. The key response element is that of higher
vertical mode forcing, although the various elements of nonlinearity considerably shape
the details of the response. It has become rather common to think of the basic remote
response of the equatorial upper ocean east of a westerly wind event as consisting
primarily of a first vertical mode response with eastward acceleration from the surface to
at least the thermocline and a deepening of the thermocline. The idealized numerical model
experiments indicate clearly that this commonplace scenario is not correct within at least
30° of longitude east of the forcing region. Westward acceleration in the thermocline can
equal or exceed eastward near surface acceleration, and thermocline shallowing and
intensification can figure as strongly as deepening.
In previous numerical studies that have concentrated on the eastern equatorial
Pacific response to remote westerly event forcing (e.g.,
Harrison and Giese 1988), attention has been focused typically on the first
and second baroclinic Kelvin modes. Observational support for the remote forcing
of Kelvin response in the equatorial Pacific has been based largely on sea level
variability, in which only the first baroclinic mode typically has enough amplitude
to be visible. The first and second modes seem to provide most of the eastern
Pacific SST variability in the model studies, both because there is substantial
surface velocity response in them and because the numerical model mixing physics
(Pacanowski
and Philander 1981) seems to damp out third and higher modes from reaching
the eastern Pacific. However, the third, fourth, and fifth vertical modes are
strongly forced by wind events over stratifications typical of the numerical
model ocean and of the western Pacific according to linear theory (Giese
and Harrison 1990), and their subsurface zonal velocity and vertical velocity
amplitudes can be substantial near to the forcing region, as we have shown.
For central Pacific response it is clear that even with the strong Richardson
number-dependent mixing of the numerical model, third and higher Kelvin modes
can play a major role in the model response.
The dramatic deceleration and flow reversal of the EUC from July 1982 to November
1982 at 160°W is the result of changes in the local winds, zonal wind variability
west of the region, and to a very much more limited degree, meridional wind
variability east of the region. Kelvin-type response to remote westerly forcing
plays a major role in the July deceleration, even though its signature in the
zonal momentum equation balance of terms is not clearly the passage of an eastward-propagating
Kelvin pulse. Our studies do not enable us to sort out the relative importance
of discrete westerly event forcing (e.g., June 1982 near the date line), compared
with the eastward-propagating zonal stress pattern west of 180° from April through
June 1982, but we note that each of the primary elements of the observed July
response is reproduced in our most realistic westerly event forcing experiment.
The resonant Kelvin-type response mechanism discussed by McCreary
and Lukas (1986) is not essential to account for the observed behavior.
LOCAL zonal wind changes also tend to decelerate the EUC, although very much
more slowly than observed; this occurs over about 3 months rather than 1 month.
No more than about 20 cm s of the weakly
ongoing deceleration of the EUC in August seems to be related to forcing to
the east of the region and Rossby wave propagation.
The formation and eventual degradation of the surface-trapped jet in November and
December 1982 also result from both local and remote forcing. The local westerly winds
that began in late October 1982 accelerate the surface flow eastward and remote forcing
from the westerly event in November from near the date line out to at least 150°E
provides zonal advection and thermocline vertical advection that give it its full vertical
penetration. The jet accelerates eastward its entire duration against the zonal pressure
gradient. Its deceleration results from horizontal diffusion, vertical diffusion, and the
zonal pressure gradient, and so is consistent even with rather simple Kelvin forcing
dynamics.
Changes in the thermal structure in the SADLER hindcast are large when compared with
the LOCAL or LOCAL + EAST experiments, indicating that most of the temperature variability
in the SADLER hindcast comes from remote forcing west of the region. The deepening
thermocline and appearance of warm surface water in July 1982 results from forcing to the
west and corresponds to the Kelvin response that rapidly decelerates the EUC in July 1982.
We found that the heating is caused primarily by zonal advection rather than vertical
advection, apparently because the zonal temperature gradient in the thermocline is large
in this region, while the vertical temperature gradient near the surface is modest. The
cooling and sharpening of the thermocline in November and December 1982 also result from
remote forcing, apparently the November westerly event followed by continuing weakening of
the westerlies in December.
By and large we find that meridional wind stress variation has little impact on the
equatorial zonal flow and thermal fields at 160°W; zeroing the meridional stress locally
or east of 160°W has little impact on our results. We also find that little response is
forced by zonal wind stress variations east of 160°W. This finding is not inconsistent
with the recent idealized coupled-model results that suggest a delayed oscillator process
involving both Kelvin and Rossby modes of response as a model for the ENSO cycle, because
in at least some of these studies, the Rossby-Kelvin mode forcing and
propagation/reflection happen primarily between the central Pacific and the western
Pacific. The eastern waveguide does not play a fundamental role. In our studies, in which
the initial condition is climatological January, there is no preexisting Rossby or Kelvin
energy in the waveguide left over from a previous ENSO; all of our response is forced by
1982-83 wind stress changes. This study was not intended to explore the plausibility of
the delayed oscillator mechanism and our results, while not inconsistent with these
mechanisms, also do not provide any specific support for them.
These studies illustrate how challenging it is to clearly identify the effects of even
strong remote forcing when there is local forcing variability and when nonlinearity is
important. A number of experiments were necessary to understand the relative importance of
local versus remote forcing, zonal versus meridional wind forcing, and linear versus
nonlinear Kelvin wave response. In the end, a clearer and more detailed picture of the
processes responsible for the large variability of the central equatorial Pacific during
the heart of the 1982-1983 ENSO event was obtained. Future observational efforts to follow
the waveguide response to westerly wind changes will clearly require detailed knowledge of
the forcing across the waveguide as well as of the density structure in the forcing region
if they are to have much hope of exploring the extent to which even simple Kelvin response
ideas pertain to the actual response.
Acknowledgments. This work was supported by NOAA/PMEL, by the NOAA EPOCS
project, and by NASA UPN-578-22-13-02. Computing was carried out on the NIST CYBER 205 at
Gaithersburg, Maryland. The assistance of the TMAP group (Steve Hankin, Kevin O'Brien, and
Jerry Davison) and discussions with Dr. Ben Giese are also appreciated.
References
Battisti, D. S., and A. C. Hirst, 1988: Interannual variability in the tropical
atmosphere/ocean system: Influence of the basic state and ocean geometry. J. Atmos.
Sci., 46, 1687-1712.
Busalacchi, A. J., and M. A. Cane, 1988: The effect of varying stratification on
low-frequency equatorial motions. J. Phys. Oceanogr., 18, 801-812.
Cane, M. A., and E. S. Sarachik, 1976: Forced baroclinic ocean motions. I. The linear
equatorial unbounded case. J. Mar. Res., 34, 629-665.
Firing, E., R. Lukas, J. Sadler, and K. Wyrtki, 1983: Equatorial undercurrent
disappears during 1982-83 El Nińo. Science, 222, 1121-1123.
Giese, B. S., and D. E. Harrison, 1990: Aspects of the Kelvin wave response to episodic
wind forcing. J. Geophys. Res., 95, 7289-7312.
Harrison, D. E., and P. S. Schopf, 1984: Kelvin wave-induced anomalous advection and
the onset of surface warming in El Nińo events. Mon. Wea. Rev., 112,
923-933.
Harrison, D. E., and B. S. Giese, 1988: Remote westerly wind forcing of the eastern
equatorial Pacific; some model results. Geophys. Res. Lett., 15, 804-807.
Harrison, D. E., and B. S. Giese, 1991: Episodes of surface westerly winds as observed
from islands in the western tropical Pacific. J. Geophys. Res., 96,
3221-3237.
Harrison, D. E., and A. Craig, 1992: Temperature and momentum equation balances, June
1982-June 1983, from the SADLER hindcast. NOAA Tech. Memo. ERL-PMEL (in preparation).
Harrison, D. E., and S. Hankin, 1992: On the seasonal cycle of equatorial zonal
currents at 110°W and 140°W; Some circulation mode results and dynamics. J. Geophys.
Res., (in press).
Harrison, D. E., B. Kessler, and B. S. Giese, 1989: Ocean circulation model hindcasts
for the 1982-83 El Nińo: Thermal variability along the ship-of-opportunity tracks. J.
Phys. Oceanogr., 19, 397-418.
Harrison, D. E., B. S. Giese, and E. S. Sarachik, 1990: Mechanisms of SST change in the
equatorial waveguide during the 1982-83 ENSO. J. Climate., 3, 173-188.
Large, W. G., and S. Pond, 1981: Open ocean-momentum flux measurements in moderate to
strong winds. J. Phys. Oceanogr., 11, 324-336.
Luther, D. S., D. E. Harrison, and R. Knox, 1983: Zonal winds in the central equatorial
Pacific and El Nińo. Science, 222, 327-330.
McCreary, J. P., and R. Lukas, 1986: The response of the equatorial ocean to a moving
wind field. J. Geophys. Res., 91, 11 691-11 705.
McPhaden, M. J., and S. Hayes, 1991: Moored velocity, temperature and wind measurements
in the equatorial Pacific ocean: A review of scientific results, 1985-1990. Proc.
International TOGA Scientific Conference, Geneva, Switzerland, October 1990, 59-69.
Pacanowski, R. C., and S. G. H. Philander, 1981: Parameterization of vertical mixing in
numerical models of tropical oceans. J. Phys. Oceanogr., 11, 1443-1451.
Philander, S. G. H., 1981: The response of equatorial oceans to a relaxation of the
trade winds. J. Phys. Oceanogr., 11, 176-189.
Philander, S. G. H., and R. C. Pacanowski, 1980: The generation of equatorial currents.
J. Geophys. Res., 85, 1123-1136.
Philander, S. G. H., and R. C. Pacanowski, 1981: Response of equatorial oceans to
periodic forcing. J. Geophys. Res., 86, 1903-1916.
Philander, S. G. H., and A. Seigel, 1985: Simulation of El Nińo of 1982-1983. Coupled
Ocean-Atmosphere Models, J. Nihoul, Ed., Elsevier, 303, 517-541.
Schopf, P. S., and D. E. Harrison, 1983: On equatorial waves and El Nińo. I: Influence
of initial states on wave-induced currents and warming. J. Phys. Oceanogr., 13,
936-948.
Schopf, P. S., and M. Suarez, 1989: Ocean wave dynamics and the time scale of ENSO. J.
Phys. Oceanogr., 20, 629-645.
Return to Abstract
PMEL Outstanding Papers
PMEL Publications Search
PMEL Homepage