U.S. Dept. of Commerce / NOAA / OAR / PMEL / Publications

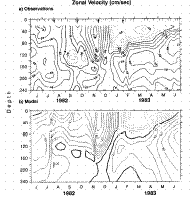
 in both plots.
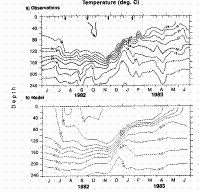
Figure 2. As for Fig. 1, except for temperature. The contour interval is 2°C.
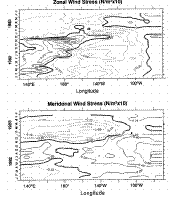
Figure 3. SADLER analysis of the monthly mean zonal and meridional wind stress along
the equator, 1982-1983. The contour interval is 0.02 N m in both plots.
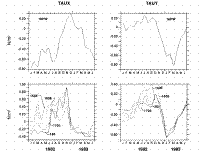
Figure 4. Time series of equatorial zonal and meridional wind stress at 160°W and at several longitudes west of 160°W.
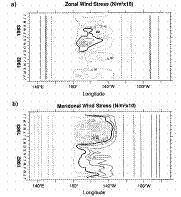
Figure 5. Monthly mean zonal and meridional wind stress along the equator, 1982-1983
for the LOCAL experiment. The contour interval is 0.02 N m and 0.01 N m
 ,
respectively.
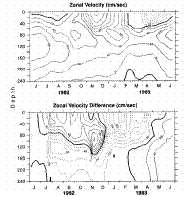
Figure 6. Zonal velocity at (0°, 160°W) (a) from the LOCAL experiment, (b) the
difference (SADLER - LOCAL). The contour interval is 20 cm s in both plots.
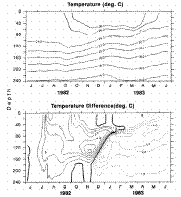
Figure 7. Temperature at (0°, 160°W) for the LOCAL experiment, as for Fig. 6. The contour interval is 2° and 1°C, respectively.
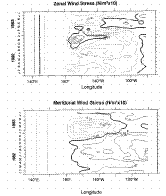
Figure 8. Monthly mean zonal and meridional wind stress along the equator, 1982-1983
for the LOCAL + EAST experiment. The contour interval is 0.02 N m in both plots.
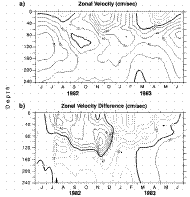
Figure 9. Zonal velocity at (0°, 160°W) (a) from the LOCAL + EAST experiment, (b) the
difference [SADLER - (LOCAL + EAST)] experiment. The contour interval is 20 cm s in both plots.
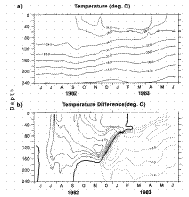
Figure 10. Temperature at (0°, 160°W) for the LOCAL and EAST experiment as for Fig. 9. The contour interval is 2° and 1°C, respectively.
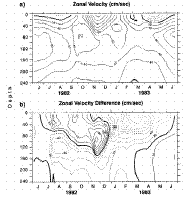
Figure 11. Zonal velocity at (0°, 160°W) (a) from the LOCAL + EAST-TAUY experiment,
(b) the difference [SADLER - (LOCAL + EAST-TAUY)]. The contour interval is 20 cm s in both plots.
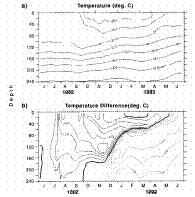
Figure 12. Temperature at (0°, 160°W) for the LOCAL + EAST-TAUY experiment as for Fig. 11. The contour interval is 2° and 1°C, respectively.
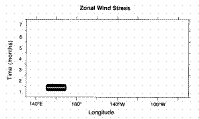
Figure 13. Zonal wind stress along the equator for the WBex0.02 experiment (0.02
N m wind burst). Meridional wind stress is identically
zero for the same period. The vertical axis is months.
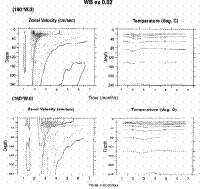
Figure 14. Zonal velocity and temperature at (0°, 160°W) and (0°, 180°) for WBex0.02
(0.02 N m burst over a resting ocean with exponential
density profile in depth). The contour intervals are 2 cm s
 and 2°C, respectively.
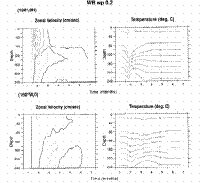
Figure 15. Zonal velocity and temperature at (0°, 160°W) and (0°, 180°) for WBwp0.2
(0.2 N m burst over a resting ocean with density
profile typical of 160°E). The contour intervals are 20 cm s
 and 2°C, respectively.
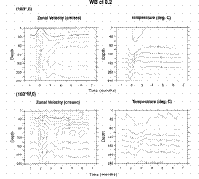
Figure 16. Zonal velocity and temperature at (0°, 160°W) and (0°, 180°) for WBcl0.2
(0.2 N m burst over an ocean forced to statistical
equilibrium to climatological annual mean wind stress, with a simple heat flux
parameterization). The contour intervals are 2 cm s
 and 2°C, respectively.
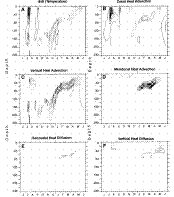
Figure 17. The individual temperature equation terms for the SADLER experiment at (0°,
160°W). The convention is that local temperature change = all other terms, so,for
example, the zonal advection tendency is -u*dt/dtx. Only warming and cooling
tendencies greater than 2°C mo are contoured, to
emphasize the major change periods. Positive (negative) values correspond to warming
(cooling) tendencies. Contour interval is 2°C mo
 . (a)
Zonal velocity at (0°, 160°W) from the B32 experiment, (b) temperature at (0°, 160°W)
from the B32 experiment. The contour intervals are 5 cm s
 and 2°C.
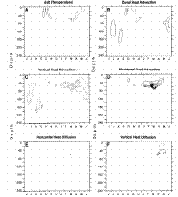
Figure 18. The individual temperature equation terms at (0°, 160°W) for the LOCAL experiment, as in Fig. 17.
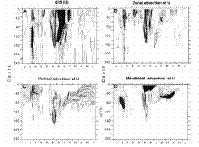
Figure 19. The individual zonal momentum equation terms at (0°, 160°W) for the SADLER experiment. (a) local zonal acceleration, (b) zonal advection, (c) vertical advection, (d) meridional advection, (e) surface zonal pressure gradient, (f) total zonal pressure gradient, (g) horizontal diffusion, and (h) vertical diffusion. The total pressure gradient term (f) is the sum of the baroclinic pressure gradient term (not shown) and the surface pressure gradient term (e) (see text); the vertical diffusion term includes the wind stress. The zonal momentum balance is (a) = (b) + (c) + (d) + (f) + (g) + (h).
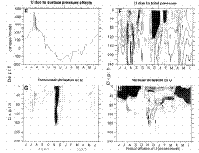
Figure 19 (Continued). The contour interval is 20 cm s /mo for accelerations below 100 cm s
 /mo and 100 cm s
 /mo for
accelerations above 100 cm s
 /mo. The zero contour line
is not shown. Dark shading is westward acceleration greater than 100 cm s
 /mo, light shading is eastward acceleration greater than
100 cm s
 /mo.
/mo.
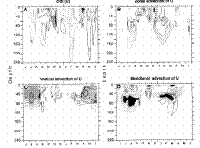
Figure 20. The individual zonal momentum equation terms at 0$#176;, 160$#176;W for the LOCAL experiment as in Fig. 19.
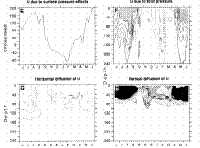
Figure 20. (Continued)
Return to previous section or return to the Abstract