U.S. Dept. of Commerce / NOAA/ OAR / PMEL / Publications
The model SST results presented here are from the same hindcasts of the 1982-83 event that have been described in Harrison et al. (1988, 1989). In brief, each hindcast uses a 27 vertical level version of the Cox-Bryan-Semtner primitive equation model that has been developed by Pacanowski and Philander over the last few years. The particular form of the model is that which was used in the pioneering 1982-83 ENSO hindcast of Philander and Seigel (1985); the various model parameters and equations are described there. Monthly mean surface wind stress fields are imposed: surface heat flux is computed from the surface wind, the SST, and an imposed air-sea temperature difference (the sensible and latent heat flux terms are the only ones permitted to vary, and a minimum wind speed is used in the latent computation to ensure that cooling continues to occur from evaporation even when the monthly mean wind is small); and each hindcast is begun from a climatological January initial condition obtained from a calculation of spinup for several years, with Hellerman and Rosenstein (1983) climatological wind stresses from the Levitus density field. As mentioned above, the five basic hindcast experiments make use of five different monthly mean surface wind stress analyses; we label each hindcast by the stress field used to force it, because the hindcasts are in every way identical save for the wind stress fields and the resulting different surface heat flux fields.
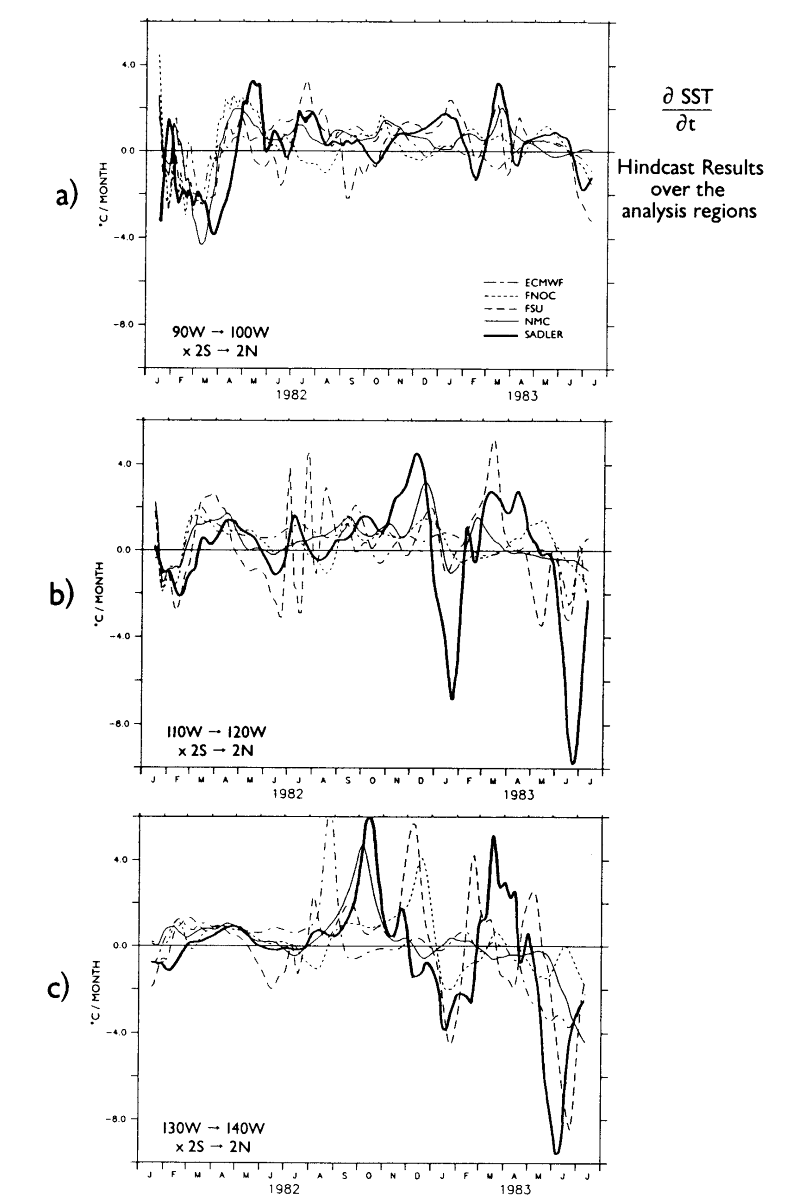
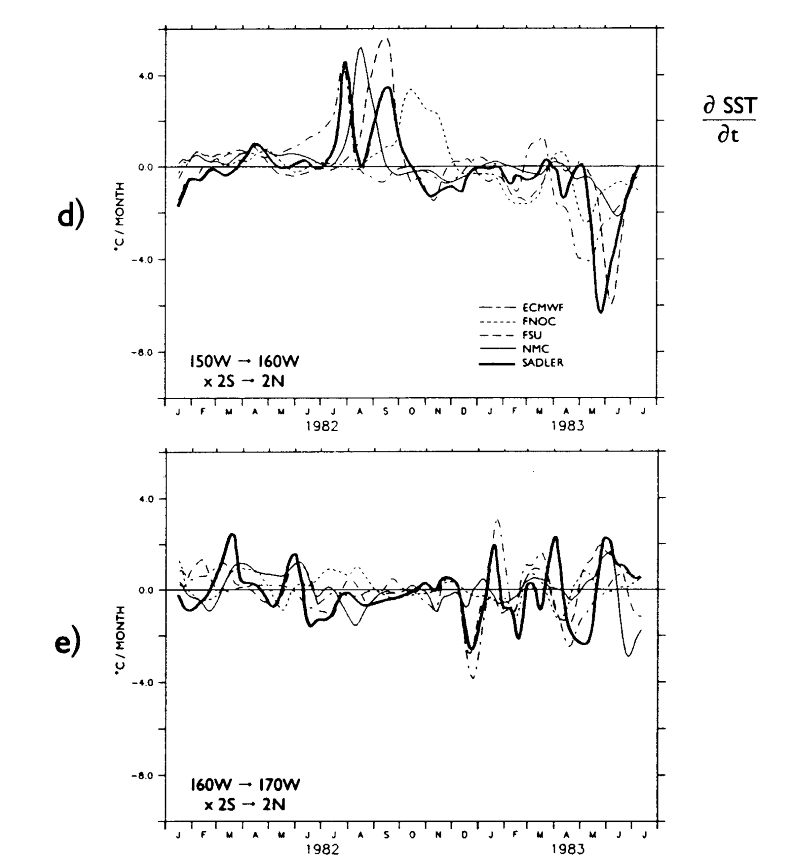
Figure 4(a-c; d and e) shows the time rate of change of SST for each hindcast, averaged over the analysis regions. Note that snapshots from the model were stored every three days, so that shorter time scale information is presented in these plots than was possible for the analyzed SST fields; this is necessary in order to determine the mechanisms responsible for SST change.
Figure 4. Rates of change of SST over the analysis regions, according to the five hindcast experiments, based on snapshots three days apart. See text for discussion.
In the 95°W region the hindcasts agree with each other, and with the observations that there was cooling in February-March 1982, but there is disagreement about conditions during April (note that there was disagreement in the observations about April also). FSU agrees with the observed May-June 1982 cooling; the other hindcasts all indicate warming. Averaged over the period July 1982-April 1983, each of the hindcasts indicates net warming (in agreement with the analyses of SST), but there is much more month-to-month variation between warming and cooling in the hindcasts than is seen in the analyses. Further, there is considerable disagreement between hindcasts, month to month. Hindcast consensus that cooling took place begins in June 1983; at this time the analyses also agreed that cooling was occurring. Note that the analyses indicated that some cooling began in April 1983 but differed in behavior during May.
In the 115°W region, consensus is found in the hindcasts on: warming in late March-late April 1982 (roughly in agreement with the analyses); net warming over the period August 1982-December 1982 (good agreement with the analyses); cooling in January 1983 (the analyses are equivocal on this); and major cooling in June-July 1983 (good agreement with the analyses). The hindcasts differ greatly on month-to-month details. Although the analyses indicate that the 95°W and 115°W regions had quite similar SST changes, the hindcasts show some significant differences between the changes in the two regions.
In the 135°W region there is hindcast consensus that warming occurred in March-May 1982 (in agreement with the analyses), that net warming existed averaged over July-December 1982 (generally in agreement with the analyses), that cooling took place in January 1983 (the analyses are equivocal, but none indicate significant cooling) and that cooling was present in June-July 1983 (good agreement with analyses). The August-December 1982 period contains a strong pulse of warming in each hindcast but there are large differences in the timing of this pulse; the ECMWF pulse occurs in August and the FNOC and FSU pulses occur in December. The June-July 1983 cooling is much stronger in FSU and SADLER than is found in the analyses.
In the 155°W region there is consensus on warming in April 1982 (in agreement with the analyses), on net warming averaged over August-November 1982 (generally supported by the analyses), on cooling averaged over mid-December 1982-mid-February 1983 generally supported by the analyses), and on cooling mid March 1983-June 1983 (generally supported by the analyses). The hindcast net August-November 1982 warming results, in each case, from one or more episode of strong warming, with different timing in each hindcast. The SADLER hindcast has two warming pulses while the others have only one each. The timing of the main 1983 cooling also differs by more than a month between hindcasts.
In the 165°E region there are no multimonth periods of hindcast consensus, just as there was little consensus in the analyses. The strongest signal in the analyses, cooling in mid-January-mid-February 1983, has an analogue in the ECMWF, SADLER and FSU hindcasts. Mostly there is simply a lot of month-to-month variability of warming and cooling, typically of about 1°C/mo.
Table 1 summarizes the periods of consensus from both the analyses and the hindcasts. It shows that there was warming in February-March 1982 (as occurs typically in the climatological seasonal cycle at this time), followed by relatively normal cooling in May-June 1982. The ENSO signal appears in the subsequent warming that began in July in the 155°W region and later and later farther east of this region. The consensus periods of ENSO warming ended between late 1982 and early 1983, depending upon the longitude of the region. No consensus is found until the end portion of the event begins, with cooling in May-June-July 1983, depending upon the region. There is often consensus among the hindcasts on the sign of SST change in the periods when there is also consensus among the analyses, though the hindcast consensus sometimes is found only through averaging over several months. In the periods when the analyses do not agree, generally, no hindcast consensus is found.
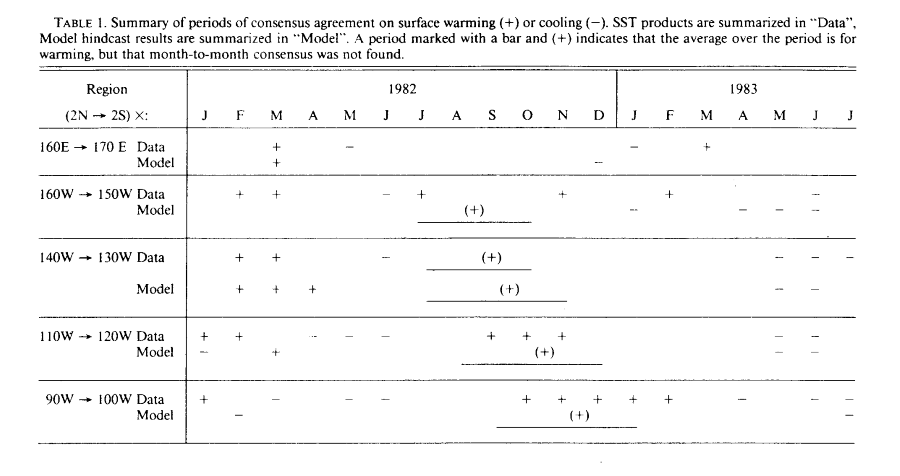
Table 1. Summary of periods of consensus agreement on surface warming (+) or cooling (-). SST products are summarized in "Data," modem hindcasts results are summarized in "Model." A period marked with a bar and (+) indicates that the average over the period is for warming, but the month-to-month consensus was not found.
Go back to previous section or forward to next section