U.S. Dept. of Commerce / NOAA / OAR / PMEL / Publications
Until recently, no practical method has been available to continuously monitor seismicity of seafloor spreading centers. The availability of the U.S. Navy's SOund SUrveillance System (SOSUS) for environmental research has allowed the continuous monitoring of low-level seismicity of the Juan de Fuca Ridge in the northeast Pacific. On June 22, 1993, NOAA installed a prototype system at U.S. Naval Facility Whidbey Island to allow real-time acoustic monitoring of the Juan de Fuca Ridge using SOSUS. On June 26, 2145 GMT, a burst of low-level seismic activity, with accompanying harmonic tremor, was observed and subsequently located near 46°15'N, 129°53'W, on the spreading axis of the Juan de Fuca Ridge. Over the following 2 days, the activity migrated to the NNE along the spreading axis with the final locus of activity near 46°31.5'N, 129°35'W. The nature of the seismicity was interpreted to represent a lateral dike injection with the possibility of eruption on the seafloor. Based on this interpretation, a response effort was initiated by U.S. and Canadian research vessels, and both warm water plumes and fresh lavas were subsequently identified at the site.
Seafloor spreading has been recognized since the late 1960s as the primary
generator of oceanic crust; however, the basic mechanisms involved in this fundamental
process have never been directly recorded in the deep ocean. A variety of indirect
observations have provided insights into the process of seafloor spreading.
The study of oceanic crust in the geological record (ophiolites) reveals the
presence of layers of intrusive gabbros, sheeted volcanic dikes, and extrusive
basalts [Nicolas,
1989]. This sequence was later confirmed by deep-sea drilling [Anderson
et al., 1982], with the sheeted dikes observed to be over
The preferred means of monitoring volcanic systems on land is through their seismicity. Distinctive signatures for magma movement (harmonic tremor) and dike injection (seismic swarm migration) are readily apparent when recorded on a dense seismic array and provide a detailed picture of the subsurface processes leading to volcanic eruptions or dike emplacements [Klein et al., 1987]. Since volcanic systems produce relatively low magnitude earthquakes, land seismic arrays have been unsuccessful at recording seafloor spreading center activity. Ocean bottom seismometers are capable of measuring volcanic activity, but due to their relatively high cost and short endurance, no seafloor experiments have successfully recorded volcanic activity at spreading centers. As such, very little is known about the distribution in time and space of seafloor spreading activity or the fundamental nature of that activity.
An alternative means of monitoring seafloor spreading center seismicity is available through the use of underwater hydrophone arrays. By taking advantage of the sound propagation properties of the ocean and the beam-forming capability of multiple element arrays, underwater hydrophones are capable of recording deep-ocean seismic events too small for detection on the land networks [Fox et al., 1994]. In 1991, the National Oceanic and Atmospheric Administration (NOAA) was granted access to the U.S. Navy's SOund SUrveillance System (SOSUS) in the northeast Pacific Ocean for use in monitoring the Juan de Fuca Ridge spreading center. After several years of recording and analyzing raw hydrophone records for spreading center activity, no significant activity was recorded from the spreading center axis. On June 22, 1993, the system was expanded to collect beam-formed data from selected arrays and transmit the data in real time to NOAA laboratories in Newport, Oregon. This paper describes the techniques developed for real-time analysis of underwater hydrophone signals and the detection and preliminary interpretation of volcanic seismicity recorded from the central Juan de Fuca Ridge beginning June 26, 1993. Accompanying papers provide detailed descriptions of the distribution of activity [Dziak et al., this issue] and the nature of the acoustic T-waves [Schreiner et al., this issue].
Installation of the SOSUS system was begun in the mid 1950s by the U.S. Navy
for use in antisubmarine warfare. SOSUS consists of bottom mounted hydrophone
arrays connected by undersea communication cables to facilities on shore. The
individual arrays are installed primarily on continental slopes and seamounts
at locations optimized for undistorted long range acoustic propagation. The
combination of location within the oceanic sound channel and the sensitivity
of large-aperture arrays allows the system to detect radiated acoustic power
of less than a watt at ranges of several hundred kilometers. For this study,
three separate arrays were continuously monitored. All arrays lie within
Data acquisition is accomplished by combining portions of the Navy's processing
facilities with a NOAA-designed system installed at the U.S. Naval Facility at Whidbey
Island, Washington. Navy systems perform adaptive beam forming on digitized hydrophone
signals, with the outputs converted back to analog electrical signals. These analog
beam-former outputs are accessed by the NOAA-supplied system where the signals are
low-pass filtered (cutoff frequency of
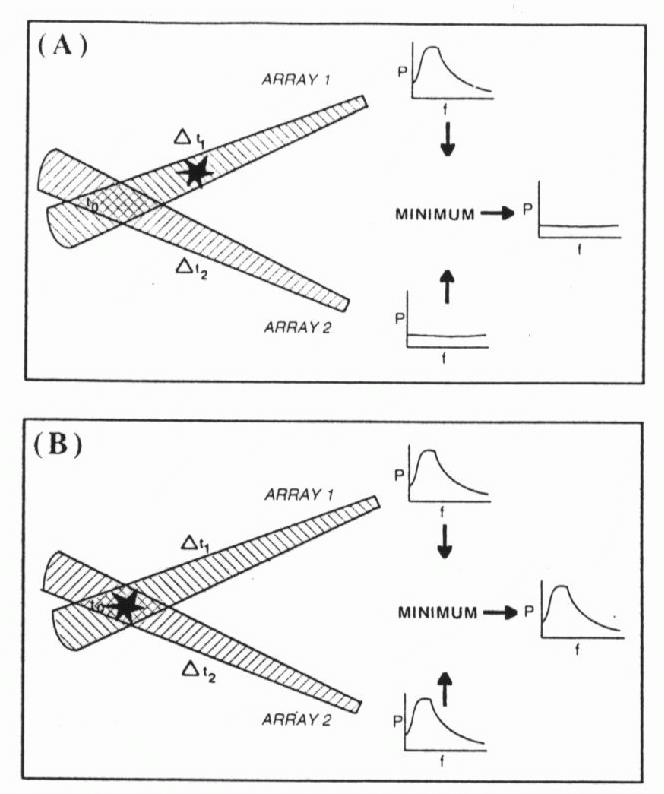
For real-time analysis of the data, a method was devised to allow immediate assessment of the activity level at predefined locations spaced at 10-minute intervals of latitude along the ridge axis. First, all of the digitized beam-former signals are converted to the frequency domain by applying Fast Fourier Transforms to 1-second (100 sample) segments to form 32 individual spectrograms. Each spectrogram is then translated to source time using precalculated travel times from each preselected location on the ridge crest to each of the listening arrays. Travel times are estimated by applying propagation models to the U.S. Navy standard ocean sound speed model, the Generalized Digital Environmental Model (GDEM) climatology [Davis et al., 1986; Teague et al., 1990]. For each ridge-crest location, a combined spectrogram based on the beam crossing from two separate arrays is produced by taking the minimum of each common frequency estimate. As illustrated in Figure 1, this procedure eliminates the detection of events produced off the ridge axis, while ridge-crest events are retained. The resulting combined spectrograms for the selected locations are continuously displayed on a video display terminal (VDT) at NOAA's Newport, Oregon laboratories and hard copies produced each hour for later evaluation. The duration of seismic sources (tens of seconds) and the width of the formed beams in these frequencies (>10°) allows overlap of the detection points along the ridge so that no events should go undetected.
Fig. 1. The real-time detection system is designed to display combined spectrograms
based on two formed acoustic beams overlapping at preselected sites along the spreading
center axis. Spectra for 1-minute data segments are translated to source time based on
calculated travel times ( t1, t1) from each site to each receiving array.
The spectra are then combined by selecting the minimum power (P) from each array
for each frequency (f). Where an event occurs outside the location of interest (A),
its energy appears on only one array and the combined spectrum displays the other
member of the pair. When an event occurs within the location of interest (B), its
energy appears in both arrays and is displayed.
t1, t1) from each site to each receiving array.
The spectra are then combined by selecting the minimum power (P) from each array
for each frequency (f). Where an event occurs outside the location of interest (A),
its energy appears on only one array and the combined spectrum displays the other
member of the pair. When an event occurs within the location of interest (B), its
energy appears in both arrays and is displayed.
Following detection of an event, the beam-formed signals are transferred to an off-line analysis computer where precise locations are determined. The arrival time (1-second resolution) on three arrays is selected by an operator from a VDT and this information is combined with precise array locations and oceanographic sound speed models. A least-squares iterative fit based on minimizing the dispersion of the estimated source time produces latitude, longitude, and source time estimates for each event. Because the received signals are not multiple phase, source depth cannot be estimated, and since there are only three arrays, there are insufficient degrees of freedom to calculate an error ellipse.
To test the accuracy of the location technique and the underlying ocean sound speed
model, a series of five explosions were detonated along the ridge axis between 46°18'N
and 46°37'N using GPS navigation control. Comparison of actual shot locations with
calculated positions yields bias errors of
Four days after installing the real-time monitoring system, a swarm of seismic activity was detected (Figure 2) from the central Juan de Fuca Ridge. The nature of the seismicity differed significantly from that observed in non-ridge-crest environments. In typical earthquake swarms observed on transform fault zones, a large main shock is followed by smaller aftershocks clearly separated by varying intervals of time. The earthquake swarm from the central Juan de Fuca Ridge showed no large main shock, but rather a series of small shocks spaced very closely in time and separated by nearly equal time intervals. Also, a high level of continuous noise in the 5-20 Hz range (Figure 2) appeared simultaneously with the earthquake activity. This continuous noise is similar in nature and frequency content to harmonic tremor observed on Kilauea Volcano in Hawaii during active magma transport in the subsurface [Koyanagi et al., 1987]. The location of the activity on the ridge axis, the nature of the seismic sequence, and the presence of harmonic tremor led us to believe that this seismo-acoustic signal represented the initiation of volcanic activity.
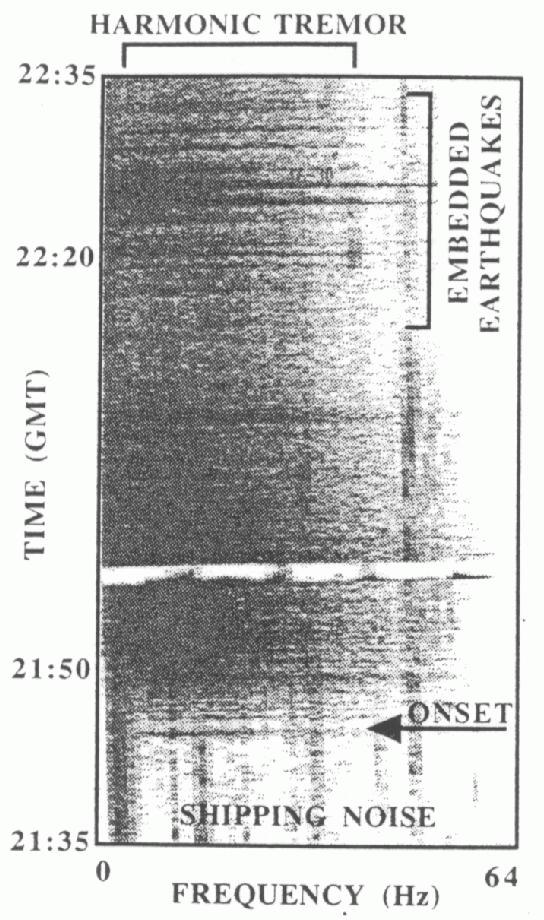
Fig. 2. Spectrogram based on crossed SOSUS beams of initial onset of seismic activity from the central Juan de Fuca Ridge on June 26, 1993. Dark colors represent high acoustic power at a given time and frequency. Low frequency noise, interpreted to represent harmonic tremor, with small embedded earthquakes begins at 21:43 GMT. Shipping noise appears as parallel vertical lines.
By applying the least-squares location method to arrivals on the individual
beams, the initial swarm was determined to be originating from the central Juan
de Fuca Ridge near 46°15'N and 129°53'W. This position lies on a prominent volcanic
rift zone of Axial Seamount, a large hotspot volcano on the ridge axis. It was
initially assumed that the activity represented an eruption on the volcanic
rift zone. Over the course of 2 days, however, the epicenter locations were
observed to migrate along strike (NNE) nearly
The volcanic nature of the seismicity, the migration of activity along structure, and the localization of the seismicity at the down rift end of the migration is consistent with a lateral dike injection into pre-existing structure with extrusion at the terminus [Dziak et al., this issue]. Although this model was not clear during the early stage of the event, the volcanic nature of the seismicity and its location prompted a request for the Canadian RV Tully, which was known to be working in the area, to respond with water-column measurements. Tully discovered a massive warm-water plume overlying the northern terminus of the earthquake migration [Baker et al., this issue] that was later confirmed by the NOAA Ship Discoverer, which also discovered a recent lava flow on the seafloor within 1 km of the mean location of the persistent seismicity [Embley et al., this issue]. A series of later cruises and measurements followed these initial discoveries, the results of which are described in this issue.
The field observations are consistent with the seismic evidence and appear to confirm a lateral dike injection. The presumed origin of the dike near 46°12'N argues for the small CoAxial segment acting as an independent volcanic system, since the magma source for Axial Seamount should underlie the summit area at 45°57'N and no seismic activity was detected from this area preceding this event; however, the initial earthquake swarm was consistently located on the volcanic rift zone of Axial Seamount rather than along the axis of CoAxial segment, which lies nearly 6 km to the east (Figure 3). It is possible that the magma source beneath Axial Seamount fed the dike through a lateral conduit, which did not produce detectable seismicity until encountering brittle crust near the seafloor, and the dike crossed structure into the adjacent CoAxial segment.
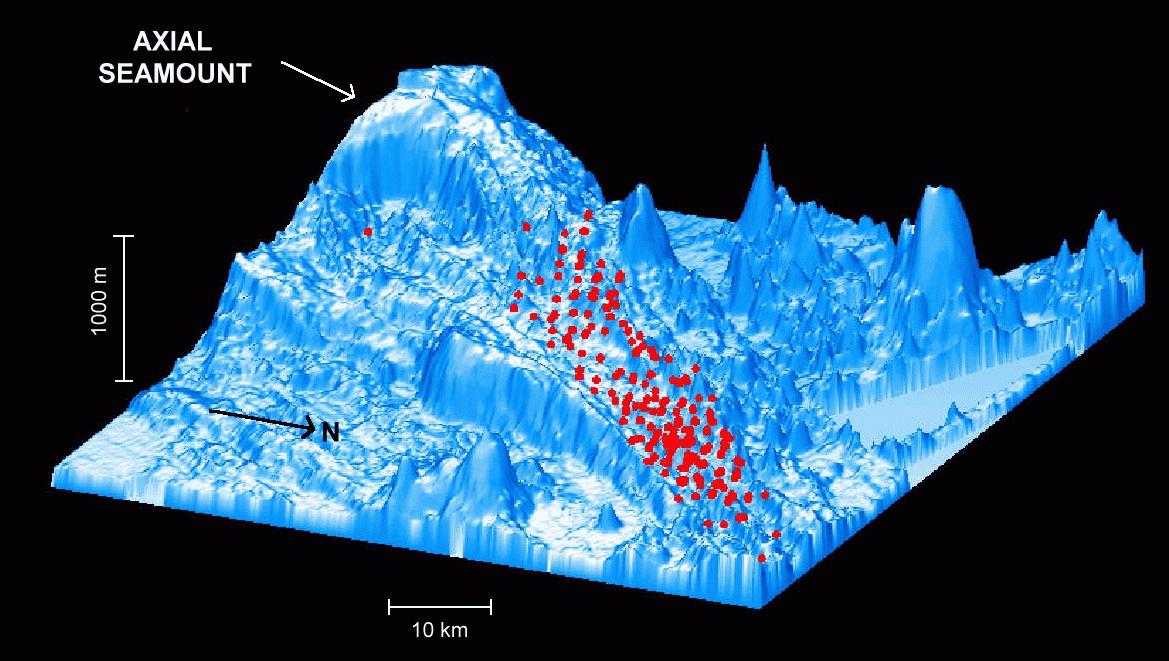
Fig. 3. Three-dimensional relief of the north rift zone of Axial Seamount and the CoAxial segment, showing the location of earthquake epicenters detected by NOAA/SOSUS real-time detection system during the period June 26-July 15, 1993. The neovolcanic zone of the CoAxial segment is shown as a black line. Seismicity associated with an inferred lateral dike injection originates on the volcanic rift zone of Axial Seamount and migrates NNE to an eruptive site on the CoAxial segment (triangle, near right). The high relief of the volcanic rift zone may influence the location of epicenters.
One possible explanation for this apparent discrepancy in the origin of the dike may lie with the generation mechanism of seismo-acoustic T-waves. Although the details of T-wave generation have not been adequately modelled, seismic energy must couple into the water column through the seafloor interface overlying the crustal earthquake. The efficiency of that coupling depends on many factors, including the depth of the seafloor relative to the oceanic sound channel axis [Johnson and Norris, 1968]. Figure 3 shows that the volcanic rift zone provides a significant bathymetric high near the origin of the T-wave swarm which is greatly reduced at the northern terminus. If this bathymetric high acted as an efficient acoustic radiator, the result could be an artificial migration of the apparent location westward. If earthquake sources to the south are deeper, as inferred by Schreiner et al. [this issue], a larger area of seafloor should resonate and the radiator effect should be enhanced. There is, however, shallow terrain to the east of the site which produced no inferred epicenters, indicating that the radiation effect may not be significant in this instance. Geophysical field work in the southern region to locate the subsurface dike could help settle the uncertainty for this particular episode. Ultimately, a better understanding of the physics of T-wave generation and supporting numerical modeling of generating sites is required.
In summary, the SOSUS-based detection system developed for monitoring the Juan de Fuca Ridge successfully detected and located an active seafloor spreading episode during its first week of operation. The behavior of the seismicity and later field observations indicate a lateral dike injection with seafloor eruption as the basic process involved. This model for seafloor spreading is consistent with previous observations and probably represents the basic unit of crustal accretion at seafloor spreading centers. As monitoring continues, a record of the temporal and spatial variability of active seafloor spreading will be compiled for the Juan de Fuca Ridge, and additional opportunities will arise to directly observe the process.
Acknowledgments. Special thanks to the personnel of Naval Facility, Whidbey Island for operational assistance and the U.S. Naval Space and Warfare Systems Command for allowing access to the SOSUS system. This project is entirely funded by NOAA's VENTS Program. PMEL Contribution 1526.
Anderson, R. N., J. Honnorez, K. Becker, A. C. Adamson, J. C. Alt, R. Emmermann, P. D. Kempton, H. Kinoshita, C. Laverne, M. J. Mottl, and R. L. Newmark, DSDP Hole 504B, the first reference section over 1 km through Layer 2 of the oceanic crust, Nature, 300, 589-594, 1982.
Baker, E. T., G. J. Massoth, R. A. Feely, R. W. Embley, R. E. Thomson, and B. J. Burd, Hydrothermal event plumes from the CoAxial seafloor eruption site, Juan de Fuca Ridge, Geophys. Res. Lett., this issue.
Chadwick, Jr., W. W., R. W. Embley, and C. G. Fox, Evidence for volcanic eruption on the southern Juan de Fuca Ridge between 1981 and 1987, Nature, 350, 416-418, 1991.
Davis, T. M., K. A. Countryman, and M. J. Carron, Tailored acoustic products utilizing the NAVOCEANO GDEM (a generalized digital environmental model), in Proceedings, 36th Naval Symposium on Underwater Acoustics, Naval Ocean Systems Center, San Diego, CA, 1986.
Dziak, R. P., C. G. Fox, and A. E. Schreiner, The June-July 1993 seismo-acoustic event at CoAxial segment, Juan de Fuca Ridge: Evidence for a lateral dike injection, Geophys. Res. Lett., this issue.
Embley, R. W., W. W. Chadwick, Jr., I. R. Jonasson, D. Butterfield, and E. T. Baker, Intrusion, eruption, and megaplumes at CoAxial segment, Juan de Fuca Ridge, June-July, 1993, Geophys. Res. Lett., this issue.
Embley, R. W., and W. W. Chadwick, Jr., Volcanic and hydrothermal processes associated with a recent phase of seafloor spreading at the northern Cleft segment: Juan de Fuca Ridge, J. Geophys. Res., 99(B3), 4741-4760, 1994.
Fox, C. G., R. P. Dziak, H. Matsumoto, and A. E. Schreiner, Potential for monitoring low-level seismicity on the Juan de Fuca Ridge using military hydrophone arrays, Mar. Tech. Soc. J., 27(4), 22-30, 1994.
Haymon, R. M., D. J. Fornari, K. L. von Damm, M. D. Lilley, M. R. Perfit, J. M. Edmond, W. C. Shanks, III, R. A. Lutz, J. M. Grebmeier, S. Carbotte, D. Wright, E. McLaughlin, M. Smith, N. Beedle, and E. Olson, Volcanic eruption of the mid-ocean ridge along the East Pacific Rise crest at 9°45'-52'N: Direct submersible observations of seafloor phenomena associated with an eruption event in April, 1991, Earth Planet. Sci. Lett., 119, 85-101, 1993.
Johnson, R. H., and R. A. Norris, T-phase radiators in the western Aleutians, Bull. Seis. Soc. Am., 58, 1-10, 1968.
Klein, F. W., R. Y. Koyanagi, J. S. Nakata, and W. R. Tanigawa, The seismicity of Kilauea's magma system, in Decker, R.W., T. L. Wright, and P. H. Stauffer, eds., Volcanism in Hawaii, U.S. Geological Survey Professional Paper 1350, 2, 1019-1186, 1987.
Koyanagi, R. Y., B. Chouet, and K. Aki, Origin of volcanic tremor in Hawaii, Part I. Data from the Hawaiian Volcano Observatory 1969-1985, in Decker, R.W., T. L. Wright, and P. H. Stauffer, eds., Volcanism in Hawaii, U.S. Geological Survey Professional Paper 1350, 2, 1221-1257, 1987.
Lonsdale, P., Non-transform offsets of the Pacific-Cocos plate boundary and their traces on the rise flanks, Geol. Soc. Am. Bull., 96, 313-327, 1985.
MacDonald, K. C., J. C. Sempere, and P. J. Fox, East Pacific Rise from Siqueiros to Orozco Fracture Zones: Along-strike continuity of axial neovolcanic zone and structure and evolution of overlapping spreading centers, J. Geophys. Res., 89, 6049-6069, 1984.
Nicolas, A., Structures of Ophiolites and Dynamics of Oceanic Lithosphere, Kluwer, Dordrecht, 1989.
Schreiner, A. E., C. G. Fox, and R. P. Dziak, Spectra and magnitudes of T-waves from the 1993 earthquake swarm on the Juan de Fuca Ridge, Geophys. Res. Let., this issue.
Teague, W. J., M. J. Carron, and P. J. Hogan, A comparison between the Generalized Digital Environmental Model and Levitus climatologies, J. Geophys. Res., 95, 7167-7183, 1990.
Return to Abstract or go to Gallery of Figures