U.S. Dept. of Commerce / NOAA / OAR / PMEL / Publications
Rising atmospheric carbon dioxide (CO![]() ) concentrations over the past two centuries have led to greater CO
) concentrations over the past two centuries have led to greater CO![]() uptake by the oceans. This acidification process has changed the saturation state of the oceans with respect to calcium carbonate (CaCO
uptake by the oceans. This acidification process has changed the saturation state of the oceans with respect to calcium carbonate (CaCO![]() ) particles. Here we estimate the in situ CaCO
) particles. Here we estimate the in situ CaCO![]() dissolution rates for the global oceans from total alkalinity and chlorofluorocarbon data, and we also discuss the future impacts of anthropogenic CO
dissolution rates for the global oceans from total alkalinity and chlorofluorocarbon data, and we also discuss the future impacts of anthropogenic CO![]() on CaCO
on CaCO![]() shell-forming species. CaCO
shell-forming species. CaCO![]() dissolution rates, ranging from 0.003 to 1.2 micromoles per kilogram per year, are observed beginning near the aragonite saturation horizon. The total water column CaCO
dissolution rates, ranging from 0.003 to 1.2 micromoles per kilogram per year, are observed beginning near the aragonite saturation horizon. The total water column CaCO![]() dissolution rate for the global oceans is approximately 0.5 ± 0.2 petagrams of CaCO
dissolution rate for the global oceans is approximately 0.5 ± 0.2 petagrams of CaCO![]() C per year, which is approximately 45 to 65% of the export production of CaCO
C per year, which is approximately 45 to 65% of the export production of CaCO![]() .
.
Atmospheric CO![]() concentrations oscillated between 200 and 280 parts per million (ppm) over the 400,000 years before the industrial period. Current atmospheric concentrations are now approaching 380 ppm as a result of the industrial and land use activities of humankind. In the past few decades, only half of the CO
concentrations oscillated between 200 and 280 parts per million (ppm) over the 400,000 years before the industrial period. Current atmospheric concentrations are now approaching 380 ppm as a result of the industrial and land use activities of humankind. In the past few decades, only half of the CO![]() released by human activity has remained in the atmosphere; of the remainder, about 30% has been taken up by the ocean and 20% by the terrestrial biosphere [Sabine et al., 2004].
released by human activity has remained in the atmosphere; of the remainder, about 30% has been taken up by the ocean and 20% by the terrestrial biosphere [Sabine et al., 2004].
Most previous estimates of oceanic uptake of CO![]() were made using ocean circulation models calibrated with tracer observations. Recently, a large global data set of ocean tracer and carbon system observations has been acquired through the World Ocean Circulation Experiment/Joint Global Ocean Flux Study. These observations indicate a total ocean uptake of anthropogenic CO
were made using ocean circulation models calibrated with tracer observations. Recently, a large global data set of ocean tracer and carbon system observations has been acquired through the World Ocean Circulation Experiment/Joint Global Ocean Flux Study. These observations indicate a total ocean uptake of anthropogenic CO![]() of approximately 118 ± 19 Pg of C (1 Pg of C = 10
of approximately 118 ± 19 Pg of C (1 Pg of C = 10![]() g of C) between 1800 and 1994 [Sabine et al., 2004].
g of C) between 1800 and 1994 [Sabine et al., 2004].
Estimates of future atmospheric and oceanic CO![]() concentrations, based on the Intergovernmental Panel on Climate Change emission scenarios and general circulation models, suggest that by the end of the century CO
concentrations, based on the Intergovernmental Panel on Climate Change emission scenarios and general circulation models, suggest that by the end of the century CO![]() levels could be over 800 ppm [Prentice et al., 2001]. Corresponding models for the oceans indicate that surface-water dissolved inorganic carbon (DIC) could probably increase by more than 12%, and the carbonate ion concentration would decrease by almost 60% [Brewer, 1997] (Fig. 1). The corresponding pH drop would be about 0.4 pH units in surface waters [Caldeira and Wickett, 2003]. Such dramatic changes of the CO
levels could be over 800 ppm [Prentice et al., 2001]. Corresponding models for the oceans indicate that surface-water dissolved inorganic carbon (DIC) could probably increase by more than 12%, and the carbonate ion concentration would decrease by almost 60% [Brewer, 1997] (Fig. 1). The corresponding pH drop would be about 0.4 pH units in surface waters [Caldeira and Wickett, 2003]. Such dramatic changes of the CO![]() system in open-ocean surface waters have probably not occurred for more than 20 million years of Earth's history. If they do occur, they can potentially have significant impacts on the biological systems in the oceans in ways we are only beginning to understand [Seibel and Fabry, 2003].Thus, the delicate balance of marine planktonic species could undergo significant shifts in the future as humankind continues along the path of unintentional CO
system in open-ocean surface waters have probably not occurred for more than 20 million years of Earth's history. If they do occur, they can potentially have significant impacts on the biological systems in the oceans in ways we are only beginning to understand [Seibel and Fabry, 2003].Thus, the delicate balance of marine planktonic species could undergo significant shifts in the future as humankind continues along the path of unintentional CO![]() sequestration in the surface oceans.
sequestration in the surface oceans.
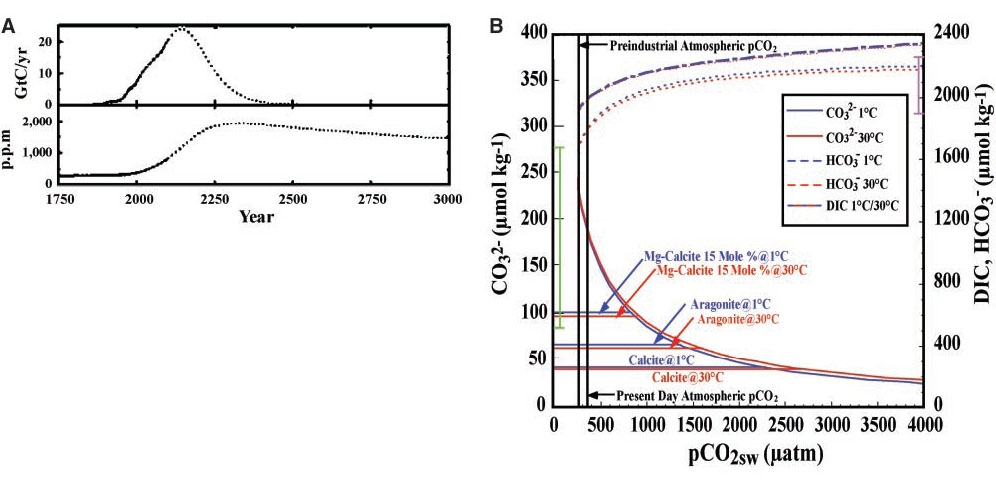
Fig. 1. (A) Atmospheric CO![]() emission scenario and concentrations based on the Los Alamos National Laboratory general circulation model after Caldeira and Wickett [Caldeira and Wickett, 2003]. Gt, gigatons. (B) Relation between the concentrations of carbonate species in surface waters at constant salinity and TA for surface waters spanning the approximate range of temperatures observed in the oceans as a function of the surface ocean pCO
emission scenario and concentrations based on the Los Alamos National Laboratory general circulation model after Caldeira and Wickett [Caldeira and Wickett, 2003]. Gt, gigatons. (B) Relation between the concentrations of carbonate species in surface waters at constant salinity and TA for surface waters spanning the approximate range of temperatures observed in the oceans as a function of the surface ocean pCO![]() in
in ![]() atm. The solid vertical light green line shows the range of carbonate ion concentrations observed in the present-day oceans, and the solid vertical magenta line shows the range of dissolved inorganic carbon concentrations. The three sets of parallel horizontal lines show the equilibrium carbonate ion concentrations for magnesian calcite, aragonite, and calcite saturation, respectively.
atm. The solid vertical light green line shows the range of carbonate ion concentrations observed in the present-day oceans, and the solid vertical magenta line shows the range of dissolved inorganic carbon concentrations. The three sets of parallel horizontal lines show the equilibrium carbonate ion concentrations for magnesian calcite, aragonite, and calcite saturation, respectively.
Concern about the long-term fate of anthropogenic CO![]() in the atmosphere and ocean has motivated scientists to examine the distributions of DIC and total alkalinity (TA) in the oceans. Processes that increase the TA in the upper ocean facilitate the uptake of anthropogenic CO
in the atmosphere and ocean has motivated scientists to examine the distributions of DIC and total alkalinity (TA) in the oceans. Processes that increase the TA in the upper ocean facilitate the uptake of anthropogenic CO![]() from the atmosphere. The dissolution of marine carbonates, including biogenic magnesian calcites (from coralline algae), aragonite (from corals and pteropods), and calcite (from coccolithophorids and foraminifera) neutralizes anthropogenic CO
from the atmosphere. The dissolution of marine carbonates, including biogenic magnesian calcites (from coralline algae), aragonite (from corals and pteropods), and calcite (from coccolithophorids and foraminifera) neutralizes anthropogenic CO![]() and adds to TA via the reaction
and adds to TA via the reaction
![]()
The primary contributors to this reaction are the carbonate shells of marine plankton that are produced in the euphotic zone. Upon death, these carbonate tests fall through the water column and are either dissolved or deposited in shallow or deep-sea sediments. As the oceans become enriched in anthropogenic CO![]() , the locations and extent of dissolution will increase as a function of the decrease in the calcium carbonate (CaCO
, the locations and extent of dissolution will increase as a function of the decrease in the calcium carbonate (CaCO![]() ) saturation state. Until recently, it had been commonly thought that the dissolution of pelagic CaCO
) saturation state. Until recently, it had been commonly thought that the dissolution of pelagic CaCO![]() particles primarily occurs at great depths below the calcite saturation depth [Broecker, 1977]. However, recent analyses of the global carbonate budget and carbonate data for the global oceans [Milliman, 1993; Milliman and Droxler, 1996; Milliman et al., 1999] have indicated that perhaps as much as 60 to 80% of the CaCO
particles primarily occurs at great depths below the calcite saturation depth [Broecker, 1977]. However, recent analyses of the global carbonate budget and carbonate data for the global oceans [Milliman, 1993; Milliman and Droxler, 1996; Milliman et al., 1999] have indicated that perhaps as much as 60 to 80% of the CaCO![]() that is exported out of the surface ocean dissolves in the upper 1000 m.
that is exported out of the surface ocean dissolves in the upper 1000 m.
![]()
where the calcium concentration is estimated from the salinity, and the carbonate ion concentration is calculated from the DIC and TA data. Because the calcium-to-salinity ratio in seawater does not vary by more than 1.5%, variations in the ratio of [CO![]()
![]() ] to the stoichiometric solubility product primarily govern the degree of saturation of seawater with respect to aragonite and calcite (Fig. 2). There is pronounced shoaling of both the aragonite and calcite saturation horizons from the Atlantic through the Indian to the Pacific Oceans because of the higher DIC/TA ratios in the intermediate and deep waters of the Indian and Pacific relative to the Atlantic. This is due to the cumulative enrichment of DIC relative to TA resulting from respiration processes as ocean water circulates along the deep conveyor belt from the Atlantic to Indian and Pacific [Broecker and Peng, 1982; Broecker, 2003]. The intermediate waters of the North Pacific show evidence for undersaturation in the shallow waters from 200 to 1000 m, where they have also been affected by anthropogenic CO
] to the stoichiometric solubility product primarily govern the degree of saturation of seawater with respect to aragonite and calcite (Fig. 2). There is pronounced shoaling of both the aragonite and calcite saturation horizons from the Atlantic through the Indian to the Pacific Oceans because of the higher DIC/TA ratios in the intermediate and deep waters of the Indian and Pacific relative to the Atlantic. This is due to the cumulative enrichment of DIC relative to TA resulting from respiration processes as ocean water circulates along the deep conveyor belt from the Atlantic to Indian and Pacific [Broecker and Peng, 1982; Broecker, 2003]. The intermediate waters of the North Pacific show evidence for undersaturation in the shallow waters from 200 to 1000 m, where they have also been affected by anthropogenic CO![]() [Feely et al., 2002]. Surprisingly, portions of the northern Indian Ocean and southeastern Atlantic Ocean are also undersaturated with respect to aragonite at shallow depths, and this region also appears to be increasing in areal extent as a consequence of anthropogenic CO
[Feely et al., 2002]. Surprisingly, portions of the northern Indian Ocean and southeastern Atlantic Ocean are also undersaturated with respect to aragonite at shallow depths, and this region also appears to be increasing in areal extent as a consequence of anthropogenic CO![]() accumulations [Chung et al., 2003; Chung et al., 2004; Sabine et al., 2002]. This can best be shown by plotting vertical sections of the present-day (solid line) and preindustrial (dashed line) saturation horizons superimposed on the anthropogenic CO
accumulations [Chung et al., 2003; Chung et al., 2004; Sabine et al., 2002]. This can best be shown by plotting vertical sections of the present-day (solid line) and preindustrial (dashed line) saturation horizons superimposed on the anthropogenic CO![]() contours from data collected along the axis of the three basins (Fig. 3). The preindustrial levels are calculated by subtracting the anthropogenic CO
contours from data collected along the axis of the three basins (Fig. 3). The preindustrial levels are calculated by subtracting the anthropogenic CO![]() values from the total DIC. A comparison of the preindustrial and present-day saturation horizons reveals several distinct regions where the undersaturation zone has expanded. In regions between 20°N and 50°N in the North Atlantic Ocean, the aragonite saturation horizon for the preindustrial era is nearly the same as today (Fig. 3). In the eastern South and North Atlantic, however, the aragonite saturation horizon has migrated upward by approximately 80 to 150 m between 50°S and 15°N. In the Indian Ocean, saturation depths have shoaled increasingly north of 30°S, so that aragonite saturation depths in the Arabian Sea and Bay of Bengal are now 100 to 200 m shallower than in preindustrial times. In the Pacific, the upward migration of the aragonite saturation horizon is between 30 and 80 m south of 38°S and between 30 and 100 m north of 3°N. The calcite saturation horizon has also shoaled by about 40 to 100 m north of 20°N in the North Pacific. Such shoaling is due to the effects of anthropogenic CO
values from the total DIC. A comparison of the preindustrial and present-day saturation horizons reveals several distinct regions where the undersaturation zone has expanded. In regions between 20°N and 50°N in the North Atlantic Ocean, the aragonite saturation horizon for the preindustrial era is nearly the same as today (Fig. 3). In the eastern South and North Atlantic, however, the aragonite saturation horizon has migrated upward by approximately 80 to 150 m between 50°S and 15°N. In the Indian Ocean, saturation depths have shoaled increasingly north of 30°S, so that aragonite saturation depths in the Arabian Sea and Bay of Bengal are now 100 to 200 m shallower than in preindustrial times. In the Pacific, the upward migration of the aragonite saturation horizon is between 30 and 80 m south of 38°S and between 30 and 100 m north of 3°N. The calcite saturation horizon has also shoaled by about 40 to 100 m north of 20°N in the North Pacific. Such shoaling is due to the effects of anthropogenic CO![]() ventilation and biological respiration processes in the intermediate waters. This also implies that the dissolution of CaCO
ventilation and biological respiration processes in the intermediate waters. This also implies that the dissolution of CaCO![]() particles will likely increase as the waters become increasingly undersaturated over time.
particles will likely increase as the waters become increasingly undersaturated over time.
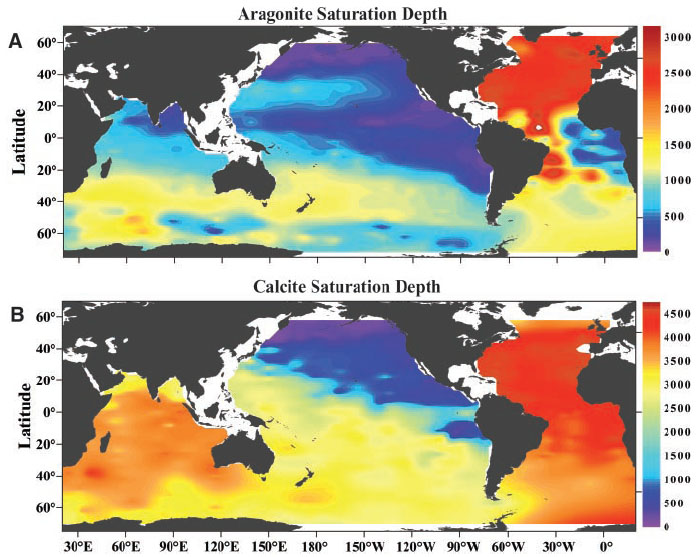
Fig. 2. Distribution of (A) aragonite and (B) calcite saturation depth (![]() = 1) in the global oceans. The pressure effect on the solubility is estimated from the equation of Mucci [Mucci, 1983] that includes the adjustments to the constants recommended by Millero [Millero, 1995]. The level at which aragonite and calcite are in thermodynamic equilibrium is known as the saturation depth. When the degree of saturation,
= 1) in the global oceans. The pressure effect on the solubility is estimated from the equation of Mucci [Mucci, 1983] that includes the adjustments to the constants recommended by Millero [Millero, 1995]. The level at which aragonite and calcite are in thermodynamic equilibrium is known as the saturation depth. When the degree of saturation, ![]() , is greater than 1, seawater is supersaturated with aragonite and calcite; conversely, seawater is undersaturated with respect to these minerals when
, is greater than 1, seawater is supersaturated with aragonite and calcite; conversely, seawater is undersaturated with respect to these minerals when ![]() < 1. This depth is significantly shallower for aragonite than for calcite, because aragonite is more soluble in seawater than calcite.
< 1. This depth is significantly shallower for aragonite than for calcite, because aragonite is more soluble in seawater than calcite.
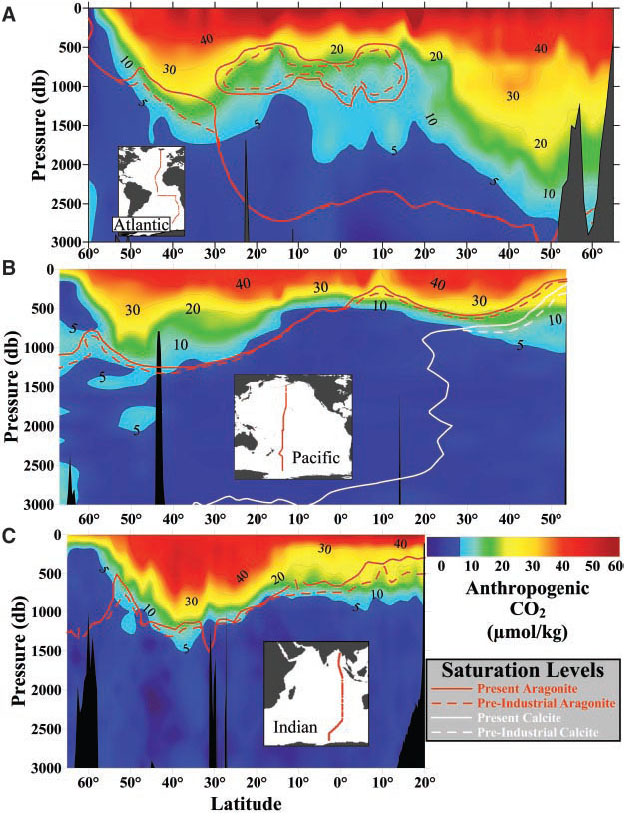
Fig. 3. Vertical distributions of anthropogenic CO![]() concentrations in
concentrations in ![]() mol kg
mol kg![]() and the supersaturation/undersaturation horizons for aragonite and calcite along north-south transects in the (A) Atlantic, (B) Pacific, and (C) Indian Oceans.
and the supersaturation/undersaturation horizons for aragonite and calcite along north-south transects in the (A) Atlantic, (B) Pacific, and (C) Indian Oceans.
![]()
where TAMEAS is the measured TA, TA° is the preformed TA, and AOU is apparent oxygen utilization. The second term on the right-hand side accounts for the decrease in TA resulting from the oxidation of organic matter by using AOU [O![]() (saturated values at a given temperature and salinity) – O
(saturated values at a given temperature and salinity) – O![]() (measured)] and the N/O
(measured)] and the N/O![]() ratio (= 0.094 ± 0.02) [Anderson and Sarmiento, 1994]. A coefficient of 0.63 proposed by Kanamori and Ikegami [Kanamori and Ikegami, 1982] is used to account for TA contributions from the oxidation of organic nitrogen, phosphorus, and sulfur. The TA° is estimated for each ocean basin with a multiparameter linear regression model using conservative tracers, such as salinity and NO or PO, as independent variables. NO is defined as NO = O
ratio (= 0.094 ± 0.02) [Anderson and Sarmiento, 1994]. A coefficient of 0.63 proposed by Kanamori and Ikegami [Kanamori and Ikegami, 1982] is used to account for TA contributions from the oxidation of organic nitrogen, phosphorus, and sulfur. The TA° is estimated for each ocean basin with a multiparameter linear regression model using conservative tracers, such as salinity and NO or PO, as independent variables. NO is defined as NO = O![]() – R
– R![]() × N [Anderson and Sarmiento, 1994]; we used R
× N [Anderson and Sarmiento, 1994]; we used R![]() = –10.625 [Anderson and Sarmiento, 1994]. The standard error (1
= –10.625 [Anderson and Sarmiento, 1994]. The standard error (1![]() ) of the estimated TA° is ~10
) of the estimated TA° is ~10 ![]() mol kg
mol kg![]() .
.
To estimate in situ CaCO![]() dissolution rates in waters where values of
dissolution rates in waters where values of ![]() CaCO
CaCO![]() are positive, we plotted
are positive, we plotted ![]() CaCO
CaCO![]() against water parcel ages derived from chlorofluorocarbon-11 (CFC-11) or CFC-12 for the upper ocean and from
against water parcel ages derived from chlorofluorocarbon-11 (CFC-11) or CFC-12 for the upper ocean and from ![]() C for deep waters where CFC-11 or CFC-12 is not detected [1]. The highest CaCO
C for deep waters where CFC-11 or CFC-12 is not detected [1]. The highest CaCO![]() dissolution rates in the North Atlantic occur near or below the average aragonite saturation horizon at approximately 3500 m (Fig. 4). The change in depth where the maximum rate occurs is consistent with the corresponding changes in the aragonite 100% saturation horizon. In the South Atlantic, CaCO
dissolution rates in the North Atlantic occur near or below the average aragonite saturation horizon at approximately 3500 m (Fig. 4). The change in depth where the maximum rate occurs is consistent with the corresponding changes in the aragonite 100% saturation horizon. In the South Atlantic, CaCO![]() dissolution rates reach a maximum (~0.55
dissolution rates reach a maximum (~0.55 ![]() mol kg
mol kg![]() year
year![]() ) near 900 m, decreasing to less than half that below 1250 m. In the Indian Ocean, the highest CaCO
) near 900 m, decreasing to less than half that below 1250 m. In the Indian Ocean, the highest CaCO![]() dissolution rates occur in shallow waters south of 20°S, with rates ranging from 0 to 1.2
dissolution rates occur in shallow waters south of 20°S, with rates ranging from 0 to 1.2 ![]() mol kg
mol kg![]() year
year![]() occurring between 200 and 1400 m. North of 20°S, the CaCO
occurring between 200 and 1400 m. North of 20°S, the CaCO![]() dissolution maximum corresponds to a depth of about 250 m. In the Pacific, the highest dissolution rates (up to ~1.2
dissolution maximum corresponds to a depth of about 250 m. In the Pacific, the highest dissolution rates (up to ~1.2 ![]() mol kg
mol kg![]() year
year![]() ) occur between 400 and 600 m, within the core of the North Pacific Intermediate Water. Significantly lower rates are observed below these depths. The large spatial differences in the patterns of the dissolution rates between the three major ocean basins appear to be related to the positions of the aragonite and calcite saturation horizons. The integrated carbonate dissolution rate for the three major ocean basins is estimated to be 0.5 ± 0.2 Pg of CaCO
) occur between 400 and 600 m, within the core of the North Pacific Intermediate Water. Significantly lower rates are observed below these depths. The large spatial differences in the patterns of the dissolution rates between the three major ocean basins appear to be related to the positions of the aragonite and calcite saturation horizons. The integrated carbonate dissolution rate for the three major ocean basins is estimated to be 0.5 ± 0.2 Pg of CaCO![]() C year
C year![]() , or about 45 to 65% of the export flux of CaCO
, or about 45 to 65% of the export flux of CaCO![]() in the global oceans.
in the global oceans.
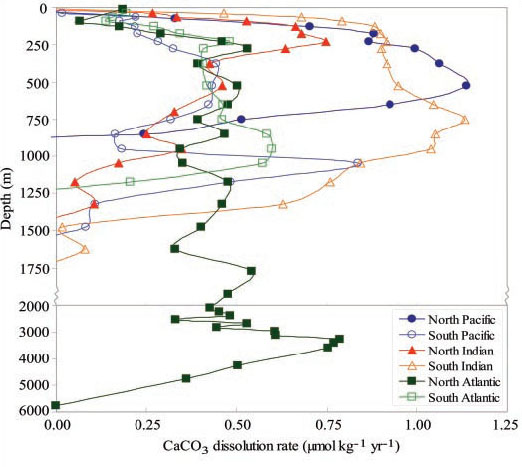
Fig. 4. In situ CaCO![]() dissolution rates plotted as a function of depth in the three major ocean basins.
dissolution rates plotted as a function of depth in the three major ocean basins.
Sediment trap fluxes. Sediment traps measure the rain of particulate matter through the water column. Traps located at different depths at the same location can be used to estimate the dissolution rate of CaCO![]() particles between those two depths. This approach has well-recognized caveats: It assumes that particles fall vertically between one trap and another, that both traps collect particles with equal efficiency, and that particles are not altered inside the trap collection cup. Traps deployed between 100 and 1000 m indicate dissolution rates (Table 1; 0.02 to 0.67
particles between those two depths. This approach has well-recognized caveats: It assumes that particles fall vertically between one trap and another, that both traps collect particles with equal efficiency, and that particles are not altered inside the trap collection cup. Traps deployed between 100 and 1000 m indicate dissolution rates (Table 1; 0.02 to 0.67 ![]() mol kg
mol kg![]() year
year![]() ) that are comparable to the rates presented here. However, sediment traps at any depth, particularly those moored <1000 m below the ocean surface, can have high CaCO
) that are comparable to the rates presented here. However, sediment traps at any depth, particularly those moored <1000 m below the ocean surface, can have high CaCO![]() flux losses and may be suspect because of over- and undertrapping artifacts caused by current turbulence or by the addition of heterotrophs swimming into the trap. Thus, there is a lower degree of confidence in this approach when shallow data are included. The deepwater sediment trap data, also presented in Table 1, are from sites in the equatorial and North Pacific Ocean and represent deployments of paired traps that collected particles for at least 200 days. Generally, traps in deeper water are considered more reliable in collecting vertical particle fluxes. In 9 of 10 data sets, there is evidence of carbonate dissolution occurring in the water column between 1000 and 4500 m in the Pacific Ocean. Dissolution rates in the deep water are low, ranging from 0.003 to 0.03
flux losses and may be suspect because of over- and undertrapping artifacts caused by current turbulence or by the addition of heterotrophs swimming into the trap. Thus, there is a lower degree of confidence in this approach when shallow data are included. The deepwater sediment trap data, also presented in Table 1, are from sites in the equatorial and North Pacific Ocean and represent deployments of paired traps that collected particles for at least 200 days. Generally, traps in deeper water are considered more reliable in collecting vertical particle fluxes. In 9 of 10 data sets, there is evidence of carbonate dissolution occurring in the water column between 1000 and 4500 m in the Pacific Ocean. Dissolution rates in the deep water are low, ranging from 0.003 to 0.03 ![]() mol kg
mol kg![]() year
year![]() . These values are consistent with the estimates of carbonate dissolution in the deep Pacific [Feely et al., 2002] insofar as they do not exceed the water-mass tracer results; the water-mass tracer method allows for dissolution both in the water column and in surface sediments, whereas the trap data measures dissolution in the water column only. The very low particle dissolution rates in the deepwater column of the tropical and subtropical regions imply a greater role for sedimentary dissolution in these areas. In the northeastern subarctic Pacific, however, carbonate particle dissolution in the water column may contribute 20 to 80% of the total dissolution burden predicted by the watermass approach. The highest rate determined by this trap summary is for a site in the northeastern North Pacific, which suggests that water column dissolution may be more important than sediment dissolution at higher latitudes.
. These values are consistent with the estimates of carbonate dissolution in the deep Pacific [Feely et al., 2002] insofar as they do not exceed the water-mass tracer results; the water-mass tracer method allows for dissolution both in the water column and in surface sediments, whereas the trap data measures dissolution in the water column only. The very low particle dissolution rates in the deepwater column of the tropical and subtropical regions imply a greater role for sedimentary dissolution in these areas. In the northeastern subarctic Pacific, however, carbonate particle dissolution in the water column may contribute 20 to 80% of the total dissolution burden predicted by the watermass approach. The highest rate determined by this trap summary is for a site in the northeastern North Pacific, which suggests that water column dissolution may be more important than sediment dissolution at higher latitudes.
Table 1. Sediment trap particulate CaCO![]() dissolution fluxes in the Pacific Ocean. The difference between the mean carbonate flux in the upper trap and the lower trap defines the dissolution flux. In all but one of the deepwater cases, the CaCO
dissolution fluxes in the Pacific Ocean. The difference between the mean carbonate flux in the upper trap and the lower trap defines the dissolution flux. In all but one of the deepwater cases, the CaCO![]() flux collected in the midwater trap is higher than the carbonate flux collected in the deepwater trap. The dissolution rates are derived from the differences in CaCO
flux collected in the midwater trap is higher than the carbonate flux collected in the deepwater trap. The dissolution rates are derived from the differences in CaCO![]() sediment trap fluxes between the upper and lower sediment traps divided by the depth range between the traps.
sediment trap fluxes between the upper and lower sediment traps divided by the depth range between the traps.
CaCO3 budget of the global oceans. The major components of the CaCO![]() budget have recently been reassessed [Sabine et al., 2004; Milliman et al., 1999; Iglesias-Rodriguez et al., 2002] and are summarized in Fig. 5. Global new production of CaCO
budget have recently been reassessed [Sabine et al., 2004; Milliman et al., 1999; Iglesias-Rodriguez et al., 2002] and are summarized in Fig. 5. Global new production of CaCO![]() ranges from 0.8 to 1.4 Pg of CaCO
ranges from 0.8 to 1.4 Pg of CaCO![]() C year
C year![]() [Iglesias-Rodriguez et al., 2002; Lee, 2001], based on models or observations of seasonal changes in alkalinity in the euphotic zone. The most recent updates of globally averaged sediment trap data through 2000 m indicate a global average flux of about 0.4 Pg of CaCO
[Iglesias-Rodriguez et al., 2002; Lee, 2001], based on models or observations of seasonal changes in alkalinity in the euphotic zone. The most recent updates of globally averaged sediment trap data through 2000 m indicate a global average flux of about 0.4 Pg of CaCO![]() C year
C year![]() , suggesting that anywhere from 50 to 71% of the CaCO
, suggesting that anywhere from 50 to 71% of the CaCO![]() produced is dissolved in the upper water column [Iglesias-Rodriguez et al., 2002]. This is consistent with our estimates of the water column dissolution of CaCO
produced is dissolved in the upper water column [Iglesias-Rodriguez et al., 2002]. This is consistent with our estimates of the water column dissolution of CaCO![]() , which show an average dissolution of approximately 0.5 Pg of CaCO
, which show an average dissolution of approximately 0.5 Pg of CaCO![]() C year
C year![]() globally. It is also consistent with the recent summary of the fluxes of foraminiferal CaCO
globally. It is also consistent with the recent summary of the fluxes of foraminiferal CaCO![]() tests in the oceans, which indicates that approximately 65% of the tests are dissolved in the upper 1000 m of the water column [Schiebel, 2002]. The present-day accumulation of CaCO
tests in the oceans, which indicates that approximately 65% of the tests are dissolved in the upper 1000 m of the water column [Schiebel, 2002]. The present-day accumulation of CaCO![]() in marine sediments is about 0.1 to 0.14 Pg of CaCO
in marine sediments is about 0.1 to 0.14 Pg of CaCO![]() C year
C year![]() along the continental margins or in the deep sea, and 0.13 to 0.17 Pg of CaCO
along the continental margins or in the deep sea, and 0.13 to 0.17 Pg of CaCO![]() C year
C year![]() in continental shelf sediments [Milliman et al., 1999; Iglesias-Rodriguez et al., 2002; Catubig et al., 1998]. Thus, of the total amount of CaCO
in continental shelf sediments [Milliman et al., 1999; Iglesias-Rodriguez et al., 2002; Catubig et al., 1998]. Thus, of the total amount of CaCO![]() that is produced annually, no more than about 30% is buried in shallow and deep sediments. The rest is dissolved in the water column, at the sediment-seawater interface or in the upper portion of the sediment column. These new results, however, indicate that a very large fraction of this dissolution, up to 60% or more, occurs in the upper water column above 2000 m.
that is produced annually, no more than about 30% is buried in shallow and deep sediments. The rest is dissolved in the water column, at the sediment-seawater interface or in the upper portion of the sediment column. These new results, however, indicate that a very large fraction of this dissolution, up to 60% or more, occurs in the upper water column above 2000 m.
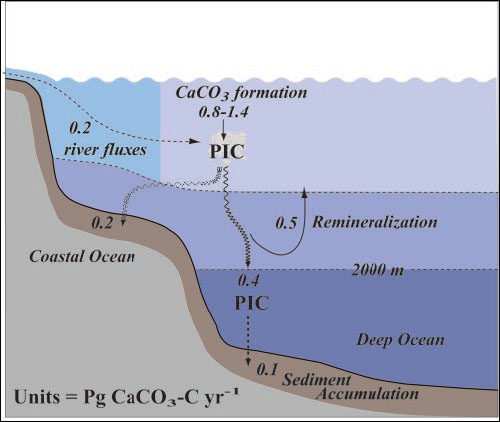
Fig. 5. Schematic diagram of the CaCO![]() budget for the global oceans. The values are in Pg of CaCO
budget for the global oceans. The values are in Pg of CaCO![]() C year
C year![]() .
.
Future impacts. The long-term impacts of anthropogenic CO![]() on the saturation state of the oceans with respect to aragonite and calcite particles in the oceans have been discussed previously [Broecker et al., 1979; Kleypas et al., 1999]. In the cold high-latitude surface waters typical of the subarctic North Pacific, aragonite and calcite undersaturation will occur when partial pressure of CO
on the saturation state of the oceans with respect to aragonite and calcite particles in the oceans have been discussed previously [Broecker et al., 1979; Kleypas et al., 1999]. In the cold high-latitude surface waters typical of the subarctic North Pacific, aragonite and calcite undersaturation will occur when partial pressure of CO![]() (pCO
(pCO![]() ) values reach 1200 and 1900
) values reach 1200 and 1900 ![]() atm, respectively, and in warm tropical and subtropical waters when pCO
atm, respectively, and in warm tropical and subtropical waters when pCO![]() values reach 1700 and 2800
values reach 1700 and 2800 ![]() atm, respectively (Fig. 1). These values are greater than what is normally observed in present-day surface waters [Takahashi et al., 2002], but if present trends in anthropogenic CO
atm, respectively (Fig. 1). These values are greater than what is normally observed in present-day surface waters [Takahashi et al., 2002], but if present trends in anthropogenic CO![]() continue for the next several hundred years, we can expect regions of aragonite undersaturation to develop in the northern subarctic surface waters, followed by calcite undersaturation. This would first occur in the winter, when pCO
continue for the next several hundred years, we can expect regions of aragonite undersaturation to develop in the northern subarctic surface waters, followed by calcite undersaturation. This would first occur in the winter, when pCO![]() values are highest because of cold temperatures and wind-driven mixing of subsurface waters into the mixed layer. From there, the progression of undersaturated regions would proceed toward the equator, although it is unlikely that the tropical and warmest subtropical surface waters will ever become undersaturated with respect to calcite, because model projections of CO
values are highest because of cold temperatures and wind-driven mixing of subsurface waters into the mixed layer. From there, the progression of undersaturated regions would proceed toward the equator, although it is unlikely that the tropical and warmest subtropical surface waters will ever become undersaturated with respect to calcite, because model projections of CO![]() emissions predict an upper limit of atmospheric CO
emissions predict an upper limit of atmospheric CO![]() of about 2000
of about 2000 ![]() atm [Caldeira and Wickett, 2003]. Nevertheless, large-scale decreases in the aragonite and calcite saturation values over the global oceans can have profound impacts on calcification rates for many species of CaCO
atm [Caldeira and Wickett, 2003]. Nevertheless, large-scale decreases in the aragonite and calcite saturation values over the global oceans can have profound impacts on calcification rates for many species of CaCO![]() shell-forming organisms.
shell-forming organisms.
Biological implications. Because the upper ocean is supersaturated with respect to all phases of CaCO![]() , carbonate chemistry was not previously considered as a limiting factor in biogenic calcification. Recent field and laboratory studies (table S1), however, reveal that the degree of supersaturation has a profound effect on the calcification rates of individual species and communities in both planktonic and benthic habitats. With one exception [Reynaud et al., 2003], the calcification rate of all calcifying organisms investigated to date decreased in response to a decreased CaCO
, carbonate chemistry was not previously considered as a limiting factor in biogenic calcification. Recent field and laboratory studies (table S1), however, reveal that the degree of supersaturation has a profound effect on the calcification rates of individual species and communities in both planktonic and benthic habitats. With one exception [Reynaud et al., 2003], the calcification rate of all calcifying organisms investigated to date decreased in response to a decreased CaCO![]() saturation state, even when the carbonate saturation level was >1. This response holds across multiple taxa—from single-celled protists to reef-building corals—and across all CaCO
saturation state, even when the carbonate saturation level was >1. This response holds across multiple taxa—from single-celled protists to reef-building corals—and across all CaCO![]() mineral phases. Differences in the response of calcifiers to decreasing carbonate ion concentrations may reflect differences in carbonate mineralogy; in environmental parameters such as temperature, light, and available nutrients [Marubini et al., 2001; Sciandra et al., 2003]; and in the mechanism of biomineralization [Simkiss and Wilbur, 1989; Lowenstam and Weiner, 1989].
mineral phases. Differences in the response of calcifiers to decreasing carbonate ion concentrations may reflect differences in carbonate mineralogy; in environmental parameters such as temperature, light, and available nutrients [Marubini et al., 2001; Sciandra et al., 2003]; and in the mechanism of biomineralization [Simkiss and Wilbur, 1989; Lowenstam and Weiner, 1989].
Aragonite and magnesian calcite are at least 50% more soluble in seawater than calcite [Mucci, 1983], suggesting that organisms that form these types of CaCO![]() may be particularly affected by increasing pCO
may be particularly affected by increasing pCO![]() . Coralline algae, a major source of biogenic magnesian calcite, show a strong calcification response to decreases in saturation state. The main aragonite producers are reef-building corals and planktonic pteropod and heteropod molluscs. Nearly all reef-building corals tested so far show a marked decline in calcification under reduced [CO
. Coralline algae, a major source of biogenic magnesian calcite, show a strong calcification response to decreases in saturation state. The main aragonite producers are reef-building corals and planktonic pteropod and heteropod molluscs. Nearly all reef-building corals tested so far show a marked decline in calcification under reduced [CO![]()
![]() ] conditions [Marubini et al., 2001; Langdon et al., 2000; Marubini and Thake, 1999], and one of us (V.F.) has observed shell dissolution in living Clio pyramidata, a pteropod in the subarctic North Pacific, as increasing respiratory CO
] conditions [Marubini et al., 2001; Langdon et al., 2000; Marubini and Thake, 1999], and one of us (V.F.) has observed shell dissolution in living Clio pyramidata, a pteropod in the subarctic North Pacific, as increasing respiratory CO![]() forced aragonite saturation to <1 (fig. S1). The effects of elevated CO
forced aragonite saturation to <1 (fig. S1). The effects of elevated CO![]() on other producers of aragonite and magnesian calcite, including calcareous green algae, echinoderms, bryozoans, and benthic foraminifera, are unknown. Although these labile carbonate producers are associated with benthic habitats, in the North Atlantic many of them are also found in the open ocean encrusting on Sargassum clumps [Spindler, 1980; Pestana, 1985; Fabry and Deuser, 1991].
on other producers of aragonite and magnesian calcite, including calcareous green algae, echinoderms, bryozoans, and benthic foraminifera, are unknown. Although these labile carbonate producers are associated with benthic habitats, in the North Atlantic many of them are also found in the open ocean encrusting on Sargassum clumps [Spindler, 1980; Pestana, 1985; Fabry and Deuser, 1991].
Calcite is secreted by two important planktonic calcifiers—coccolithophores and foraminiferans—and species in both groups appear to be sensitive to changes in seawater carbonate chemistry. The calcification rates of two bloomforming coccolithophores, Emiliania huxleyi and Gephyrocapsa oceanica, decreased by 25 and 45%, respectively, when grown at pCO![]() concentrations that were three times the preindustrial values [Riebesell et al., 2000; Zondervan et al., 2001]. Shell weights of similarly sized planktonic foraminiferans have also been shown to vary because of the effects of seawater carbonate chemistry on both biological calcification and dissolution [Spero et al., 1997; Barker and Elderfield, 2002]. The available empirical evidence suggests that the relation between calcification and carbonate ion concentration in these coccolithophore and foraminiferan species is asymptotic, implying that reduction of the carbonate saturation state below a threshold value will lead to large decreases in calcification rates, even when saturation is >1.
concentrations that were three times the preindustrial values [Riebesell et al., 2000; Zondervan et al., 2001]. Shell weights of similarly sized planktonic foraminiferans have also been shown to vary because of the effects of seawater carbonate chemistry on both biological calcification and dissolution [Spero et al., 1997; Barker and Elderfield, 2002]. The available empirical evidence suggests that the relation between calcification and carbonate ion concentration in these coccolithophore and foraminiferan species is asymptotic, implying that reduction of the carbonate saturation state below a threshold value will lead to large decreases in calcification rates, even when saturation is >1.
At the global scale, calcium carbonate plays a dual role in regulating carbon sequestration by the oceans. First, an increase in CaCO![]() dissolution in the upper ocean will result in a more uniform alkalinity profile with depth. Presently, the TA of temperate surface waters is about 50 to 150
dissolution in the upper ocean will result in a more uniform alkalinity profile with depth. Presently, the TA of temperate surface waters is about 50 to 150 ![]() mol kg
mol kg![]() less than in the deep oceans because carbonate precipitation in the upper ocean removes alkalinity, whereas dissolution of calcium carbonate at depth increases alkalinity. Moreover, a decrease in carbonate precipitation in the upper ocean would increase the capacity of the oceans to take up CO
less than in the deep oceans because carbonate precipitation in the upper ocean removes alkalinity, whereas dissolution of calcium carbonate at depth increases alkalinity. Moreover, a decrease in carbonate precipitation in the upper ocean would increase the capacity of the oceans to take up CO![]() from the atmosphere. A complete shutdown of surface ocean calcification would decrease surface ocean pCO
from the atmosphere. A complete shutdown of surface ocean calcification would decrease surface ocean pCO![]() by about 10 to 20
by about 10 to 20 ![]() atm [Gruber et al., 2004]. Second, a decrease in CaCO
atm [Gruber et al., 2004]. Second, a decrease in CaCO![]() production would affect the ratio of organic:inorganic carbon delivery to the deep sea. If the processes regulating the "rain" of organic carbon and inorganic carbon to deep-sea sediments are uncoupled, then a decrease in calcium carbonate production would lead to increased dissolution of calcium carbonate sediments, which would raise ocean pH and its capacity to store CO
production would affect the ratio of organic:inorganic carbon delivery to the deep sea. If the processes regulating the "rain" of organic carbon and inorganic carbon to deep-sea sediments are uncoupled, then a decrease in calcium carbonate production would lead to increased dissolution of calcium carbonate sediments, which would raise ocean pH and its capacity to store CO![]() [Archer and Maier-Reimer, 1994]. If the two processes are coupled, such as through the process of CaCO
[Archer and Maier-Reimer, 1994]. If the two processes are coupled, such as through the process of CaCO![]() ballasting of organic carbon [Armstrong et al., 2002], then reducing the carbonate production could result in shallower remineralization of organic carbon [Ridgwell, 2003] and a diminished role of sediments in buffering increases in atmospheric CO
ballasting of organic carbon [Armstrong et al., 2002], then reducing the carbonate production could result in shallower remineralization of organic carbon [Ridgwell, 2003] and a diminished role of sediments in buffering increases in atmospheric CO![]() . Clearly, more research on the mechanistic controls of these seemingly coupled processes is needed.
. Clearly, more research on the mechanistic controls of these seemingly coupled processes is needed.
L. A. Anderson, J. L. Sarmiento, Global Biogeochem. Cycles 8, 65(1994).
D. Archer, E. Maier-Reimer, Nature 367, 260 (1994).
R. A. Armstrong, C. Lee, J. I. Hedges, S. Honjo, S. G. Wakeham, Deep-Sea Res. 49, 219 (2002).
S. Barker, H. Elderfield, Science 297, 833 (2002).
P. R. Betzer et al., Science 224, 1074 (1984).
P. G. Brewer, Geophys. Res. Lett. 24, 1367 (1997).
W. S. Broecker, in The Fate of Fossil CO2 in the Oceans, N. R. Anderson, A. Malahoff, Eds. (Plenum, New York, 1977), pp. 207–212.
W. S. Broecker, in Treatise on Geochemistry, H. D. Holland, K. K. Turekian, Eds. (Elsevier, London, vol. 6, 2003), pp. 1–21.
W. S. Broecker, T.-H. Peng, Tracers in the Sea (Lamont-Doherty Geological Observatory, Palisades, New York, 1982).
W. S. Broecker, T. Takahashi, H. J. Simpson, T.-H. Peng, Science 206, 409 (1979).
K. Caldeira, M. E. Wickett, Nature 425, 365(2003).
N. R. Catubig et al., Paleoceanography 13, 298 (1998).
S. Chung et al., Global Biogeochem. Cycles 17, 1093 (2003).
S.-N. Chung et al., Limnol. Oceanogr. 49, 315(2004).
V. J. Fabry, W. G. Deuser, Deep-Sea Res. Part A 38, 713 (1991).
R. A. Feely et al., Global Biogeochem. Cycles 16, 1144 (2002).
N. Gruber et al., in The Global Carbon Cycle: Integrating Humans, Climate, and The Natural World. SCOPE 62, C. B. Field, M. R. Raupach, Eds. (Island Press, Washington, DC, 2004), pp. 45–76.
S. Honjo, J. Dymond, R. Collier, S. Manganini, Deep- Sea Res. 42, 831 (1995).
D. Iglesias-Rodriguez et al., Eos 83, 365(2002).
S. Kanamori, H. Ikegami, J. Oceanogr. Soc. Jpn. 38, 57 (1982).
H. Kawahata, A. Suzuki, H. Ohta, Deep-Sea Res. 47, 2061 (2000).
J. A. Kleypas et al., Science 284, 118 (1999).
C. Langdon et al., Global Biogeochem. Cycles 14, 639 (2000).
K. Lee, Limnol. Oceanogr. 46, 1287 (2001).
H. A. Lowenstam, S. Weiner, On Biomineralization (Oxford Univ. Press, Oxford, 1989).
F. Marubini, H. Barnett, C. Langdon, M. J. Atkinson, Mar. Ecol. Prog. Ser. 220, 153 (2001).
F. Marubini, B. Thake, Limnol. Oceanogr. 44, 716 (1999).
F. J. Millero, Geochim. Cosmochim. Acta 59, 661 (1995).
J. D. Milliman, Global Biogeochem. Cycles 7, 927 (1993).
J. D. Milliman, A. W. Droxler, Geol. Rundsch. 85, 496 (1996).
J. D. Milliman et al., Deep-Sea Res. Part I 46, 1653 (1999).
A. Mucci, Am. J. Sci. 238, 780 (1983).
S. Noriki, K. Hamahara, K. Harada, J. Oceanogr. 55, 693 (1999).
H. Pestana, J. Sediment. Petrol. 55, 184 (1985).
C. Prentice et al., in Climate Change 2001: The Scientific Basis, Contribution of Working Group I to the Third Assessment Report of the Intergovernmental Panel on Climate Change, J. Houghton et al., Eds. (Cambridge Univ. Press, New York, 2001), pp. 183–238.
S. Reynaud et al., Global Change Biol. 9, 1 (2003).
A. J. Ridgwell, Geochem. Geophys. Geosyst. 4, 1051 (2003).
U. Riebesell et al., Nature 407, 364 (2000).
M. Rodier, R. LeBorgne, Deep-Sea Res. Part II 44, 2085 (1997).
C. L. Sabine, R. M. Key, R. A. Feely, D. Greeley, Global Biogeochem. Cycles 16, 1067 (2002).
C. L. Sabine et al., in The Global Carbon Cycle: Integrating Humans, Climate, And The Natural World. SCOPE 62, C. B. Field, M. R. Raupach Eds. (Island Press, Washington, DC, 2004), pp. 17–46.
R. Schiebel, Global Biogeochem. Cycles 16, 10.1029/2001GB001459 (2002).
A. Sciandra et al., Mar. Ecol. Prog. Ser. 261, 111 (2003).
B. A. Seibel, V. J. Fabry, in Climate Change and Biodiversity: Synergistic Impacts, L. Hannah, T. Lovejoy, Eds. (Conservation International, Washington, DC, 2003), pp. 59–67.
K. Simkiss, K. M. Wilbur, Biomineralization (Academic Press, New York, 1989).
H. J. Spero, J. Bijma, D. W. Lea, B. E. Bemis, Nature 390, 497 (1997).
M. Spindler, Neues Jahrb. Geol. Palaontol. Mh. 9, 659 (1980).
T. Takahashi et al., Deep-Sea Res. Part II 49, 1601 (2002).
S. Tsunogai, S. Noriki, Tellus Ser. B Chem. Phys. Meteorol. 43, 256 (1991).
C. S. Wong et al., Deep-Sea Res. 46, 2735 (1999).
I. Zondervan, R. E. Zeebe, B. Rost, U. Riebesell, Global Biogeochem. Cycles 15, 507 (2001).
Notes
The details of the methods for determining the CaCO![]() dissolution are given in the supporting online materials.
dissolution are given in the supporting online materials.
We thank all of those that contributed to the global data set compiled for this project, including those responsible for the hydrographic, nutrient, oxygen, carbon, and CFC measurements and the chief scientists. This work was funded by grants from the National Oceanic and Atmospheric Administration, the National Science Foundation, and the Department of Energy. Partial support for K.L. was also provided by the Advanced Environmental Biotechnical Research Center at Pohung University of Science and Technology. This is Pacific Marine Environmental Laboratory contribution number 2633.
Supporting Online Materialwww.sciencemag.org/cgi/content/full/305/5682/362/DC1
SOM Text
Fig. S1
Table S1
References
___________
*To whom correspondence should be addressed. Email: richard.a.feely@noaa.gov
Figure CaptionsFig. 1. (A) Atmospheric CO![]() emission scenario and concentrations based on the Los Alamos National Laboratory general circulation model after Caldeira and Wickett [Caldeira and Wickett, 2003]. Gt, gigatons. (B) Relation between the concentrations of carbonate species in surface waters at constant salinity and TA for surface waters spanning the approximate range of temperatures observed in the oceans as a function of the surface ocean pCO
emission scenario and concentrations based on the Los Alamos National Laboratory general circulation model after Caldeira and Wickett [Caldeira and Wickett, 2003]. Gt, gigatons. (B) Relation between the concentrations of carbonate species in surface waters at constant salinity and TA for surface waters spanning the approximate range of temperatures observed in the oceans as a function of the surface ocean pCO![]() in
in ![]() atm. The solid vertical light green line shows the range of carbonate ion concentrations observed in the present-day oceans, and the solid vertical magenta line shows the range of dissolved inorganic carbon concentrations. The three sets of parallel horizontal lines show the equilibrium carbonate ion concentrations for magnesian calcite, aragonite, and calcite saturation, respectively.
atm. The solid vertical light green line shows the range of carbonate ion concentrations observed in the present-day oceans, and the solid vertical magenta line shows the range of dissolved inorganic carbon concentrations. The three sets of parallel horizontal lines show the equilibrium carbonate ion concentrations for magnesian calcite, aragonite, and calcite saturation, respectively.
Fig. 2. Distribution of (A) aragonite and (B) calcite saturation depth (![]() = 1) in the global oceans. The pressure effect on the solubility is estimated from the equation of Mucci [Mucci, 1983] that includes the adjustments to the constants recommended by Millero [Millero, 1995]. The level at which aragonite and calcite are in thermodynamic equilibrium is known as the saturation depth. When the degree of saturation,
= 1) in the global oceans. The pressure effect on the solubility is estimated from the equation of Mucci [Mucci, 1983] that includes the adjustments to the constants recommended by Millero [Millero, 1995]. The level at which aragonite and calcite are in thermodynamic equilibrium is known as the saturation depth. When the degree of saturation, ![]() , is greater than 1, seawater is supersaturated with aragonite and calcite; conversely, seawater is undersaturated with respect to these minerals when
, is greater than 1, seawater is supersaturated with aragonite and calcite; conversely, seawater is undersaturated with respect to these minerals when ![]() < 1. This depth is significantly shallower for aragonite than for calcite, because aragonite is more soluble in seawater than calcite.
< 1. This depth is significantly shallower for aragonite than for calcite, because aragonite is more soluble in seawater than calcite.
Fig. 3. Vertical distributions of anthropogenic CO![]() concentrations in
concentrations in ![]() mol kg
mol kg![]() and the supersaturation/ undersaturation horizons for aragonite and calcite along north-south transects in the (A) Atlantic, (B) Pacific, and (C) Indian Oceans.
and the supersaturation/ undersaturation horizons for aragonite and calcite along north-south transects in the (A) Atlantic, (B) Pacific, and (C) Indian Oceans.
Fig. 4. In situ CaCO![]() dissolution rates plotted as a function of depth in the three major ocean basins.
dissolution rates plotted as a function of depth in the three major ocean basins.
Fig. 5. Schematic diagram of the CaCO![]() budget for the global oceans. The values are in Pg of CaCO
budget for the global oceans. The values are in Pg of CaCO![]() C year
C year![]() .
.
Table 1. Sediment trap particulate CaCO![]() dissolution fluxes in the Pacific Ocean. The difference between the mean carbonate flux in the upper trap and the lower trap defines the dissolution flux. In all but one of the deepwater cases, the CaCO
dissolution fluxes in the Pacific Ocean. The difference between the mean carbonate flux in the upper trap and the lower trap defines the dissolution flux. In all but one of the deepwater cases, the CaCO![]() flux collected in the midwater trap is higher than the carbonate flux collected in the deepwater trap. The dissolution rates are derived from the differences in CaCO
flux collected in the midwater trap is higher than the carbonate flux collected in the deepwater trap. The dissolution rates are derived from the differences in CaCO![]() sediment trap fluxes between the upper and lower sediment traps divided by the depth range between the traps.
sediment trap fluxes between the upper and lower sediment traps divided by the depth range between the traps.
Return to Abstract