To illustrate the sensitivity of the gas transfer velocity and thus the sea-air
CO![]() flux to wind
speed, we have estimated the regional and global net sea-air CO
flux to wind
speed, we have estimated the regional and global net sea-air CO![]() fluxes
using two different formulations for the CO
fluxes
using two different formulations for the CO![]() gas
transfer coefficient across the sea-air interface: the quadratic U
gas
transfer coefficient across the sea-air interface: the quadratic U![]() dependence
of W-92 and the cubic U
dependence
of W-92 and the cubic U![]() dependence
of W&M-99. In addition, we have demonstrated the effects of wind-speed
fields on the computed sea-air CO
dependence
of W&M-99. In addition, we have demonstrated the effects of wind-speed
fields on the computed sea-air CO![]() flux
using the National Center for Environmental Prediction (NCEP)-41 mean monthly
wind speed and the NCEP-1995 mean monthly wind speed distributions over 4° × 5° pixel
areas.
flux
using the National Center for Environmental Prediction (NCEP)-41 mean monthly
wind speed and the NCEP-1995 mean monthly wind speed distributions over 4° × 5° pixel
areas.
In Table 2 the fluxes computed using the
W-92 and the NCEP/National Center for Atmospheric Research (NCAR) 41-year mean
wind are listed in the first row for each grouping in column one (for latitudinal
bands, oceanic regions and regional flux). The column "Errors in Flux" located
at the extreme right of Table 2 lists the
deviations from the mean flux that have been determined by adding or subtracting
one standard deviation of the wind speed (about ±2 m sec![]() on
the global average) from the mean monthly wind speed in each pixel area. These
changes in wind speeds affect the regional and global flux values by about ±25%.
The fluxes computed using the single year mean wind speed data for 1995 are
listed in the second line in each column one grouping in the table.
on
the global average) from the mean monthly wind speed in each pixel area. These
changes in wind speeds affect the regional and global flux values by about ±25%.
The fluxes computed using the single year mean wind speed data for 1995 are
listed in the second line in each column one grouping in the table.
The global ocean uptake estimated using the W-92 and the NCEP 41-yr mean wind
speeds is –2.2 ± 0.4 Pg C yr![]() .
This is consistent with the ocean uptake flux of –2.0 ± 0.6 Pg
C yr
.
This is consistent with the ocean uptake flux of –2.0 ± 0.6 Pg
C yr![]() during
the 1990s (Keeling
et al., 1996; Battle
et al., 2000) estimated from observed changes in the atmospheric CO
during
the 1990s (Keeling
et al., 1996; Battle
et al., 2000) estimated from observed changes in the atmospheric CO![]() and
oxygen variations.
and
oxygen variations.
The wind speeds for 1995 are much lower than the 41-year mean in the northern
hemisphere and higher over the Southern Ocean. Accordingly, the northern ocean
uptake of CO![]() is
weaker than the climatological mean, and the Southern Ocean uptake is stronger.
The global mean ocean uptake flux of –1.8 Pg C yr
is
weaker than the climatological mean, and the Southern Ocean uptake is stronger.
The global mean ocean uptake flux of –1.8 Pg C yr![]() using
the NCEP-1995 winds is about 18% below the climatological mean of –2.2 Pg C
yr
using
the NCEP-1995 winds is about 18% below the climatological mean of –2.2 Pg C
yr![]() ,
but it is within the ±25% error estimated from the standard deviation
of the 41-yr mean wind speed data.
,
but it is within the ±25% error estimated from the standard deviation
of the 41-yr mean wind speed data.
When the cubic wind speed dependence (W&M-99) is used, the CO![]() fluxes
in higher latitude areas with strong winds are increased by about 50%, as are
the errors associated with wind speed variability. The global ocean uptake
flux computed with the 41-year mean wind speed data and the NCEP-1995 wind
data is –3.7 Pg C yr
fluxes
in higher latitude areas with strong winds are increased by about 50%, as are
the errors associated with wind speed variability. The global ocean uptake
flux computed with the 41-year mean wind speed data and the NCEP-1995 wind
data is –3.7 Pg C yr![]() and
–3.0 Pg C yr
and
–3.0 Pg C yr![]() respectively,
an increase of about 70% over the fluxes computed from the W-92 dependence.
These flux values are significantly greater than the flux based on atmospheric
CO
respectively,
an increase of about 70% over the fluxes computed from the W-92 dependence.
These flux values are significantly greater than the flux based on atmospheric
CO![]() and oxygen
data (Keeling
et al., 1996; Battle
et al., 2000). However, the relative magnitudes of CO
and oxygen
data (Keeling
et al., 1996; Battle
et al., 2000). However, the relative magnitudes of CO![]() uptake
by ocean basins (shown in % in the regional flux grouping in the last four
rows of Table 2) remain nearly unaffected
by the choice of the wind-speed dependence of the gas transfer velocity.
uptake
by ocean basins (shown in % in the regional flux grouping in the last four
rows of Table 2) remain nearly unaffected
by the choice of the wind-speed dependence of the gas transfer velocity.
The distribution of winds can also influence the calculated gas transfer velocity.
This is because of the nonlinear dependence of gas exchange with wind speed;
long-term average winds underestimate flux especially for strongly non-linear
dependencies. To avoid this bias, the relationships are adjusted by assuming
that the global average wind speed is well represented by a Rayleigh distribution
function. As noted by Wanninkhof
et al. (2001), this overestimates the flux. A more appropriate way
to deal with the issue of wind speed variability is to use short-term winds.
If the NCEP 6-hour wind products are used, the global flux computed using the
W&M-99 cubic wind-speed formulation decreases from –3.7 to –3.0
Pg C yr![]() for
the NCEP 41-year winds and from –3.0 to –2.3 Pg C yr
for
the NCEP 41-year winds and from –3.0 to –2.3 Pg C yr![]() for
the NCEP 1995 wind data.
for
the NCEP 1995 wind data.
The relative importance of the major ocean basins in the ocean uptake of CO![]() may
be assessed on the basis of the CO
may
be assessed on the basis of the CO![]() fluxes
obtained from our pCO
fluxes
obtained from our pCO![]() data
and W-92 gas transfer velocity (Table 2 and Figure
6). The Atlantic Ocean as a whole, which has 23.5% of the global ocean
area, is the region with the strongest net CO
data
and W-92 gas transfer velocity (Table 2 and Figure
6). The Atlantic Ocean as a whole, which has 23.5% of the global ocean
area, is the region with the strongest net CO![]() uptake
(41%). The high-latitude northern North Atlantic, including the Greenland,
Iceland and Norwegian seas, is responsible for a substantial amount of this
CO
uptake
(41%). The high-latitude northern North Atlantic, including the Greenland,
Iceland and Norwegian seas, is responsible for a substantial amount of this
CO![]() uptake while
representing only 5% of the global ocean in area. This reflects a combination
of two factors: the intense summertime primary production and the low CO
uptake while
representing only 5% of the global ocean in area. This reflects a combination
of two factors: the intense summertime primary production and the low CO![]() concentrations
in subsurface waters associated with recent ventilation of North Atlantic subsurface
waters. The Pacific Ocean as a whole takes up the smallest amount of CO
concentrations
in subsurface waters associated with recent ventilation of North Atlantic subsurface
waters. The Pacific Ocean as a whole takes up the smallest amount of CO![]() (18%
of the total) in spite of its size (49% of the total ocean area). This is because
mid-latitude uptake (about 1.1 Pg C yr
(18%
of the total) in spite of its size (49% of the total ocean area). This is because
mid-latitude uptake (about 1.1 Pg C yr![]() )
is almost compensated for by the large equatorial release of about 0.7 Pg C
yr
)
is almost compensated for by the large equatorial release of about 0.7 Pg C
yr![]() .
If the equatorial flux were totally eliminated, as during very strong El Niño
conditions, the Pacific would take up CO
.
If the equatorial flux were totally eliminated, as during very strong El Niño
conditions, the Pacific would take up CO![]() to
an extent comparable to the entire North and South Atlantic Ocean. The southern
Indian Ocean is a region of strong uptake in spite of its small area (15% of
the total). This may be attributed primarily to the cooling of tropical waters
flowing southward in the western South Indian Ocean.
to
an extent comparable to the entire North and South Atlantic Ocean. The southern
Indian Ocean is a region of strong uptake in spite of its small area (15% of
the total). This may be attributed primarily to the cooling of tropical waters
flowing southward in the western South Indian Ocean.
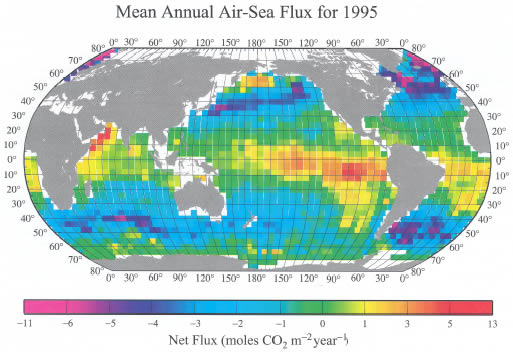
Figure 6. Distribution of the climatological mean annual sea-air CO![]() flux
(moles CO
flux
(moles CO![]() m
m![]() yr
yr![]() )
for the reference year 1995 representing non-El Niño conditions. This
has been computed using the mean monthly distribution of sea-air pCO
)
for the reference year 1995 representing non-El Niño conditions. This
has been computed using the mean monthly distribution of sea-air pCO![]() difference,
the climatological NCEP 41-year mean wind speed and the wind-speed dependence
of the CO
difference,
the climatological NCEP 41-year mean wind speed and the wind-speed dependence
of the CO![]() gas
transfer velocity of Wanninkhof
(1992). The yellow-red colors indicate a region characterized by a net
release of CO
gas
transfer velocity of Wanninkhof
(1992). The yellow-red colors indicate a region characterized by a net
release of CO![]() to
the atmosphere, and the blue-purple colors indicate a region with a net uptake
of CO
to
the atmosphere, and the blue-purple colors indicate a region with a net uptake
of CO![]() from
the atmosphere. This map yields an annual oceanic uptake flux for CO
from
the atmosphere. This map yields an annual oceanic uptake flux for CO![]() of
2.2 ± 0.4 Pg C yr
of
2.2 ± 0.4 Pg C yr![]() .
.
Return to previous section or go to next section