U.S. Dept. of Commerce / NOAA / OAR / PMEL / Publications
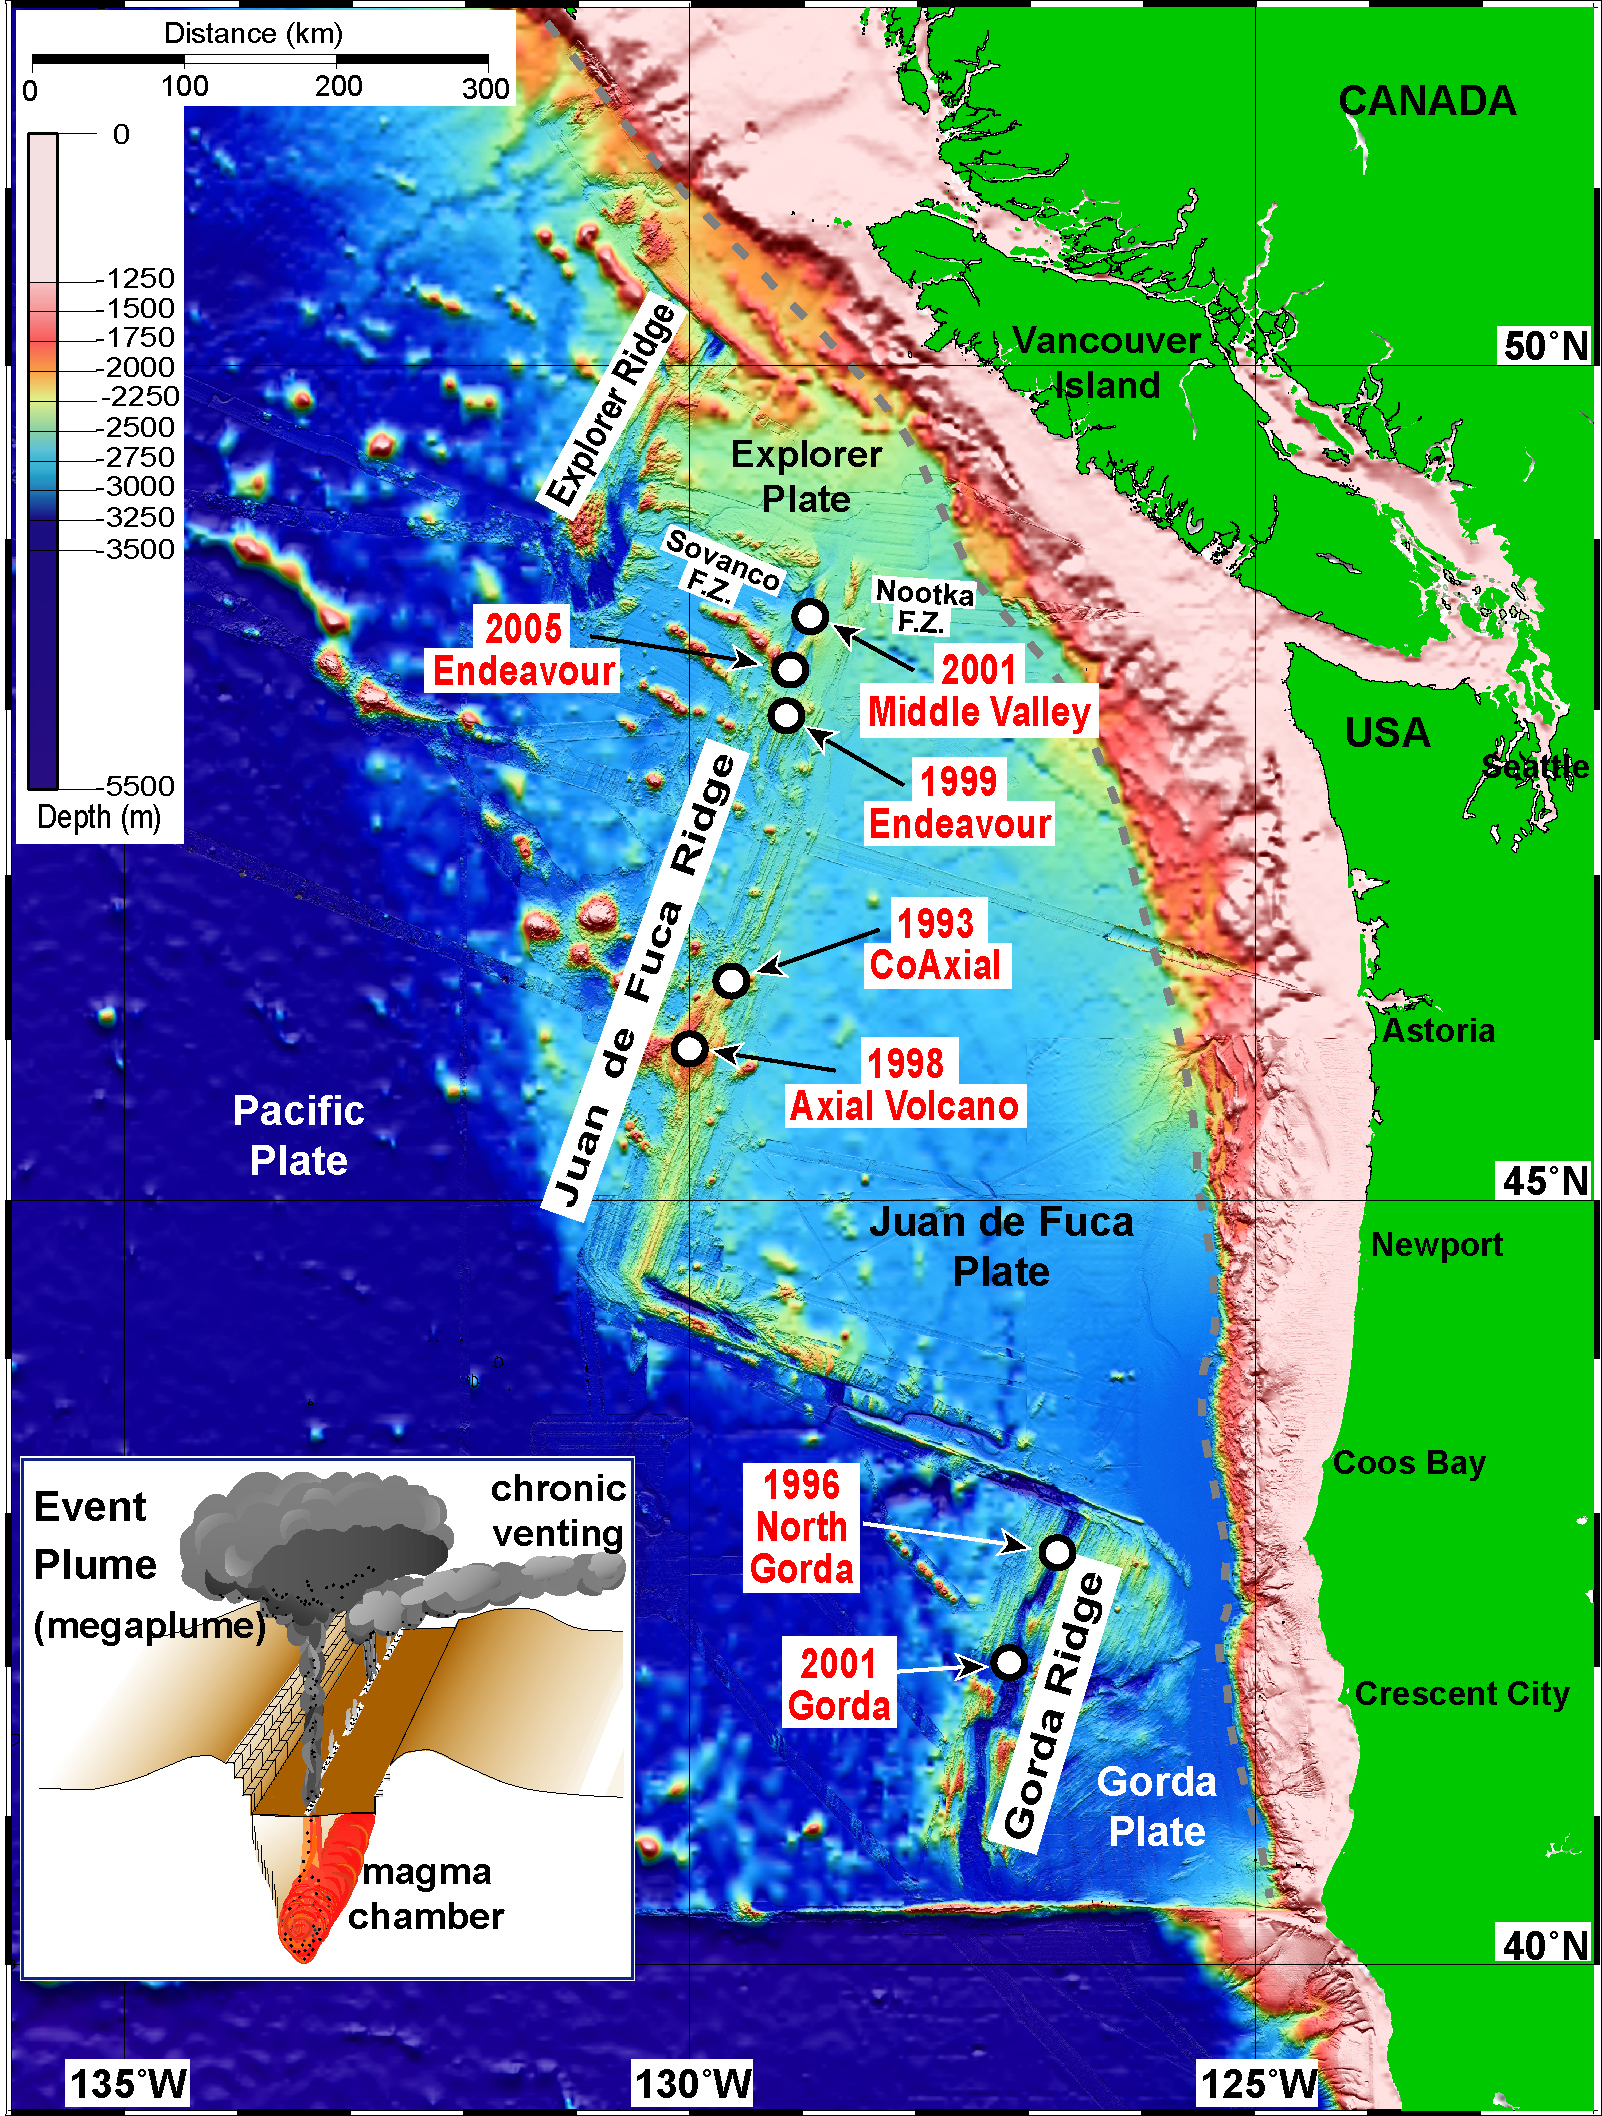
Figure 1. Juan de Fuca and Gorda Ridge map showing location and date of significant earthquake swarms (seafloor spreading events) detected by SOSUS system. All swarms had either a response cruise that investigated the site or preswarm in situ instrumentation. Inset diagram shows cartoon of event and chronic plumes released from a mid-ocean ridge. F.Z.—fracture zone.

Figure 2. Diagrams of earthquake distribution (distance-time) for seven major Juan de Fuca Ridge (JdFR) and Gorda Ridge swarms recorded on SOSUS. Green arrows highlight seismicity migration associated with dike emplacement during each event. Red arrows show arrival date of research cruises for on-site investigations; Endeavor 1999 is the only event without response cruise (in situ sensors). NA on diagrams indicates periods when SOSUS arrays were offline. Onset time of earthquake migration and migration rate for each event were taken from references of each eruption (Table 1). Migration is assumed to begin with first earthquake to occur at a point greater than maximum location error (3.5 km in latitude and 2 km in longitude) away from beginning earthquake of swarm. Evaluation of migration is then derived from regression line fit to earthquake locations. Migration lines shown in Figure 2 are only examples shown to highlight migration directions and rates estimated in original references.
Table 1. Juan de Fuca Ridge seafloor spreading event parameters.
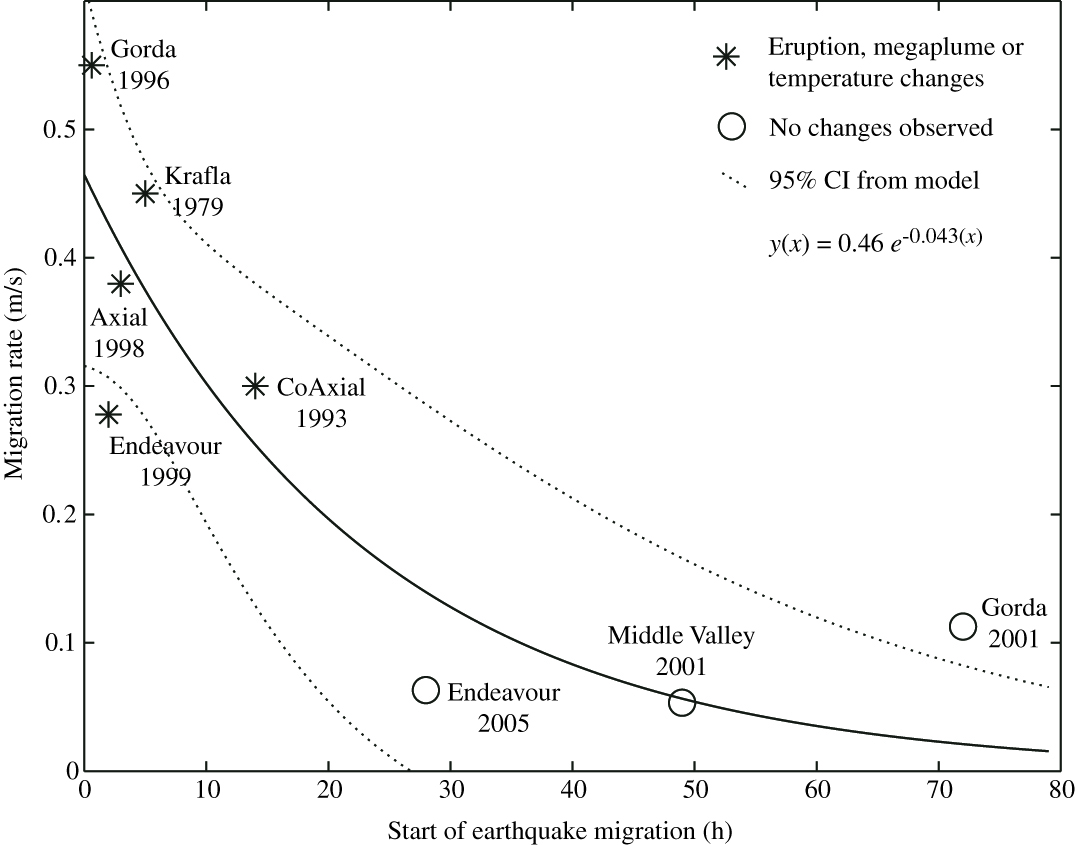
Figure 3. Relationship of earthquake migration rate (m s-1) to onset of migration (hours after beginning of swarm) for swarms shown in Figure 1. Earthquake swarms associated with seafloor eruptions, fluid-temperature changes, or megaplume events are shown as stars; swarms with no clear magmatic activity or megaplumes are circles. Logarithmic decay curve (solid line) and attendant error were derived from nonlinear regression fit of data; dashed line shows 95% confidence interval (Cl) derived from model. Function derived from analysis is shown in upper right; y is migration, and x is time of migration. Subaerial 1979 Krafla (Iceland) dike injection event (Einarsson and Brandsdottir, 1980) is added for comparison.
Return to Abstract
Return to Entire Text