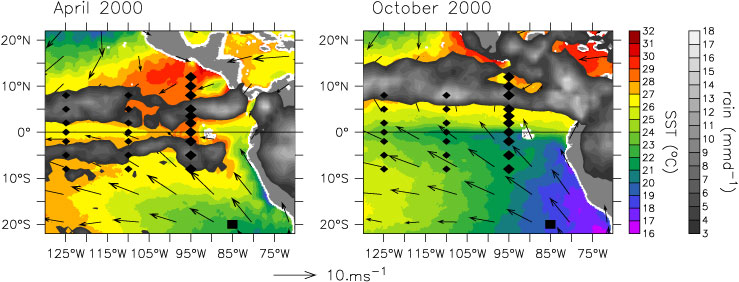
FIG. 1. EPIC mooring array shown in relation to (left) April 2000 and (right) October 2000 TRMM Microwave Imager (TMI) sea surface temperature, TRMM rain rate, and Quick Scatterometer (QuikSCAT) surface winds. Diamonds indicate TAO buoys. Large diamonds indicate EPIC-enhanced 95°W TAO buoys. The Woods Hole IMET buoy is indicated by a large square.
Clouds have both a cooling and warming effect on the earth's surface. Because clouds reflect solar radiation back to space, shortwave (solar) cloud forcing acts as a cooling effect, a reduction in the solar radiation that warms the earth's surface. But clouds also have a warming effect through their emission of longwave infrared (terrestrial) radiation, thereby increasing downwelling longwave radiation at the earth's surface. The relative amount of surface warming and cooling by clouds (i.e., relative amount of longwave and shortwave surface cloud forcing) depends upon many factors including cloud-base height, cloud thickness, background moisture, and aerosol distributions. It is thus not surprising that models have difficulties obtaining realistic radiative properties (Cess et al. 1989, 1990, 1996; Weare 1997; Siebesma et al. 2004.). Indeed, both the Intergovernmental Panel on Climate Change (IPCC) second and third assessment reports state that "the single largest uncertainty in determining the climate sensitivity to either natural or anthropogenic changes are clouds and their effects on radiation and their role in the hydrological cycle" (Kattenberg et al. 1996, p. 345; Moore et al. 2001, p. 776). Both assessments call for comparisons of model simulations with observations.
In this analysis we use surface shortwave and longwave cloud forcing measurements from 11 moorings in the far eastern tropical Pacific to provide benchmarks for satellite, numerical weather prediction models, and atmospheric climate models. The eastern tropical Pacific near the Pan-American landmass is characterized by a complicated meridional cloud structure, with a persistent stratus deck shading the cool Southern Hemisphere waters and deep convection in the intertropical convergence zone (ITCZ) over the warm surface waters north of the equator. Along the equator, upwelling causes a "cold tongue" of water to extend westward from the coast, with a sharp sea surface temperature (SST) front on its northern flank. Because the planetary boundary layer (PBL) tends to be capped by a strong temperature inversion over the cold tongue and to be destabilized over the warm water, the SST front tends to induce a front in the cloud structure (Hashizume et al. 2002; Chelton et al. 2001; Xie et al. 1998; deSzoeke et al. 2005).
The stratus deck/cold tongue/ITCZ complex has a strong seasonal cycle, as illustrated by Fig. 1: When the trade winds weaken during January–March, the cold tongue recedes and a double ITCZ straddling the equator often forms (Lietzke et al. 2001; Zhang 2001). These changes have substantial impacts on fractional cloud cover and type. The eastern tropical Pacific also experiences significant interannual variability, especially in association with El Niño-Southern Oscillation (ENSO). During El Niño warm events, deep convection can occur near the equator and the meridional asymmetry of the cloud structure is weakened (Wallace et al. 1998).
General circulation models (GCMs), although steadily improving, are not able to reproduce much of this structure and variability. Common problems include a warm SST bias in the stratocumulus region, a cool SST bias in the equatorial cold tongue, and a persistent double ITCZ (Mechoso et al. 1995; Lau et al. 1996; Latif et al. 2001; Davey et al. 2002). Poor cloud parameterizations that cause improper cloud formation and/ or clouds with incorrect radiative properties are often suspected of causing many of these biases. In particular, Philander et al. (1996) found that the eastern Pacific ITCZs were sensitive to the parameterization of low-level stratus clouds in the coupled GCM. In a concerted effort to improve these GCMs, a 5-yr experiment, the Eastern Pacific Investigation of Climate Studies (EPIC), was initiated in 1999. As part of enhanced monitoring for EPIC, 11 surface moorings in the far eastern tropical Pacific were equipped with a suite of instrumentation, including shortwave and longwave radiometers. Although some of the moorings suffered losses from fishing-related vandalism, nearly four years of solar and longwave cloud forcing measurements were obtained.
In this paper we use data from the EPIC mooring array to analyze the structure and variability of surface cloud forcing in the eastern tropical Pacific. These in situ radiation fields are compared to the more traditional benchmark radiation dataset from the International Satellite Cloud Climatology Project (ISCCP) and to radiation fields from commonly used numerical weather prediction (NWP) reanalyses, namely the 40-yr European Centre for Medium-Range Weather Forecasting (ECMWF) Re-Analysis (ERA-40) and the National Centers for Environmental Prediction Reanalysis 2 (NCEP2). Discrepancies in the cloud forcing fields from benchmark datasets are analyzed using the corresponding total cloud cover and precipitation fields to identify the prevalence of precipitating and nonprecipitating clouds and the radiative properties of precipitating and nonprecipitating clouds.
Cloud forcing at the surface, CFR![]() , is defined here as the difference between the observed downwelling radiation R
, is defined here as the difference between the observed downwelling radiation R![]() and the downwelling radiation at the surface expected under clear skies (skies with no clouds), R
and the downwelling radiation at the surface expected under clear skies (skies with no clouds), R![]()
![]() :
:
![]()
where the subscript x refers to either the l longwave or s shortwave components. In this section, we describe data sources for surface solar and longwave cloud forcing evaluated from moored buoys, and cloud forcing and total cloud amount fields from ERA-40, NCEP2, and ISCCP. Likewise, we describe the precipitation fields from ERA-40, NCEP2, and the Tropical Rainfall Measuring Mission (TRMM) that are used to identify precipitating and nonprecipitating periods.
a. EPIC data
EPIC moorings used in this analysis include the enhanced Tropical Atmosphere Ocean (TAO) moorings along 95°W (at 8°S, 5°S, 2°S, 0°, 2°N, 3.5°N, 5°N, 8°N, 10°N, 12°N) and the Woods Hole Improved Meteorology (IMET) mooring in the stratus deck region at 20°S, 85°W (Fig. 1). Both mooring types have similar suites of surface instrumentation (Hosom et al. 1995; McPhaden et al. 1998; Payne et al. 2002; Cronin et al. 2002) including solar and longwave radiation (the primary variables in this analysis), wind speed and direction, air temperature, relative humidity, barometric pressure, rain rate, and sea surface temperature.
Both TAO and IMET systems used Eppley Laboratories, Inc., Precision Spectral Pyranometers (PSPs) to monitor downwelling shortwave radiation and the Precision Infrared Radiometers (PIRs) to monitor downwelling longwave radiation. Although the IMET and TAO systems each had slightly different mounting, electronic designs, and calibration procedures (Payne et al. 2002), both PIR systems computed downwelling longwave radiation from thermopile voltage, dome temperature, and casing temperature measurements (Fairall et al. 1998). TAO radiometers sampled at 1 Hz from which 2-min averages were computed. IMET radiometers sampled at 5-s intervals from which 1-min averages were computed. Both sets of PSP and PIR radiometers have root-mean-square errors less than approximately 10 W m![]() based upon manufacture specification, analyses of pre- and postcalibrations, and ship-buoy and shore-based side-by-side comparisons (Payne and Anderson 1999; Payne et al. 2002). For the PIR, the largest sources of error were calibration drift and temperature gradients in the casing. For the PSP, the largest sources of error were calibration uncertainties and mean and time-varying tilts in the mast. Owing to fishing-related vandalism, several 95°W TAO moorings were recovered with bent radiometer masts. Tilted masts can produce relatively large error in the daily averaged solar radiation magnitude on clear days when the angle is directed in the meridional plane (Katsaros and DeVault 1986; Medovaya et al. 2002). TAO buoys, however, are expected to vary in their orientation, and thus monthly averaging will tend to reduce errors caused by a bent mast. Records with a sudden drop in magnitude that were recovered damaged or were not recovered are not included in the analysis.
based upon manufacture specification, analyses of pre- and postcalibrations, and ship-buoy and shore-based side-by-side comparisons (Payne and Anderson 1999; Payne et al. 2002). For the PIR, the largest sources of error were calibration drift and temperature gradients in the casing. For the PSP, the largest sources of error were calibration uncertainties and mean and time-varying tilts in the mast. Owing to fishing-related vandalism, several 95°W TAO moorings were recovered with bent radiometer masts. Tilted masts can produce relatively large error in the daily averaged solar radiation magnitude on clear days when the angle is directed in the meridional plane (Katsaros and DeVault 1986; Medovaya et al. 2002). TAO buoys, however, are expected to vary in their orientation, and thus monthly averaging will tend to reduce errors caused by a bent mast. Records with a sudden drop in magnitude that were recovered damaged or were not recovered are not included in the analysis.
Hourly averages of surface IMET data and daily averages of all TAO data were telemetered to shore in near real time via Service Argos. High-resolution TAO data are available only after the mooring is recovered. Because the 95°W TAO moorings suffered substantial losses due to fishing-related vandalism, telemetered daily-averaged data are used when high-resolution data were not available. Use of daily-averaged data during these periods has minimal effect on the monthly averaged cloud forcing estimates.
The 20°S, 85°W site has been occupied by a Woods Hole Oceanography Institute IMET mooring since October 2000. A research ship visits the site each year around October to recover and redeploy a fresh system and perform at-sea comparisons within 0.5 km of the buoy. Solar radiometers were first deployed on the ten EPIC-enhanced TAO 95°W moorings in November 1999; longwave radiometers were deployed 6 months later in April 2000. Final recovery of the TAO EPIC enhancements was in November 2003 although, because of data losses, the analysis here ends in August 2003. TAO moorings were visited by a NOAA ship (either Ron Brown or Ka'imimoana) at 6-month intervals to perform repairs and necessary recoveries and deployments. These cruises were also opportunities for boundary layer measurements, which were used to help develop the clear-sky models (Hare et al. 2005).
To estimate surface cloud forcing, the expected clearsky radiation is subtracted from the observed "full sky" radiation (1). Expected clear-sky solar and longwave radiation estimates require a model. Following Hare et al. (2005), we use the Iqbal (1988) solar radiation clearsky model and the Hare et al. (2005) longwave clear-sky model with the buoy meteorological observations as input.
1) CLEAR-SKY SOLAR RADIATION
Clear-sky solar radiation at the top of the atmosphere can be determined based on solar constant (set as 1367 W m![]() (Lean 1997)) and calculations of the zenith angle. Between the top of the atmosphere and the surface, clear-sky solar radiation is reduced by transmission properties of the atmosphere, which Iqbal (1988) parameterizes in terms of integrated water vapor, aerosol optical thickness within different wavelength bands, and the ozone-layer optical thickness. Since we have only surface values, we further parameterize the integrated water vapor (IV) in terms of the surface specific humidity measurements (IV = bq
(Lean 1997)) and calculations of the zenith angle. Between the top of the atmosphere and the surface, clear-sky solar radiation is reduced by transmission properties of the atmosphere, which Iqbal (1988) parameterizes in terms of integrated water vapor, aerosol optical thickness within different wavelength bands, and the ozone-layer optical thickness. Since we have only surface values, we further parameterize the integrated water vapor (IV) in terms of the surface specific humidity measurements (IV = bq![]() ), where the seasonally and latitudinal varying scale value b is determined from the seasonal cycle of IV/q
), where the seasonally and latitudinal varying scale value b is determined from the seasonal cycle of IV/q![]() as estimated from ERA-40. For 95°W sites, biannually varying aerosol optical thicknesses are used (0.04 for bands 1 and 2 during the spring; 0.001 for bands 1 and 2 during the fall); while for the 20°S, 85°W site, mean aerosol optical thicknesses are used (0.03 for bands 1 and 2). At all 11 sites, a mean ozone optical thickness of 0.2 is used. For more detail, see Hare et al. (2005).
as estimated from ERA-40. For 95°W sites, biannually varying aerosol optical thicknesses are used (0.04 for bands 1 and 2 during the spring; 0.001 for bands 1 and 2 during the fall); while for the 20°S, 85°W site, mean aerosol optical thicknesses are used (0.03 for bands 1 and 2). At all 11 sites, a mean ozone optical thickness of 0.2 is used. For more detail, see Hare et al. (2005).
To remove any bias from the clear-sky estimates, the clear-sky model was compared to the high-resolution buoy radiation observations on very clear days. Following Medovaya et al. (2002), daytime values (when expected solar radiation was higher than 500 W m![]() ) were deemed clear if the magnitude of the observed solar radiation time rate of change never exceeded the expected slope by more than 50% and the observed solar radiation was never below 94% of the expected clear-sky value. At 8°S, 5°S, 2°N, and 3.5°N; 95°W these criteria were never met. In all, 58 days met the criteria, producing a mean bias of 6 W m
) were deemed clear if the magnitude of the observed solar radiation time rate of change never exceeded the expected slope by more than 50% and the observed solar radiation was never below 94% of the expected clear-sky value. At 8°S, 5°S, 2°N, and 3.5°N; 95°W these criteria were never met. In all, 58 days met the criteria, producing a mean bias of 6 W m![]() that was removed from the 95°W sites. For the stratus site at 20°S, 85°W an additional criterion that the longwave cloud forcing be less than 25 W m
that was removed from the 95°W sites. For the stratus site at 20°S, 85°W an additional criterion that the longwave cloud forcing be less than 25 W m![]() was applied. Based upon 5 days meeting the clear-sky criteria a mean bias of 5 W m
was applied. Based upon 5 days meeting the clear-sky criteria a mean bias of 5 W m![]() was removed from the 20°S, 85°W modeled solar clearsky time series. With the mean bias removed, the rootmean-square error in the solar clear-sky is estimated to be ±7 W m
was removed from the 20°S, 85°W modeled solar clearsky time series. With the mean bias removed, the rootmean-square error in the solar clear-sky is estimated to be ±7 W m![]() .
.
2) CLEAR-SKY LONGWAVE RADIATION
Clear-sky longwave [or far infrared (IR)] radiation can be modeled as
![]()
where T![]() is the air temperature in units kelvin,
is the air temperature in units kelvin, ![]() is the Stefan–Boltz constant, and
is the Stefan–Boltz constant, and ![]()
![]()
![]() is the effective emissivity for clear skies, parameterized in terms of the surface specific humidity q
is the effective emissivity for clear skies, parameterized in terms of the surface specific humidity q![]() , integrated water vapor IV, and latitude y according to Hare et al. (2005):
, integrated water vapor IV, and latitude y according to Hare et al. (2005):
![]()
where
![]()
The 3.5 W m![]() bias removed from the clear-sky computation in (2) accounts for the lower height of sensors on buoys relative to that on ships. As described in the previous subsection, integrated water vapor (IV) is estimated from specific humidity and a scale value from ERA-40. As with the solar clear-sky model, a bias in the modeled clear-sky longwave was computed and removed based upon the observed solar radiation criteria described above. In contrast to the solar clear-sky bias calculation where the criteria must be satisfied for the full day, partial days were acceptable for computing the longwave bias. In this way, a mean bias of 2 W m
bias removed from the clear-sky computation in (2) accounts for the lower height of sensors on buoys relative to that on ships. As described in the previous subsection, integrated water vapor (IV) is estimated from specific humidity and a scale value from ERA-40. As with the solar clear-sky model, a bias in the modeled clear-sky longwave was computed and removed based upon the observed solar radiation criteria described above. In contrast to the solar clear-sky bias calculation where the criteria must be satisfied for the full day, partial days were acceptable for computing the longwave bias. In this way, a mean bias of 2 W m![]() was removed from the 95°W longwave clear-sky estimates, and a mean bias of -5 W m
was removed from the 95°W longwave clear-sky estimates, and a mean bias of -5 W m![]() was removed from the 20°S, 85°W estimate. Based on the in situ comparison with radiation on clear days and the comparisons with shipboard measurements, the error in the model clearsky IR is estimated to be ±6 W m
was removed from the 20°S, 85°W estimate. Based on the in situ comparison with radiation on clear days and the comparisons with shipboard measurements, the error in the model clearsky IR is estimated to be ±6 W m![]() .
.
3) IMPLICATIONS FOR ACCURACY OF BUOY CLOUD FORCING ESTIMATES
Using radiometers, which have an error of slightly less than 10 W m![]() , and using the modeled clear-sky radiation, whose error is 7 W m
, and using the modeled clear-sky radiation, whose error is 7 W m![]() for solar and 6 W m
for solar and 6 W m![]() for longwave, results in expected uncertainties of 12–17 W m
for longwave, results in expected uncertainties of 12–17 W m![]() for solar cloud forcing and 11–15 W m
for solar cloud forcing and 11–15 W m![]() for longwave cloud forcing.
for longwave cloud forcing.
b. ISCCP
ISCCP downwelling surface shortwave and longwave cloud forcing monthly radiative flux data (FD) were also evaluated (Zhang et al. 1995; Rossow and Schiffer 1999). The fluxes are computed using an updated radiative transfer model from the Goddard Institute for Space Studies (GISS) GCM and a collection of physical cloud and surface properties based on ISCCP data, including daily atmospheric profiles of temperature and humidity NOAA Television Infrared Observation Satellites (TIROS) operational vertical sounder, daily ozone abundance (total ozone mapping spectrometer), and various climatologies. The parameters considered here include clear-sky and full-sky shortwave and longwave radiative fluxes at the surface and total cloud cover. ISCCP results are on a 3-h and 280-km-squared grid (equal-area map equivalent to 2.5° latitude-longitude at the equator) from which monthly averages are computed and downloaded. ISCCP data are available only through June 2001.
c. NCEP2 reanalysis
The NCEP–Department of Energy (DOE) Atmospheric Model Intercomparison Project II (AMIP-II) Reanalysis (NCEP2) is a follow-on to the NCEP–National Center for Atmospheric Research (NCAR) Reanalysis (NCEP1) project (Kanamitsu et al. 2002). NCEP2 uses an updated forecast model, updated data assimilation system, improved diagnostic outputs, and fixes for the known processing problems of NCEP1. NCEP2 monthly averaged fields are on an ~1.9° grid and extend through August 2003. Parameters considered here include the surface downwelling solar and longwave radiation fields, surface downwelling clearsky fields, precipitation, and total cloud cover. Cloud forcing is computed from (1).
d. ERA-40
ERA-40 is a follow-on to the 15-yr ERA (ERA-15) project (Simmons and Gibson 2000). ERA-40 uses a finer resolution of the planetary boundary layer and an improved variational data assimilation system with a refined numerical model and assimilates a wider range of satellite data. In particular, ERA-40 includes reanalysis of scatterometer winds, special sensor microwave imager (SSM/I) radiance, ozone products and high-resolution infrared spectrometer ozone channel radiance. Monthly averaged ERA-40 fields are on a 2.5° grid and extend through July 2002. Parameters considered here include the surface downwelling solar and longwave radiation fields, surface downwelling clearsky fields, stratiform and convective precipitation rates, and total cloud cover. Cloud forcing is computed from (1) and the net precipitation rate was computed as the sum of the stratiform and convective rain rates.
e. TRMM rainfall
Regions with precipitation have different cloud populations than those without and, hence, would be expected to also have different cloud forcing. To discriminate between these two situations we use monthly rain rates and their error estimates from the level-3 (3B-43) TRMM product. The 3B-43 algorithm uses TRMM and other sources, namely TRMM, geosynchronous IR, and rain gauges to produce the “best” precipitation estimate in the TRMM region. The monthly averaged rain rates and error estimates are on a 1° grid. In our analysis we identify significant rainfall as rain rates larger than the provided rms error estimate. Likewise, if the TRMM rain rate was less than the provided error estimate, then the month was deemed dry to within error estimate.
a. Surface downwelling radiation time series
Despite the fact that the sun is directly overhead twice per year, incident solar (Fig. 2) and longwave (Fig. 3) radiation both show strong annual cycles due to the presence of clouds. While the NWP radiation fields also show a strong annual cycle, the magnitude and latitudinal structure differ from the satellite and buoy benchmark datasets. In particular, both NWP-based analyses have too little incident solar radiation on and north of the equator and too much solar radiation and too little longwave radiation incident in the stratus deck region at 20°S, 85°W. In the following subsections, we will analyze these discrepancies in terms of cloud effects and background clear-sky radiative effects.
FIG. 2. Monthly averaged solar radiation incident on the surface along 95°W from 8°S to 12°N and at 20°S, 85°W from (top left) buoy measurements, (top right) ISCCP, (bottom left) NCEP2 reanalysis, and (bottom right) ERA-40. Solar radiation has units of W m![]() .
.
FIG. 3. Same as in Fig. 2 but for monthly averaged longwave radiation incident on the surface.
b. Surface cloud forcing time series
Solar cloud forcing (Fig. 4) and longwave cloud forcing (Fig. 5) evaluated from the four sources (buoy, ISCCP, NCEP2, and ERA-40) show qualitatively similar features. As expected, deep convection associated with the ITCZ results in large solar cloud forcing (reduction in downwelling solar radiation) with a strong seasonal cycle. In particular, the shadowing effect of the deep convection has a seasonal migration similar to the ITCZ (Mitchell and Wallace 1992), with a blanket of large solar cloud forcing over nearly all Northern Hemisphere sites during June–October and then maximum solar cloud forcing migrating equatorward during October–January. All fields show large solar cloud forcing between 4°S and 8°S in March, consistent with formation of a short-lived Southern Hemisphere ITCZ.
FIG. 4. Same as in Fig. 2 but for monthly averaged solar cloud forcing at the surface along 95°W from 8°S to 12°N and at 20°S, 85°W. Solar cloud forcing is defined by (1) and has units of W m![]() .
.
FIG. 5. Same as in Fig. 4 but for longwave cloud forcing. Longwave cloud forcing is defined by (1) and has units of W m![]() .
.
The greatest solar cloud forcing extends from about 10°N to 2°N (from the deep convection of the ITCZ to the SST front). In contrast, the greatest longwave cloud forcing is found in the Southern Hemisphere, with maximum values found at 20°S during the latter half of the year when a stratus cloud deck often extends to the equator (Klein and Hartmann 1993). Periods of relatively clear skies (e.g., January–March north of 5°N, and near the equator) are seen in both solar and longwave cloud forcing (as near zero). Weakly negative longwave cloud forcing values are nonphysical and represent errors in the buoy estimates.
While the four sets (buoy, ISCCP, NCEP2, and ERA-40) have many similarities, there are also some notable differences, which are apparent when the buoy cloud forcing is differenced from each of the other three products. In the comparisons shown in Figs. 6–8, the nonbuoy fields are interpolated to the buoy sites, and the annual cycle is computed from the difference field. Although ISCCP and buoy cloud forcing have the best agreement, solar cloud forcing is weaker in the ISCCP field than the buoy field, with an overall mean difference of 12 W m![]() along 95°W. Both NWP fields show too much solar cloud forcing relative to the buoys in the ITCZ region and near the equator during the warm season from December through July. In particular, NCEP2 solar cloud forcing had discrepancies of more than -100 W m
along 95°W. Both NWP fields show too much solar cloud forcing relative to the buoys in the ITCZ region and near the equator during the warm season from December through July. In particular, NCEP2 solar cloud forcing had discrepancies of more than -100 W m![]() in the equatorial region from December through April, consistent with a tendency for this analysis to include too much deep convection on the equator during the warm season (Fig. 9). Although ERA-40 solar cloud forcing exhibits smaller errors than NCEP2, ERA-40 has relatively large errors (more than 60 W m
in the equatorial region from December through April, consistent with a tendency for this analysis to include too much deep convection on the equator during the warm season (Fig. 9). Although ERA-40 solar cloud forcing exhibits smaller errors than NCEP2, ERA-40 has relatively large errors (more than 60 W m![]() ) in the frontal zone when the cold tongue is well developed. At 20°S (and during the cool season from August through November south of the equator), both ERA-40 and NCEP2 have too little solar cloud forcing (too much incident solar radiation) with mean discrepancies of 18 W m
) in the frontal zone when the cold tongue is well developed. At 20°S (and during the cool season from August through November south of the equator), both ERA-40 and NCEP2 have too little solar cloud forcing (too much incident solar radiation) with mean discrepancies of 18 W m![]() for NCEP2 and 19 W m
for NCEP2 and 19 W m![]() for ERA-40.
for ERA-40.
The various longwave cloud forcing fields compared more favorably than their counterparts for solar cloud forcing. Although deviations from the buoy values were typically less than ±20 W m![]() , a few patterns can be seen in Fig. 7: All three nonbuoy fields show positive deviations in the ITCZ region and during the warm season (January–June) at and south of the equator, and negative deviations in the stratus region at 20°S and extending north to 4°N during the cold season (August–December). Part of the positive deviations during January–June are likely due to the weakly negative buoy values, which are nonphysical and within the error estimates of the buoy measurements. In contrast, the negative deviations during the latter half of the year imply that the buoys observed more longwave radiation emitted from the clouds. This is consistent with low-level cloud coverage being underestimated in the NWP fields during July–December.
, a few patterns can be seen in Fig. 7: All three nonbuoy fields show positive deviations in the ITCZ region and during the warm season (January–June) at and south of the equator, and negative deviations in the stratus region at 20°S and extending north to 4°N during the cold season (August–December). Part of the positive deviations during January–June are likely due to the weakly negative buoy values, which are nonphysical and within the error estimates of the buoy measurements. In contrast, the negative deviations during the latter half of the year imply that the buoys observed more longwave radiation emitted from the clouds. This is consistent with low-level cloud coverage being underestimated in the NWP fields during July–December.
FIG. 7. Same as in Fig. 6 but for surface longwave cloud forcing.
The results shown here are consistent with the discrepancies in total cloud cover shown in Fig. 9: Too much cloud cover results in too much cloud forcing in the ITCZ region and during the warm season south to 8°S (Figs. 6–7), while too thin cloud cover results in too little cloud forcing under the stratus cloud deck at 20°S and during the cold season north to the equator. These comparisons show that solar cloud forcing dominates the total cloud forcing and that its error dominates the bias. Consequently, the net result of the solar and longwave cloud forcing discrepancies is that these NWP products have too little radiative warming in the ITCZ and southward to 8°S during the warm season and too much radiative warming in the stratus deck region at 20°S and northward to the equator during the cold season (Fig. 8).
FIG. 8. Same as in Fig. 6 but for total surface cloud forcing, defined as the sum of solar and longwave cloud forcing.
FIG. 9. Monthly averaged precipitation and total cloud cover (TCC) along 95°W from 8°S to 12°N and at 20°S, 85°W: (top left) TRMM rain rate, (top right) ISCCP TCC, (middle left) NCEP2 TCC, (middle right) ERA-40 TCC, (bottom left) NCEP2 rain rate, and (bottom right) ERA-40 rain rate. Precipitation units of mm day![]() ; TCC is unitless and scales from 0 (no clouds) to 1 (full cloud coverage).
; TCC is unitless and scales from 0 (no clouds) to 1 (full cloud coverage).
c. Radiative properties of precipitating and nonprecipitating clouds
Because emission of longwave radiation by clouds is strongly dependent on temperature, different cloud types have a different ratio of solar to longwave cloud forcing. The subcloud water vapor concentrations also affect IR flux more than solar flux; thus, conditions with similar cloud base heights may have different longwave (IR) forcing. More humid boundary layers will tend to have lower IR cloud forcing (Stephens and Webster 1981). Thus, to diagnose the radiative properties across the stratus deck/cold tongue/ITCZ complex, the ratio of the longwave to solar cloud forcing (CFR![]() /CFR
/CFR![]() ) is computed for six different regions. These regions are as follows: stratus deck (~20°S, 85°W), southern (9°S–3.5°S), cold tongue (3.5°S–1°N), frontal (1°N–6.5°N), ITCZ (6.5°N–11°N), and northeast Pacific warm pool (11°N–13°N).
) is computed for six different regions. These regions are as follows: stratus deck (~20°S, 85°W), southern (9°S–3.5°S), cold tongue (3.5°S–1°N), frontal (1°N–6.5°N), ITCZ (6.5°N–11°N), and northeast Pacific warm pool (11°N–13°N).
In the previous section, fields were presented as contoured plots and pixel time series. Because data gaps were not filled through interpolation, sites with gaps in adjacent sites could not be contoured. In contrast, in scatterplots, all data can be shown. In Figs. 10 and 11, scatterplots of CFR![]() versus CFR
versus CFR![]() for each region are shown for months when the region had significant rainfall and months when the region had no significant monthly averaged rain as determined by the TRMM rainfall product for the buoy and ISCCP satellite fields and by the corresponding precipitation field for the NWP fields. For the TRMM rainfall, significance was determined based upon the error level provided by the TRMM product. Along 95°W from 8°S to 12°N, the mean error was 1.68 mm day
for each region are shown for months when the region had significant rainfall and months when the region had no significant monthly averaged rain as determined by the TRMM rainfall product for the buoy and ISCCP satellite fields and by the corresponding precipitation field for the NWP fields. For the TRMM rainfall, significance was determined based upon the error level provided by the TRMM product. Along 95°W from 8°S to 12°N, the mean error was 1.68 mm day![]() ; at 20°S, 85°W, the mean error was 0.48 mm day
; at 20°S, 85°W, the mean error was 0.48 mm day![]() . These values were used as significance levels for the NWP precipitation. None of the rain products had significant rainfall at 20°S, 85°W.
. These values were used as significance levels for the NWP precipitation. None of the rain products had significant rainfall at 20°S, 85°W.
FIG. 10. Scatterplots of monthly averaged longwave cloud forcing vs solar cloud forcing for precipitating clouds in six latitudinal bands defined as northeast Pacific warm pool (11°–13°N, 95°W), ITCZ (6.5°–11°N, 95°W), frontal (1°–6.5°N, 95°W), cold tongue (3.5°S–1°N, 95°W), southern (9°–3.5°S, 95°W), and stratus (21.5°–18.5°S, 85°W). As shown in the legend in the lower left, buoy values are indicated by ![]() , NCEP2 by +, ERA40 by ×, and ISCCP by o. The negative 1–1 line is indicated by a dotted line. A thick black line extending over the range of the buoy solar cloud forcing shows the least squares straightline fit of the buoy cloud forcing values. Significant rainfall was determined by TRMM rainfall within each latitudinal bin.
, NCEP2 by +, ERA40 by ×, and ISCCP by o. The negative 1–1 line is indicated by a dotted line. A thick black line extending over the range of the buoy solar cloud forcing shows the least squares straightline fit of the buoy cloud forcing values. Significant rainfall was determined by TRMM rainfall within each latitudinal bin.
FIG. 11. Same as in Fig. 10 but for months with no significant rainfall.
As shown in Figs. 10 and 11, the slope of longwave to solar cloud forcing is closest to -1 in the cold tongue, southern, and stratus deck regions under nonprecipitating conditions. Note that a value of -1 implies that IR and solar cloud forcing cancel and there is no net effect of clouds on the surface energy budget. This, however, was never observed. At the surface, longwave cloud forcing is always less than the solar cloud forcing for all regions in this study. The flattest slopes (indicating clouds that have a marginal effect on downwelling longwave radiation but are relatively opaque to solar radiation) were in the ITCZ region under significant rainfall. Both the warm pool and ITCZ regions have extremely large ranges in monthly averaged solar cloud forcing (~157–165 W m![]() ). In contrast, the range of longwave cloud forcing in the ITCZ was about half that found elsewhere. The most dramatic discrepancy is in the cold tongue region, where NCEP2 clouds have ITCZ-type radiative properties rather than Southern Hemisphere stratus deck (closer to -1) properties. To provide a benchmark for models, the slope and intercept of the least squares straight line fit to the buoy CFR
). In contrast, the range of longwave cloud forcing in the ITCZ was about half that found elsewhere. The most dramatic discrepancy is in the cold tongue region, where NCEP2 clouds have ITCZ-type radiative properties rather than Southern Hemisphere stratus deck (closer to -1) properties. To provide a benchmark for models, the slope and intercept of the least squares straight line fit to the buoy CFR![]() to CFR
to CFR![]() scatter is shown in Tables 1 and 2 for precipitating and nonprecipitating conditions, and for all cloud types in each region in Fig. 12 and Table 3. Overall, the cold tongue region has the most well defined CFR
scatter is shown in Tables 1 and 2 for precipitating and nonprecipitating conditions, and for all cloud types in each region in Fig. 12 and Table 3. Overall, the cold tongue region has the most well defined CFR![]() to CFR
to CFR![]() seasonal cycle relation, while the warm pool region has the most scatter (Table 3).
seasonal cycle relation, while the warm pool region has the most scatter (Table 3).
FIG. 12. Scatterplots of longwave cloud forcing mean annual cycle vs solar cloud forcing mean annual cycle from buoy data in six latitudinal bands listed in Fig. 10 for all cloud types.
d. Clear-sky background radiation
The relative effectiveness of clouds to emit longwave radiation and transmit solar radiation depends not only on the cloud properties, but also upon the background emission and transmission properties of the lower troposphere. For example, longwave cloud forcing tends to be weaker in a moist region than in a dry region, all else being the same. Because cloud forcing depends upon a modeled estimate of the expected radiation under clear skies, errors in the modeled clear-sky radiation could bias the solar and longwave cloud forcing estimates. As shown in Figs. 13 and 14, in addition to a mean bias, deviations in the solar clear-sky radiation at all sites and IR clear-sky radiation south of 2°N have a seasonal cycle with a 10 W m![]() amplitude. Mean deviations in solar clear-sky radiation were largest at 20°S, while mean deviations for longwave clear-sky radiation were largest at and north of the ITCZ. It is uncertain if the solar and longwave clear-sky radiation are modeled better in the buoy or nonbuoy fields. The important point, however, is that clear-sky discrepancies are small when compared to the differences of 20–100 W m
amplitude. Mean deviations in solar clear-sky radiation were largest at 20°S, while mean deviations for longwave clear-sky radiation were largest at and north of the ITCZ. It is uncertain if the solar and longwave clear-sky radiation are modeled better in the buoy or nonbuoy fields. The important point, however, is that clear-sky discrepancies are small when compared to the differences of 20–100 W m![]() between the buoy and NWP solar cloud forcing. Hence, outside of the stratus deck region, the principal sources of the error in the NWP surface cloud forcing and incident radiation appear to be specification of cloud type and coverage and location of the ITCZ.
between the buoy and NWP solar cloud forcing. Hence, outside of the stratus deck region, the principal sources of the error in the NWP surface cloud forcing and incident radiation appear to be specification of cloud type and coverage and location of the ITCZ.
FIG. 13. Same as in Fig. 6 but for clear-sky solar radiation at the surface.
FIG. 14. Same as in Fig. 6 but for clear-sky longwave radiation at the surface.
In the far eastern tropical Pacific, a stratus cloud deck forms over the cool surface water near Peru and Chile and deep convection associated with the ITCZ forms over the warm surface waters north of the equator. Clouds have both a cooling effect on the ocean surface due to the reduction in solar radiation and a warming effect due to the emission of longwave infrared radiation. The net effect of the clouds on the surface radiation depends upon many factors including cloud base height, cloud thickness, coverage, background moisture, and aerosol loading. While cloud types defined by low, middle, and high values of cloud optical thickness versus cloud-top pressure provide a useful tool for relating cloud type to cloud forcing properties at the top of the atmosphere (e.g., Chen et al. 2000), the cloud forcing properties at the surface are less understood and more difficult to observe.
As part of the Eastern Pacific Investigation of Climate Processes (EPIC), from 2000 through 2003, 11 buoys in the far eastern Pacific were equipped with a suite of sensors from which surface solar and longwave cloud forcing could be computed. In this study, we use this buoy data to analyze the meridional structure and seasonal cycle of the cloud forcing in the stratus deck region at 85°W, 20°S and across the stratocumulus, cold tongue, ITCZ complex along 95°W from 8°S to 12°N. Buoy measurements in this region show both large reduction of solar radiation by the stratus cloud deck and a relatively large enhancement of longwave radiation. The net effect of the stratus clouds, however, is a reduction in the incoming radiation. Indeed, at all sites in the EPIC region solar cloud forcing was larger in magnitude than the longwave cloud forcing. In contrast to the stratus site, in the ITCZ region the longwave cloud forcing was weak, while the solar cloud forcing was for some months more than -165 W m![]() . Consequently, in the ITCZ region clouds had a very large impact on the net radiation. Over the cold tongue region, particularly during the warm season, there were many periods of clear sky when the cloud forcing was near zero.
. Consequently, in the ITCZ region clouds had a very large impact on the net radiation. Over the cold tongue region, particularly during the warm season, there were many periods of clear sky when the cloud forcing was near zero.
The buoy cloud forcing fields were compared to three of the most commonly used global atmospheric products: satellite-based ISCCP fields, NCEP2 reanalysis, and 40-yr ECMWF Re-Analysis (ERA-40) fields. The latter two products combine NWP models and observations and therefore tend to have good realism on weather time scales. While reanalysis products are often treated as data, the radiation fields therein are not well constrained by data. If realistic surface radiation fields are sought, satellite fields should be used in lieu of NWP fields. However, in this case, one must question the validity of the other modeled fields. Incorrect cloud forcing is indicative of incorrect global energy balance. This is particularly true in the ITCZ region that acts as the rising branch of the Hadley cell. If, as was found in this study, the cloud forcing biases are not offset by biases in the clear-sky radiation, then these biases in the cloud forcing also represent biases in the net surface heat flux on the ocean module of the coupled NWP models. Thus, biases in the cloud forcing fields may have large impact on other aspects of the numerical weather prediction products. For this reason, a quantitative assessment of the NWP cloud forcing is justified.
Both NWP fields show too much solar cloud forcing (implying a cold bias) in the ITCZ region and near the equator during the warm season from December through July (Fig. 6). Because NCEP2 forms precipitating clouds with ITCZ-like radiative properties on the equator during the warm season (February–April), Figs. 10–11, the NCEP2 solar cloud forcing bias is particularly large (more than -100 W m![]() ) there when the cold tongue normally weakens. If used as boundary conditions for an OGCM, the NCEP2 solar cloud forcing would result in a cold SST bias. For example, the NCEP2 solar forcing error of over -100 W m
) there when the cold tongue normally weakens. If used as boundary conditions for an OGCM, the NCEP2 solar cloud forcing would result in a cold SST bias. For example, the NCEP2 solar forcing error of over -100 W m![]() would lead to a 7°C cold bias within 3 months, assuming a 30-m-thick slab ocean mixed layer. Because this is the warm season when the cold tongue is weak, this solar cloud forcing bias would cause an unrealistically prominent and persistent cold tongue. Persistently cold SSTs along the equator (i.e., a permanent cold tongue) would be expected to have important ramifications on the seasonal cycle in the entire eastern tropical Pacific.
would lead to a 7°C cold bias within 3 months, assuming a 30-m-thick slab ocean mixed layer. Because this is the warm season when the cold tongue is weak, this solar cloud forcing bias would cause an unrealistically prominent and persistent cold tongue. Persistently cold SSTs along the equator (i.e., a permanent cold tongue) would be expected to have important ramifications on the seasonal cycle in the entire eastern tropical Pacific.
FIG. 6. (upper left) Mean annual cycle of solar cloud forcing field along 95°W from 8°S to 12°N and at 20°S, 85°W from buoy measurements and mean annual cycle of difference between surface solar cloud forcing and buoy field along 95°W from 8°S to 12°N and at 20°S, 85°W for (upper right) ISCCP, (lower left) NCEP2 reanalysis, and (lower right) ERA40.
On the other hand, in the stratus cloud deck region at 20°S solar cloud forcing bias is of the opposite sign, 18 W m![]() for NCEP2 and 19 W m
for NCEP2 and 19 W m![]() for ERA-40, which would tend to produce a warm bias in SST. Furthermore, the positive (warm) solar cloud bias associated with the stratus cloud deck extends northward to the equator during the cold season. Because the reanalyses have solar clear-sky radiation larger than that modeled for the 20°S buoy, their incident solar radiation is even larger than these cloud forcing deviations would suggest.
for ERA-40, which would tend to produce a warm bias in SST. Furthermore, the positive (warm) solar cloud bias associated with the stratus cloud deck extends northward to the equator during the cold season. Because the reanalyses have solar clear-sky radiation larger than that modeled for the 20°S buoy, their incident solar radiation is even larger than these cloud forcing deviations would suggest.
Longwave cloud forcing comparisons were better than for solar cloud forcing; deviations were typically less than 20 W m![]() . Longwave cloud forcing appears to be too strong in the ITCZ and in the Southern Hemisphere during the warm season (February–June) for all three products. Likewise, longwave cloud forcing appears to be too weak during the cold season when a stratus cloud deck typically develops. Overall, discrepancies between the ISCCP and buoy cloud forcing are smaller than for the NWP fields. If ISCCP were used as the benchmark, similar patterns for the NWP biases would be found.
. Longwave cloud forcing appears to be too strong in the ITCZ and in the Southern Hemisphere during the warm season (February–June) for all three products. Likewise, longwave cloud forcing appears to be too weak during the cold season when a stratus cloud deck typically develops. Overall, discrepancies between the ISCCP and buoy cloud forcing are smaller than for the NWP fields. If ISCCP were used as the benchmark, similar patterns for the NWP biases would be found.
The results described here are consistent with the results found by Weare (1997) for NCEP1, by Jakob (1999) for the ECMWF 15-yr Re-Analysis and by the European Cloud Systems Study (EUROCS) GCM intercomparison (Siebesma et al. 2004): almost all models that were tested underpredicted the cloud cover in the stratocumulus regions [in the case of Siebesma et al. (2004), Californian stratus], while in the trade-wind region including the ITCZ, cloud cover was overpredicted. As a consequence, Siebesma et al. (2004) found that downwelling surface shortwave radiation was overpredicted by typically 60 W m![]() in the stratocumulus regimes and underpredicted by 60 W m
in the stratocumulus regimes and underpredicted by 60 W m![]() in the ITCZ and trade wind regions. Curiously, these cloud forcing discrepancies appear to be larger than those found by Weare (1997) for NCEP1. As pointed out by Roads (2003), although the changes made between the NCEP1 and NCEP2 appeared to be minor, the resulting tropical hydrologic cycles were surprisingly different. In particular, NCEP2 tended to produce a more noticeable double ITCZ and too much precipitation closer to the equator.
in the ITCZ and trade wind regions. Curiously, these cloud forcing discrepancies appear to be larger than those found by Weare (1997) for NCEP1. As pointed out by Roads (2003), although the changes made between the NCEP1 and NCEP2 appeared to be minor, the resulting tropical hydrologic cycles were surprisingly different. In particular, NCEP2 tended to produce a more noticeable double ITCZ and too much precipitation closer to the equator.
It is interesting to note that these biases in surface cloud forcing are of the correct sign to account for the warm SST bias in the stratus deck region west of Peru (Mechoso et al. 1995) and the cold SST bias found at the equator in most coupled GCMs (Davey et al. 2002). These SST biases, however, are not just due to errors in radiative effects but also involve complicated interactions with wind stress fields, turbulent air-sea heat exchanges, and mixing processes.
The in situ measurements from buoys on which the present study was based can be used to validate and assess NWP and satellite products. Linear fit polynomials for relating surface solar and longwave cloud forcing are shown in Tables 1–3. These empirical relations can be used as a ground truth test for atmospheric models that generate their own cloud and surface radiation fields.
The authors thank the NCEP, ECMWF, ISCCP, TRMM, and TAO project offices for providing the data used in this analysis. NCEP2 data were accessed from http://nomad2.ncep.noaa.gov:9090/dods/reanalyses/reanalysis-2/month/dg3/dg3.info through the Distributed Oceanographic Data System (DODS). ISCCP data were obtained from http:// isccp.giss.nasa.gov/projects/browse_fc.html. ECMWF ERA-40 data were downloaded from the ECMWF data server at http://www.ecmwf.int/. TRMM data were obtained from http://daac.gsfc.nasa.gov/data. The authors also wish to thank K. Huang, K. Colbo, and Y. Serra for their help in processing and accessing data, and J. Hare for providing the clear sky models used here. Helpful comments were provided by three anonymous reviewers. This research was supported by grants from the NOAA Office of Global Programs, Pan American Climate Studies.
Cess, R. D., and Coauthors, 1989: Interpretation of cloud-climate feedback as produced by 14 atmospheric general circulation models. Science, 245, 513–515.
——, and Coauthors, 1990: Intercomparison and interpretation of climate feedback processes in 19 atmospheric general circulation models. J. Geophys. Res., 95, 16 601–16 615.
——, and Coauthors, 1996: Cloud feedback in atmospheric general circulation models: An update. J. Geophys. Res., 101, 12 791–12 794.
Chelton, D. B., and Coauthors, 2001: Observations of coupling between surface wind stress and sea surface temperature in the eastern tropical Pacific. J. Climate, 14, 1479–1498.
Chen, T., W. B. Rossow, and Y. Zhang, 2000: Radiative effects of cloud-type variations. J. Climate, 13, 264–286.
Cronin, M. F., N. Bond, C. Fairall, J. Hare, M. J. McPhaden, and R. A. Weller, 2002: Enhanced oceanic and atmospheric monitoring underway in eastern Pacific. Eos, Trans. Amer. Geophys. Union, 83 (19), 205, 210–211.
Davey, M. K., and Coauthors, 2002: STOIC: A study of coupled model climatology and variability in tropical ocean regions. Climate Dyn., 18, 403–420.
deSzoeke, S. P., C. S. Bretherton, N. A. Bond, M. F. Cronin, and B. Morley, 2005: EPIC 95°W observations of the eastern Pacific atmospheric boundary layer from the cold tongue to the ITCZ. J. Atmos. Sci., 62, 426–442.
Fairall, C. W., P. O. G. Persson, E. F. Bradley, R. E. Payne, and S. A. Anderson, 1998: A new look at calibration and use of Eppley Precision Infrared Radiometers. Part I: Theory and application. J. Atmos. Oceanic Technol., 15, 1229–1242.
Hare, J. E., C. W. Fairall, T. Uttal, D. Hazen, M. F. Cronin, N. A. Bond, and D. E. Veron, 2005: Cloud, radiation, and surface forcing in the equatorial eastern Pacific. NOAA Tech. Memo., OAR-PSD 307, NOAA ESRL, Boulder, CO, 64 pp.
Hashizume, H., S.-P. Xie, M. Fujiwara, M. Shiotani, T. Watanabe, Y. Tanimoto, W. T. Liu, and K. Takeuchi, 2002: Direct observations of atmospheric boundary layer response to SST variations associated with tropical instability waves over the eastern equatorial Pacific. J. Climate, 15, 3379–3393.
Hosom, D. S., R. A. Weller, R. E. Payne, and K. E. Prada, 1995: The IMET (Improved Meteorology) ship and buoy systems. J. Atmos. Oceanic Technol., 12, 527–540.
Iqbal, M., 1988: Spectral and total sun radiance under cloudless skies. Physical Climatology for Solar and Wind Energy, R. Guzzi and C. G. Justus, Eds., World Scientific, 196–242.
Jakob, C., 1999: Cloud cover in the ECMWF reanalysis. J. Climate, 12, 947–959.
Kanamitsu, M., W. Ebisuzaki, J. Woollen, S.-K. Yang, J. J. Hnilo, M. Fiorino, and G. L. Potter, 2002: NCEP–DEO AMIP-II Reanalysis (R-2). Bull. Amer. Meteor. Soc., 83, 1631–1643.
Katsaros, K. B., and J. E. DeVault, 1986: On irradiance measurement errors at sea due to tilt of pyranometers. J. Atmos. Oceanic Technol., 3, 740–745.
Kattenberg, A., and Coauthors, 1996: Climate models—Projections of future climate. Climate Change 1995: The Science of Climate Change. J. T. Houghton et al., Eds., Cambridge University Press, 285–357.
Klein, S. A., and D. L. Hartmann, 1993: The seasonal cycle of low stratiform clouds. J. Climate, 6, 1587–1606.
Latif, M., and Coauthors, 2001: ENSIP: The El Niño simulation intercomparison project. Climate Dyn., 18, 255–276.
Lau, K.-M., J. H. Kim, and Y. Sud, 1996: Intercomparison of hydrologic processes in AMIP GCMs. Bull. Amer. Meteor. Soc., 77, 2209–2227.
Lean, J., 1997: The Sun’s variable radiation and its relevance for Earth. Annu. Rev. Astron. Astrophys., 35, 33–67.
Lietzke, C. E., C. Deser, and T. H. Vonder Haar, 2001: Evolutionary structure of the eastern Pacific double ITCZ based on satellite moisture profile retrievals. J. Climate, 14, 743–751.
McPhaden, M. J., and Coauthors, 1998: The tropical ocean global atmosphere (TOGA) observing system: A decade of progress. J. Geophys. Res., 103, 14 169–14 240.
Mechoso, C. R., and Coauthors, 1995: The seasonal cycle over the tropical Pacific in coupled ocean–atmospheric general circulation models. Mon. Wea. Rev., 123, 2825–2838.
Medovaya, M., D. E. Waliser, R. A. Weller, and M. J. McPhaden, 2002: Assessing ocean buoy shortwave observations using clear-sky model calculations. J. Geophys. Res., 107, 3014, doi:10.1029/2000JC000558.
Mitchell, T. P., and J. M. Wallace, 1992: The annual cycle in equatorial convection and sea surface temperature. J. Climate, 5, 1140–1156.
Moore, B., III, W. L. Gates, L. J. Mata, A. Underdal, and R. J. Stouffer, 2001: Advancing our understanding. Climate Change 2001: The Scientific Basis, J. T. Houghton et al., Eds., Cambridge University Press, 769–785.
Payne, R. E., and S. P. Anderson, 1999: A new look at calibration and use of Eppley Precision Infrared Radiometers. Part II: Calibration and use of the Woods Hole Oceanographic Institution Improved Meteorology Precision Infrared Radiometer. J. Atmos. Oceanic Technol., 16, 739–751.
——, and Coauthors, 2002: A comparison of buoy meteorological systems. WHOI Tech. Rep. WHOI-2002-10, Woods Hole Oceanographic Institution, 67 pp.
Philander, S. G. H., D. Gu, D. Halpern, G. Lambert, N. C. Lau, T. Li, and R. C. Pacanowski, 1996: Why the ITCZ is mostly north of the equator. J. Climate, 9, 2958–2972.
Roads, J., 2003: The NCEP–NCAR, NCEP–DOE, and TRMM tropical atmosphere hydrologic cycles. J. Hydrometeor., 4, 826–840.
Rossow, W. B., and R. A. Schiffer, 1999: Advances in understanding clouds from ISCCP. Bull. Amer. Meteor. Soc., 80, 2261– 2287.
Siebesma, A. P., and Coauthors, 2004: Cloud representation in general-circulation models over the northern Pacific Ocean: A EUROCS intercomparison study. Quart. J. Roy. Meteor. Soc., 130, 3245–3267.
Simmons, A. J., and J. K. Gibson, Eds., 2000: The ERA-40 project plan. ERA-40 Project Rep. Series 1, 62 pp.
Stephens, G. L., and P. J. Webster, 1981: Clouds and climate: Sensitivity of simple systems. J. Atmos. Sci., 38, 235–247.
Wallace, J. M., E. M. Rasmusson, T. P. Mitchell, V. E. Kousky, E. S. Sarachik, and H. von Storch, 1998: On the structure and evolution of ENSO-related climate variability in the tropical Pacific: Lessons from TOGA. J. Geophys. Res., 103, 14 241– 14 259.
Weare, B. C., 1997: Comparison of NCEP–NCAR cloud radiative forcing reanalyses with observations. J. Climate, 10, 2200– 2209.
Xie, S.-P., M. Ishiwatari, H. Hashizume, and K. Takeuchi, 1998: Coupled ocean-atmospheric waves on the equatorial front. Geophys. Res. Lett., 25, 3863–3866.
Zhang, C., 2001: Double ITCZs. J. Geophys. Res., 106, 11 785– 11 792.
Zhang, Y. C., W. B. Rossow, and A. A. Lacis, 1995: Calculation of surface and top of atmosphere radiative fluxes from physical quantities based on ISCCP datasets, 1. Method and sensitivity to input data uncertainties. J. Geophys. Res., 100, 1149– 1165.
Return to Abstract