U.S. Dept. of Commerce / NOAA / OAR / PMEL / Publications
Evidence for volcanic eruption on the southern Juan de Fuca ridge between 1981 and
1987
William W. Chadwick, Jr.
OSU/CIMRS, Hatfield Marine Science Center, Newport, Oregon 97365, USA
Robert W. Embley and Christopher G. Fox
PMEL/NOAA, Hatfield Marine Science Center, Newport, Oregon 97365, USA
Nature, 350, 416-418 (1991)
Copyright ©1991 Macmillan Publishers Ltd. Further electronic distribution not
allowed.
The formation of new ocean crust at mid-ocean ridges is known to be a discontinuous
process in both space and time, but little is known about the frequency and
duration of eruptions along an active ridge segment. Here we present evidence,
from Sea Beam surveys and underwater photography, for the eruption of lavas
along a segment of the Juan de Fuca ridge between 1981 and 1987. Although previous
studies have inferred volcanic activity on ridges in areas where recent seismicity
or young lava flows have been observed [Macdonald
et al., 1989; Nishimura
et al., 1989; Bergman
and Solomon, 1990; Shor
et al., 1990], none has yet had direct evidence to date such a recent
submarine eruption. The temporal coincidence between this eruptive episode and
the megaplumes (huge, sudden emissions of hot mineral-laden water) observed
over this part of the ridge [Baker
et al., 1987; Baker
et al., 1989] in 1986 and 1987 supports previous suggestions [Baker
et al., 1987; Baker
et al., 1989; Embley
et al., in press; Cann
and Strens, 1989; Embley
and Chadwick, 1990; Baker
and Lupton, 1990] that megaplumes are caused by sea-floor spreading events.
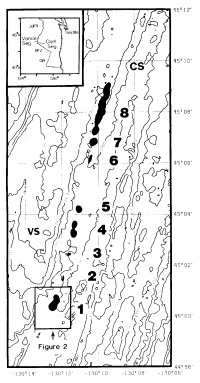
The lavas that were erupted during the 1980s occur as a series of pillow mounds and
ridges between 45°00.5 N and 45°09.5
 N along the northern Cleft segment (Fig. 1). The evidence for the recent eruption of these lavas
was first discovered through a discrepancy between microbathymetry derived from a towed
camera system and bathymetric charts based on Sea Beam surveys. Three camera tows
(collected in 1989 from the National Oceanic Atmospheric Administration (NOAA) ship Discoverer)
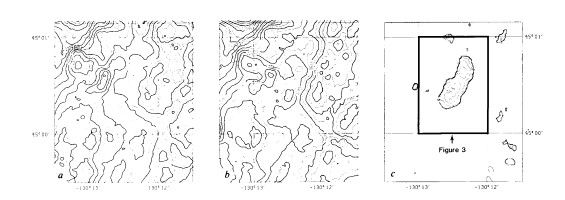
over the southernmost pillow mound (mound 1, Fig. 1) showed
glassy lava flows forming a 35-m-high hill, ~1 km in diameter. Earlier Sea Beam bathymetry
(based on data collected in May 1981 from the NOAA ship Surveyor) shows no such
hill, but instead a gentle slope to the east (Fig. 2a). The
Sea Beam and camera-tow bathymetry correspond closely in other areas.

Fig. 1. Sea Beam bathymetric map of overlap region between Cleft and Vance segments,
southern Juan de Fuca ridge (50-m contours); CS is northern end of Cleft segment, VS is
southern end of Vance segment. Solid black areas show locations of new pillow lava mounds.
Numbers to right of each mound are for identification in text. Box around mound 1 shows
outline of Fig. 2. On inset map, GR is Gorda ridge, BFZ is
Blanco Fracture Zone, and JdFR is Juan de Fuca ridge.
Other surveys confirm the recent appearance of mound 1. Bathymetry from Sea Beam
surveys conducted over the same area by the research vessel Atlantis II in
September 1987 and by the Discoverer in August 1990 shows a 25-m-high mound in the
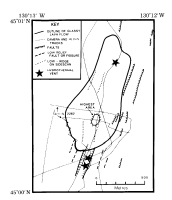
exact location of' the glassy lavas delineated by the camera tows (Fig. 2b). Mound 1 was also imaged by a SeaMARC I
sidescan survey in August 1987 from the Discoverer, and appears as an unfractured
positive relief feature which covers preexisting fractures (Fig.
3). The date of eruption of mound 1 is further restricted by a single Sea Beam swath
collected during a camera tow by the Surveyor in June 1983. Although the data only
sample the western edge of mound 1, the coverage is adequate to show that the 1983 swath
has the same pre-eruption depth contours as the 1981 Sea Beam survey, and does not show
the contours of the new lava mound. These Sea Beam surveys definitely constrain the time
of the eruption of mound I to between 1981-1987, and probably to between 1983-1987.

Fig. 2. Sea Beam bathymetric maps (5-m contours) of area including southern-most new
lava mound (mound 1 in Fig. 1). a, Pre-eruption
bathymetry from survey in 1981. b, Post-eruption bathymetry from survey in 1990.
Mound 1 is a new feature near centre of map. c, Map of the significant depth
differences between 1981 and 1990 Sea Beam surveys (see text for discussion), showing
outline and shape of mound 1. This corresponds exactly with the location of a mound of
fresh, glassy pillow lavas based on camera tows, Alvin dives and sidescan sonar
data (Fig. 3)

Fig. 3. Detailed map (outline shown in Fig. 2c)
of mound 1 based on SeaMARC I sidescan sonar data, and the locations of flow contacts as
surveyed by camera tows and Alvin dive 2262 (thin dashed lines). Note close
correspondence with outline of mound 1 in Fig. 2c,
derived independently fom Sea Beam data.
Further comparisons of the 1981, 1987 and 1990 Sea Beam data sets to the north
of mound 1 reveal that several other mounds appear in the 1987/1990 data that
were not present in 1981 (Fig. 1). No significant
changes are evident between the 1987 and 1990 Sea Beam surveys, but the 1987
survey only covered mounds 1, 7 and 8, and not the intervening area, whereas
the coverage of the 1990 survey was complete. Therefore the time of eruption
of mounds 4 and 5 is only constrained to between 1981 and 1989 (the year of
the camera tow). Mounds 2, 3 and 6 are glassy pillow mounds mapped by camera
tows in 1989, but are apparently too small to be resolved by Sea Beam, so their
eruption date can only be limited to before 1989. Most of the volume of new
lava was erupted between 1981 and 1987; whether the features were constructed
simultaneously or in discrete events within this time period cannot be determined
from these data. The entire string of new eruptive sites lies roughly in the
direction N 15°E over a length of 16 km. This line of recent volcanic activity
is clearly along the north extension of the Cleft segment [Embley
et al., in press], but it is also within the zone of overlap of the
Cleft and Vance segments, and the new eruptions extend into the axial valley
of the Vance segment (Fig. 1).
Significant changes in the sea floor between Sea Beam surveys can be inferred
qualitatively from obvious changes in the shape of bathymetric contours. Figure 2a and b shows bathymetric contour maps
made from 1981 and 1990 Sea Beam data, using identical mathematical gridding and automated
contouring routines. Mound 1 can be distinguished as a new landform in Fig. 2b which is not present in Fig. 2a. We also used a quantitative technique to
compare digital bathymetric grids from various Sea Beam data sets so that we could
objectively identify areas of significant bathymetric changes. Figure
2c was produced by the following steps: (1) the 1990 Sea Beam grid was
subtracted from the 1981 grid; (2) the differences were weighted in inverse proportion to
the slope of the sea floor at each grid cell; (3) a final grid was created consisting of
only those original (unweighted) depth differences for which the slope-weighted
differences exceeded a preselected threshold. The differences must be weighted because a
given error in location (due primarily to navigation error) will create a larger error in
depth differences over a steep slope than over a gentle slope. For Fig. 2c, a threshold was chosen such that the outline
of the area of significant differences best corresponded to the edge of the glassy lavas
as determined from camera tows. As this threshold value is slope-weighted, it does not
correspond to a single depth difference; the smallest depth differences above the
threshold range from 5 to 15 m. We believe the technique to be reliable because in every
case where camera-tow coverage is available, all of the new mounds defined by the Sea Beam
difference grids occur precisely where camera tows indicate fresh glassy lavas. Mound 8 is
just beyond the limit of the 1989 camera tows and will be the target of future camera
surveys.
Because of its finite acoustic footprint and limited depth resolution, Sea Beam cannot
detect all new lava flows. A few of the smallest patches of fresh lavas mapped by the
towed camera system in 1989 do not produce a detectable change in bottom topography
between the 1981 and 1990 Sea Beam surveys. Nevertheless, these lavas are identical in
morphology and sediment cover to the other new lavas, and all the mounds occur along a
linear trend. Therefore, we suspect all the glassy lava mounds were erupted during the
1981 to 1987 period.
A total volume for the new lava mounds of 0.05 km³ is calculated from the gridded
Sea Beam differences. For comparison, this is similar to the volume produced
during the 1977 eruption of Kilauea volcano, Hawaii (0.04 km³), which lasted
18 days [Moore
et al., 1980]. During the 9-year rifting episode in northeast Iceland
(1975-1984) [Björnsson,
1985; Sigurdsson,
1987], a total volume of 0.1-0.2 km³ of basalt was erupted in 9 out of 21
separate intrusion events; the volume of intruded dykes was much larger, ~1.0
km³.
Many apparently young, glassy lavas have been observed along the mid-ocean-ridge
system, but it has not been possible to determine exact ages. Now we have a benchmark for
the character of 'zero-age' lava. Bottom photographs taken in 1989 and observations ftom
the submersible Alvin on dive 2262 in 1990 (Fig. 3)
show that the new lavas are similar in appearance and sediment cover. Each new mound is
primarily an accumulation of pillow lavas. The lava flows consist of high-standing bulbous
and elongate pillows with corrugated surfaces, surrounded by cylindrical lobes with smooth
glassy surfaces that resemble subaerial pahoehoe toes. The difference in microrelief of
these two surface textures gives them a consistent difference in apparent sediment cover.
The smooth pahoehoe toes have no sediment veneer, whereas small amounts of sediment are
present along the extrusion marks on the bulbous pillows. Small sediment pockets between
pillows are present in some areas. There is a sharp contrast in light reflectivity and
sediment cover between the new lava flows and the surrounding older lavas.
In addition to the grey-brown pelagic sediment, there are two types of yellow deposits
on the surface of the fresh lavas. One type consists of small globules of yellow material
commonly located along small cooling cracks on individual pillows and ubiquitous
throughout the mounds. This material seems to form from the direct interaction of sea
water and hot lava. A review of the literature and data from other areas indicates that
this type of deposit is not generally seen on older pillows and may be a good indication
of very young submarine lava flows. The second type of deposit appears as a fine dusting
of yellow-tinged material, and is commonly found surrounding small orifices near the edges
of lava lobes, as if it had been deposited from fluids escaping from beneath. This type of
deposit seems to be primarily associated with the crestline of the mounds and may be the
product of low-temperature diffuse venting.
Camera tows photographed tube worm colonies living on older lava between the
new mounds along a hydrothermally active fracture system [Embley
et al., in press], and also found tube worms living on new lava on
mound 1 (Fig. 3) and mound 2. This gives an absolute
constraint on the maximum time necessary for the biological colonization of
new vent sites (2-6 years on mound 1). The hydrothermal vents on the new lavas
may be due to leakage of warm fluids through the permeable new lava mounds from
the buried fracture system.
Our interpretation is that all the fresh lava mounds were erupted during one
rifting episode, either in one event or in several events over a period of years,
analogous to Icelandic volcanic systems [Björnsson
et al., 1979]. The eruption clearly occurred along a prominent
fissure system that is now hydrothermally active [Embley
et al., in press], and it is reasonable to assume that the lava mounds
were fed from, and are underlain by, a recent dyke intrusion. Monitoring of
subaerial volcanoes suggests that the emplacement of this dyke produced horizontal
extension across the northern Cleft segment of the order of metres and therefore
represents an episode of active sea-floor spreading. No seismicity was detected
associated with this eruption (R. Dziak, personal communication); however, all
seismic data for the northeast Pacific is from land-based stations, and the
detection threshold is m 4.0 (B. Presgrave, personal communication).
The Juan de Fuca megaplumes [Baker
et al., 1989] were observed in 1986 and 1987, within the time interval
for the eruption. This coincidence in time supports earlier models that megaplumes
may be caused by sea-floor spreading [Baker
et al., 1987; Baker
et al., 1989; Embley
et al., in press; Cann
and Strens, 1989; Embley
and Chadwick, 1990] and the conclusion [Baker
and Lupton, 1990] that the 1986 megaplume was followed by degassing of fresh
magma into the hydrothermal system. Horizontal extension caused by dyke intrusion
is a reasonable mechanism for a sudden increase in the permeability of the crust
in the vicinity of a pre-existing hydrothermal system leading to catastrophic
release of hydrothermal fluids. Megaplumes may thus be indirect indicators of
sea-floor spreading events.
Acknowledgments. D. Clague and J. Morton provided helpful reviews. This research was
supported by the NOAA VENTS Program and the NOAA Undersea Research Program. Authorship of
this paper is alphabetical.
References
Baker, E. T. and Lupton, J. E. Nature 346, 556-558 (1990).
Baker, E. T., Massoth, G. J. and Feely, R. A. Nature 329, 149-151 (1987).
Baker, E. T. et al. J. Geophys. Res. 94, 9237-9250 (1989).
Bergman, E. A. and Solomon, S. C. J. Geophys. Res. 95, 4943-4965 (1990).
Björnsson, A. J. Geophys. Res. 90, 10151-10162 (1985).
Björnsson, A., Johnsen, G., Sigurdsson, S., Thorbergsson, G. and Tryggvason, E. J.
Geophys. Res. 84, 3029-3038 (1979).
Cann, J. R. and Strens, M. R. J. Geophys. Res. 94, 12227-12237 (1989).
Embley, R. W, and Chadwick, W. W. Jr. EOS Trans. Am. Geophys. Un. 71, 259
(1990).
Embley, R. W., Chadwick, W W. Jr., Perfit, M. R. and Baker, E. T. Geology (in
the press).
Macdonald, K. C., Haymon, R. and Shor, A. Geology 17, 212-216 (1989).
Moore, R. B. et al. J. Volcan. Geotherm. Res. 7, 189-210 (1980).
Nishimura, C. E., Vogt, P. R., Smith, L. and Boyd, J. D. EOS Trans. Am. Geophys. Un.
70, 1301 (1989).
Shor, A. N., Nishimura, C. E., Czarnecki, M. and Vogt, P. R. Eos Trans. Am. Geophys.
Un, 71, 1602 (1990).
Sigurdsson, H. Geol Assoc. Canada Spec. Pap. 34 (eds Hall, H. C. and
Fahrig, W. F.) 55-64 (Geological Assocation of Canada, St John's, Newfoundland, 1987).
Go to Gallery of Figures
PMEL Outstanding Papers
PMEL Publications Search
PMEL Homepage
 N and 45°09.5
 N along the northern Cleft segment (Fig. 1). The evidence for the recent eruption of these lavas
was first discovered through a discrepancy between microbathymetry derived from a towed
camera system and bathymetric charts based on Sea Beam surveys. Three camera tows
(collected in 1989 from the National Oceanic Atmospheric Administration (NOAA) ship Discoverer)
over the southernmost pillow mound (mound 1, Fig. 1) showed
glassy lava flows forming a 35-m-high hill, ~1 km in diameter. Earlier Sea Beam bathymetry
(based on data collected in May 1981 from the NOAA ship Surveyor) shows no such
hill, but instead a gentle slope to the east (Fig. 2a). The
Sea Beam and camera-tow bathymetry correspond closely in other areas.


 4.0 (B. Presgrave, personal communication).