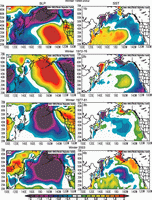
Figures 1–4. Spatial anomaly fields of (a) SLP and (b) SST for winter (November–March) covering 1999–2002, 1972–1976, 1977–1981, and 2003.
Figure 5. Principal Component Analysis of North Pacific winter (November–March) SST fields north of 20°. The first EOF (top) corresponds to the PDO pattern and its time evolution is given by PC1. The evolution of the second EOF pattern shows large magnitudes since the 1990s with a shift to large positive values for 1999–2002.
Figure 6. Trajectory of the state of North Pacific SSTA in the phase space of the first two principal components, PC1 (abscissa) and PC2 (ordinate). Labels showing years represent 5-year running means except at endpoints, which represent 3-year running means.

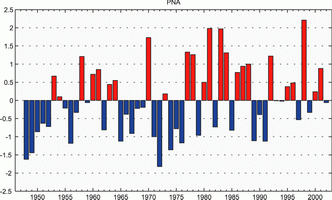
Figure 7. The time series of the Pacific North American (PNA) teleconnection pattern for 500 hPa [Wallace and Gutzler, 1981]. Amplitudes have been normalized by the standard deviation. The PNA was small |<0.4| for three of the four years: 1999–2002.
Figure 8. 300 hPa wind anomalies for 1999–2002. Note stronger magnitudes of westerlies in the eastern North Pacific along 45°N.
Return to Abstract