U.S. Dept. of Commerce / NOAA / OAR / PMEL / Publications
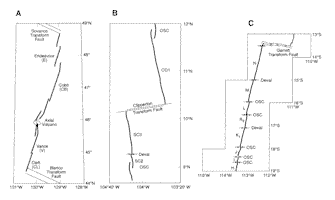
Figure 1. Location maps of tectonic segments studied along the (a) Juan de Fuca Ridge, (b) northern East Pacific Rise (EPR), and (c) southern EPR. Segments ClippertonOrozco2 and CO3 lie immediately north of segment CO1 on the northern EPR; H, G2, and G1 lie immediately south of I on the southern EPR. Segment labeling on the southern EPR from Sinton et al. [1991].
Figure 2. Schematic cross section of a ridge axis showing relationships between all of the geological indexes considered, except MgO wt% in axial basalts. See text for descriptions.
Figure 3. Comparison of (top) along-axis trends in Enet, or net elevation (heavy solid line), and Axs, or cross-sectional area (dotted line), of the ridge axis with (middle) the presence of an axial magma chamber reflector and (bottom) the distribution of hydrothermal plumes for (a) Juan de Fuca Ridge, (b) northern East Pacific Rise, and (c) southern EPR. The top panel for each area shows reference lines at a net elevation of 0.35 km (solid line) and an area of 3.5 km2 (dashed line), as well as position and order of segment boundaries used here. Data are from Scheirer and Macdonald [1993]. The middle panel (EPR only) shows depth to AMC in terms of two-way travel time (TWTT) between seafloor and the AMC [Detrick et al., 1987, 1993]. The true AMC distribution may be somewhat more extensive, as off-axis ship wander can cause reflector drop-outs [Kent et al., 1993a, b]. Plume distribution is revealed by continuous two-dimensional transects of light attenuation anomalies caused by suspended hydrothermal precipitates. Plume incidence is the fraction of ridge length overlain by plumes with light attenuation anomalies exceeding the background, generally ~0.0050.01 m1. Plume incidence increases from ~0.28 on the JDFR, to ~0.38 on the northern EPR, to ~0.6 on the southern EPR.
Figure 4. Scatterplots of the mean and standard deviation of (a) Axs, (b) Enet, (c) AMC percent coverage, (d) MgO wt%, and (e) us against plume incidence ph for each of 14 segments. Standard deviations are not applicable for AMC and are negligible for spreading rate.
Figure 5. Detailed comparisons of plume distribution with AMC width (solid line) and depth (dashed line) reveal no systematic correlation. AMC width and depth from cross-axis seismic reflection lines along the (a) northern [Kent et al., 1993a, b] and (b,c) southern [Kent et al., 1994; Mutter et al., 1995] East Pacific Rise. Symbols on each line show location of cross-axis lines; no depth information is yet available for the 14°14.5°S section. "Net AMC depth" is depth to the AMC reflector less the thickness of layer 2A. This calculation accounts for changes in apparent AMC depth caused by ship wander and the rapid off-axis thickening of layer 2A.
Figure 6. Scatterplot of normalized values of geological indexes (except spreading rate) against plume incidence ph for each study area. The distribution defines two populations: low ph when the normalized index <0.3, and a highly variable ph when the normalized index is >0.3. Each area has indexes in both populations.
Figure 7. Scatterplot of the mean and standard deviation of normalized values of geological indexes (except spreading rate) against plume incidence ph for each studied segment plus five adjacent segments where all four indexes can be calculated but no continuous plume distributions are available. These segments are plotted below the ph = 0 line. Segment abbreviations are given in Figures 1 and 3.
Figure 8. Segment-by-segment plot of cross-sectional area Axs (dashed line) and net elevation Enet (solid line) for the (a) northern and (b) southern EPR. The horizontal line in each panel marks the 3.5 km2 Axs and 0.35 km Enet values, postulated as the approximate threshold for extensive hydrothermal activity. Locations of transform faults and other major features are also given.
Figure 9. (a) Scatterplot showing that at the regional scale, plume incidence ph is linearly correlated with mean values of spreading rate us, cross-sectional area Axs, and net elevation Enet. (b) Plot of Axs versus us. (c) Plot of Enet versus us. The linear relation in Figure 9a exists because for the three areas studied (solid symbols) both Axs and Enet are linearly correlated with us. This relation does not hold for other similar-sized regions of the superfast spreading southern EPR.
Return to References or go to Abstract