U.S. Dept. of Commerce / NOAA / OAR / PMEL / Publications
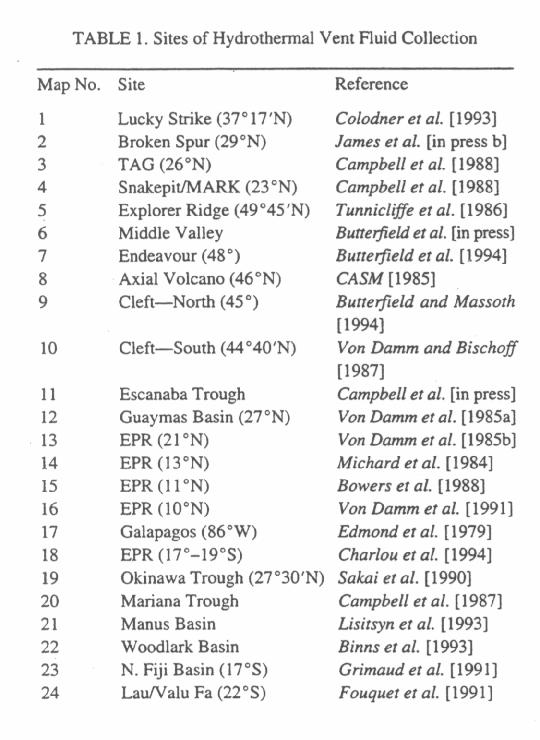
Table 1. Sites of hydrothermal vent fluid collection.
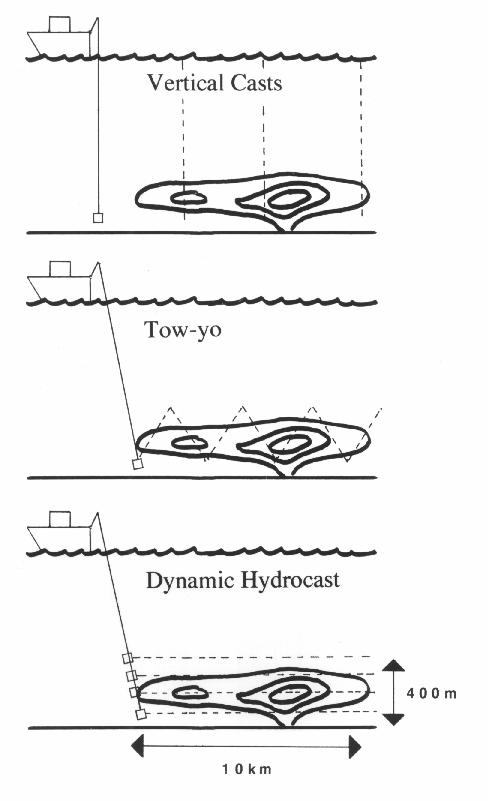
Fig. 1. Schematic comparison of three methods of shipboard plume mapping and sampling.
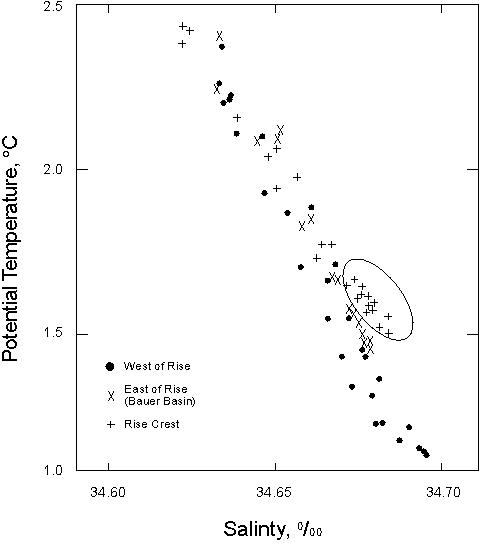
Fig. 2. Plot of potential temperature vs. salinity for discrete samples near the East Pacific Rise at 8°S showing hydrothermal heating at the rise crest (reprinted from Lonsdale [1976]).
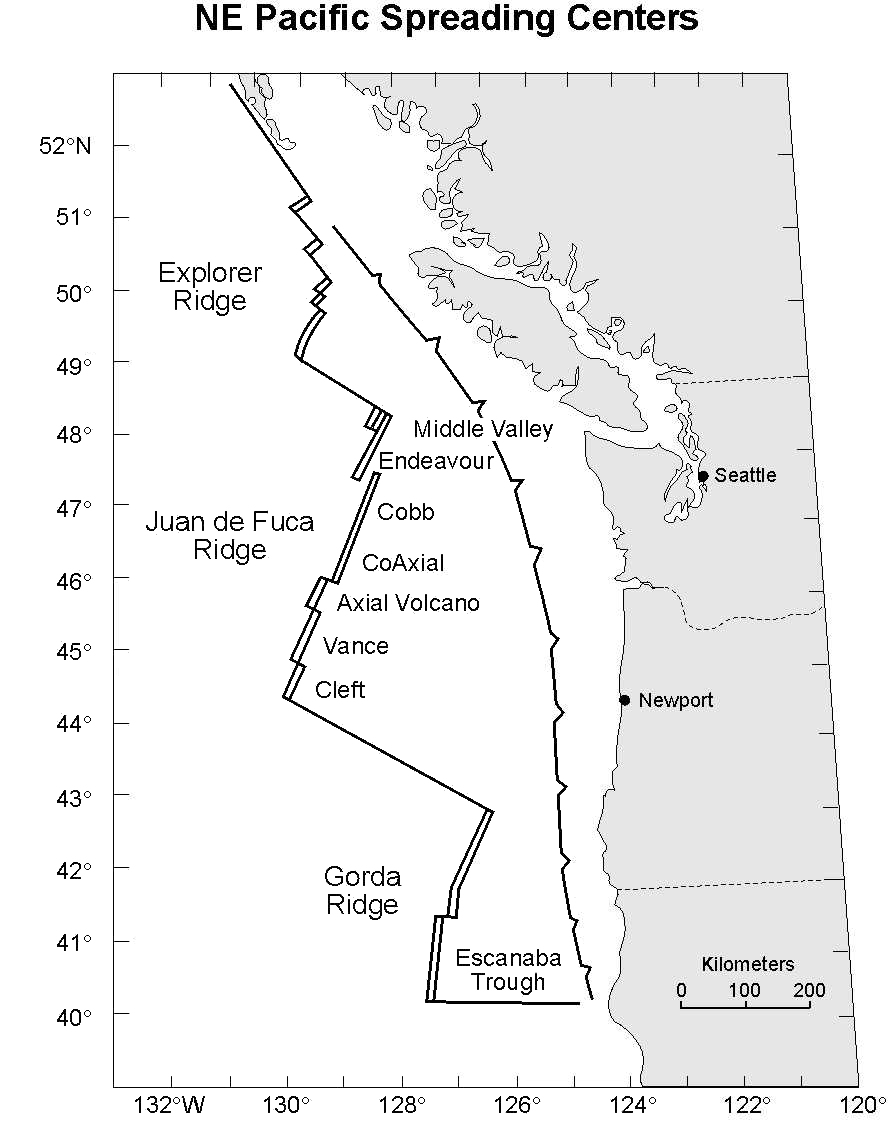
Fig. 3. Location map for northeast Pacific spreading centers.
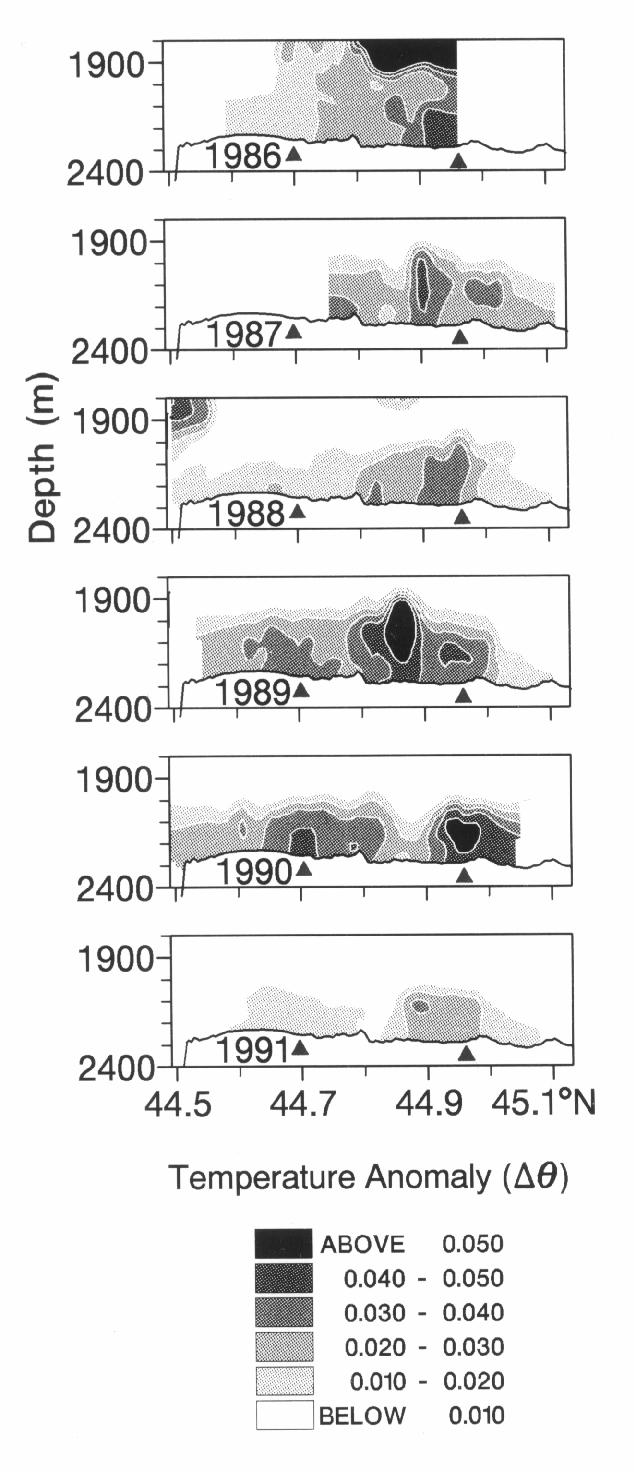
Fig. 4. CTD tow-yo transects of hydrothermal temperature anomaly (°C) along
the Cleft segment axial valley, 1986-1991. Triangles show location of known
venting sites. The lower half of event plume EP86 ("megaplume") is
apparent in the 1986 transect. The anomaly at
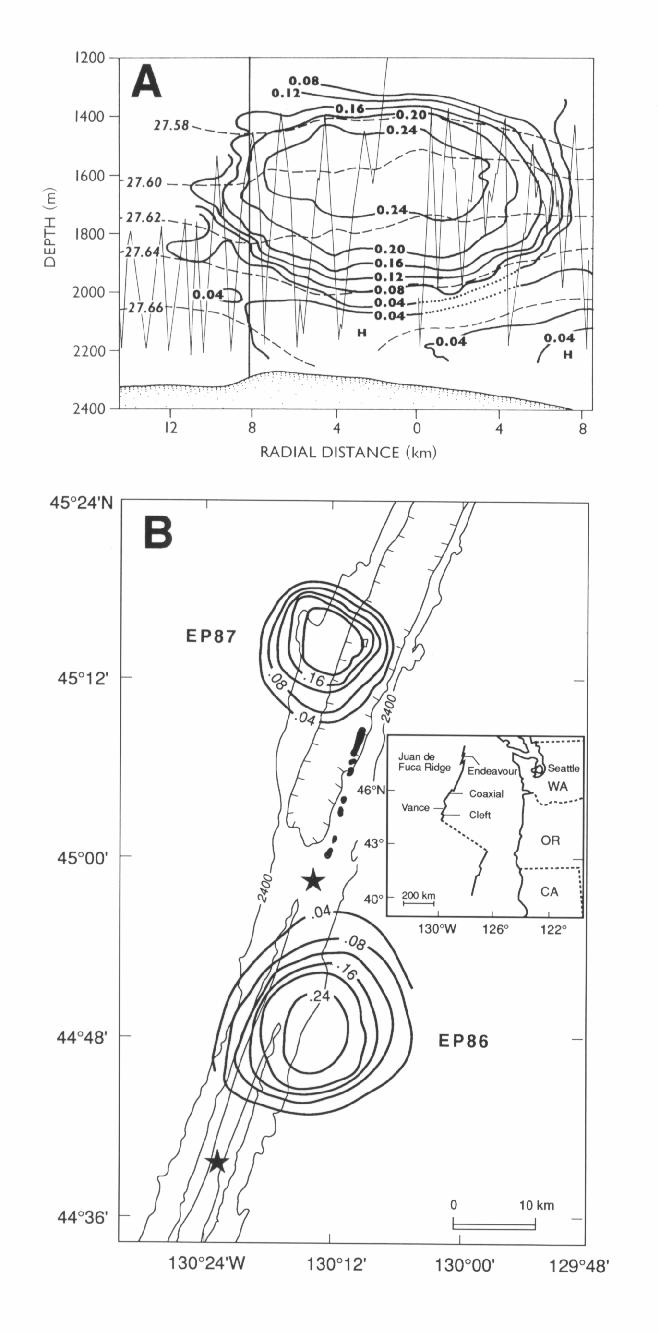
Fig. 5. (A) Cross-section of EP86 and underlying chronic plume (reprinted
from Baker
et al. [1989]). Contours are isolines of hydrothermal temperature anomaly
(°C). Potential density
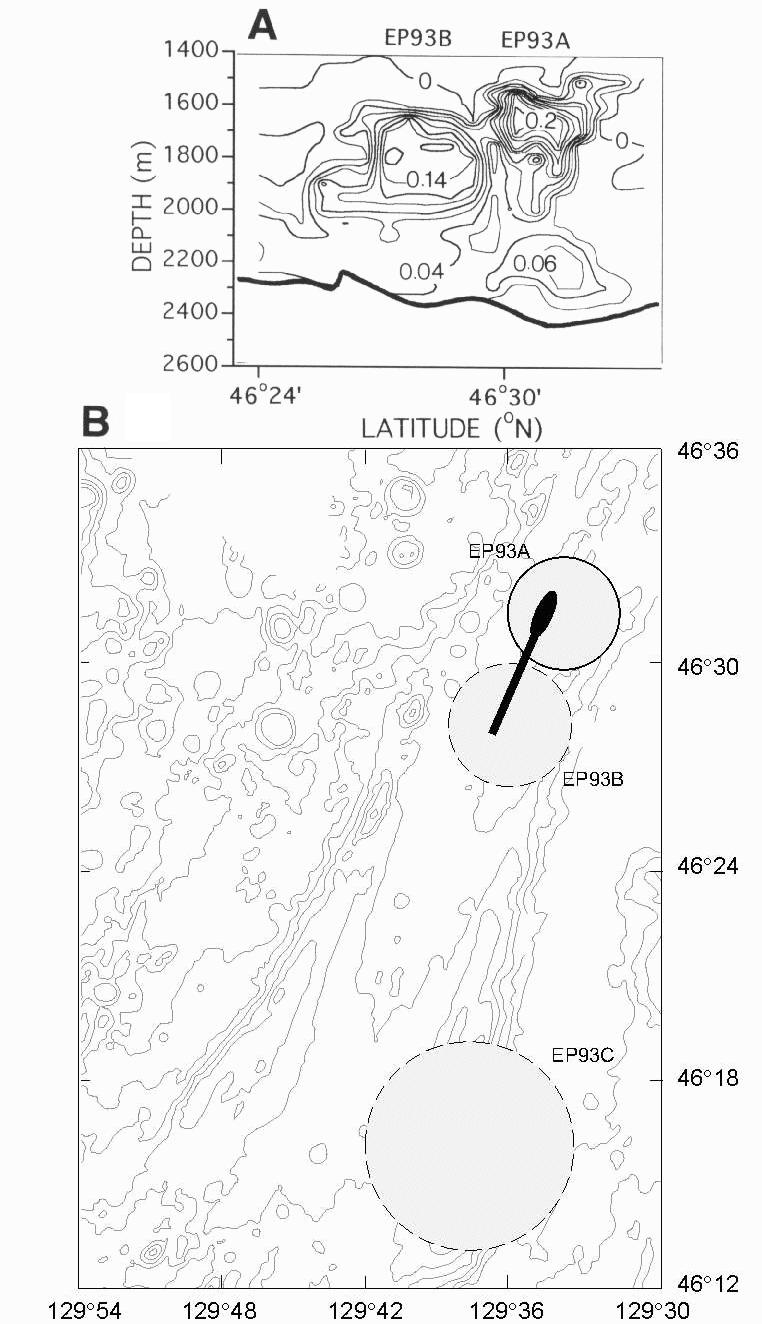
Fig. 6. (A) Cross-sections of two event plumes mapped over the CoAxial segment in July, 1993 [Baker et al., 1995]. Both plumes were smaller and had lower temperature anomalies than EP86 or EP87. (B) Plan view of all three CoAxial event plumes showing their relative locations when first discovered. EP93A and EP93B were found directly over the lava eruption mound (solid bead) and warm-water fissure (heavy line) near 46°30'N. EP93C was found two weeks after EP93A and EP93B; its discharge site is unknown.
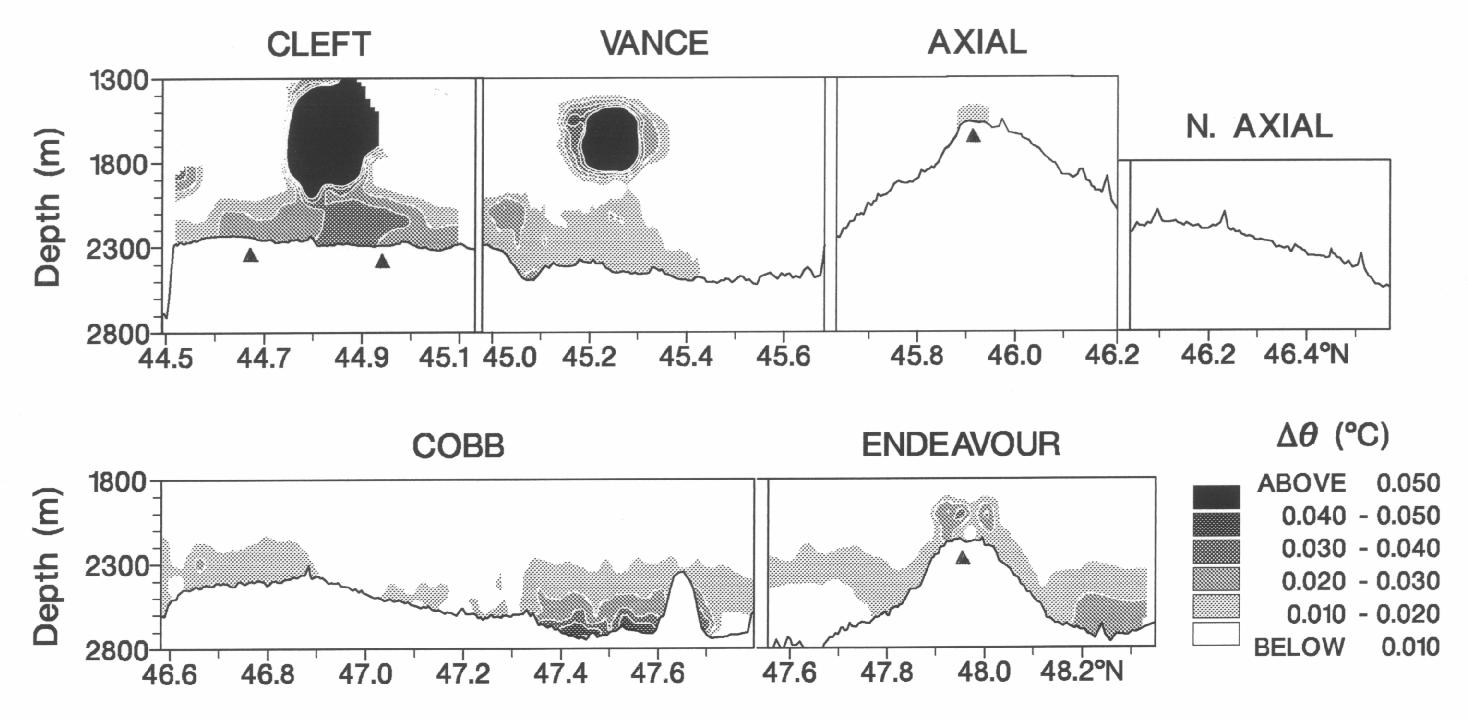
Fig. 7. Summary of hydrothermal temperature anomalies observed along the
crest of the Juan de Fuca Ridge, including Axial Volcano, from 1985 to 1989.
For clarity, segments and the overlying plumes are displayed individually, without
overlap. Triangles show location of known venting sites. Anomalies at the northern
end of the Cobb segment, 47.4°-47.6°N, are believed to mark an intrusion of
geothermally heated bottom water from Cascadia Basin to the east, rather than
axial hydrothermal heating (reprinted from Baker
and Hammond [1992]). Significant hydrothermal plumes 

 0.02°C)
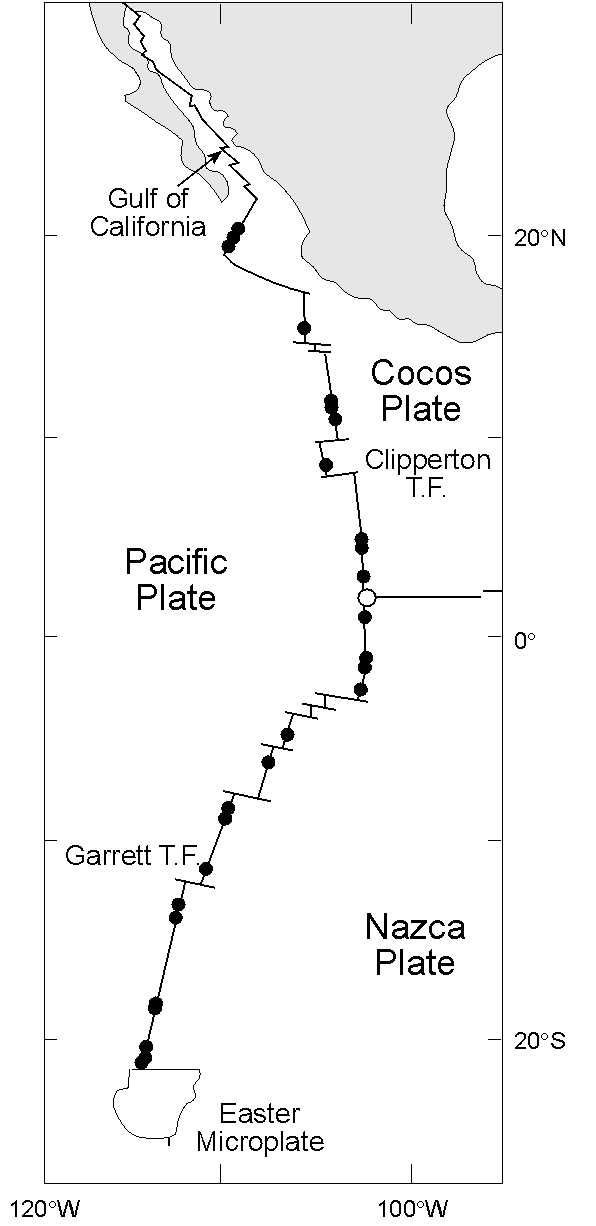
Fig. 8. Location map for East Pacific Rise spreading centers. Solid circles indicate locations of axial discontinuities.
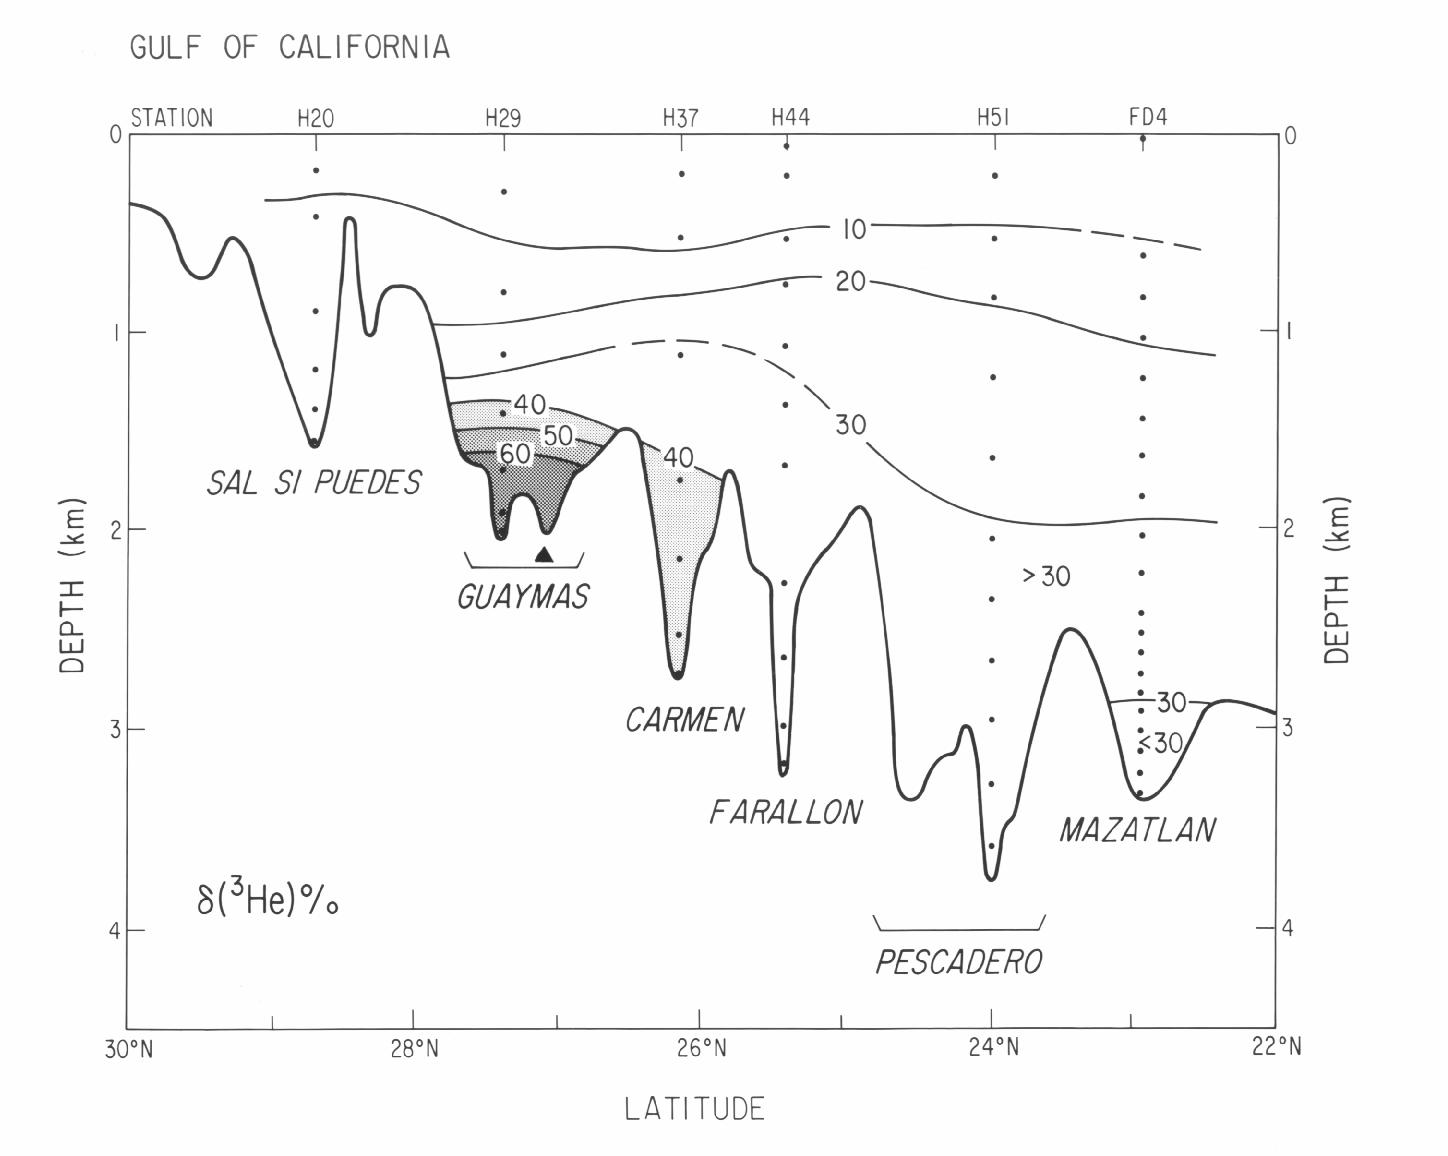
Fig. 9. A  (3He) section through
the Gulf of California showing evidence of hydrothermal venting in the Guaymas
Basin (reprinted from Lupton
[1979]). Triangle shows location of known venting sites in the Guaymas Basin.
(3He) section through
the Gulf of California showing evidence of hydrothermal venting in the Guaymas
Basin (reprinted from Lupton
[1979]). Triangle shows location of known venting sites in the Guaymas Basin.
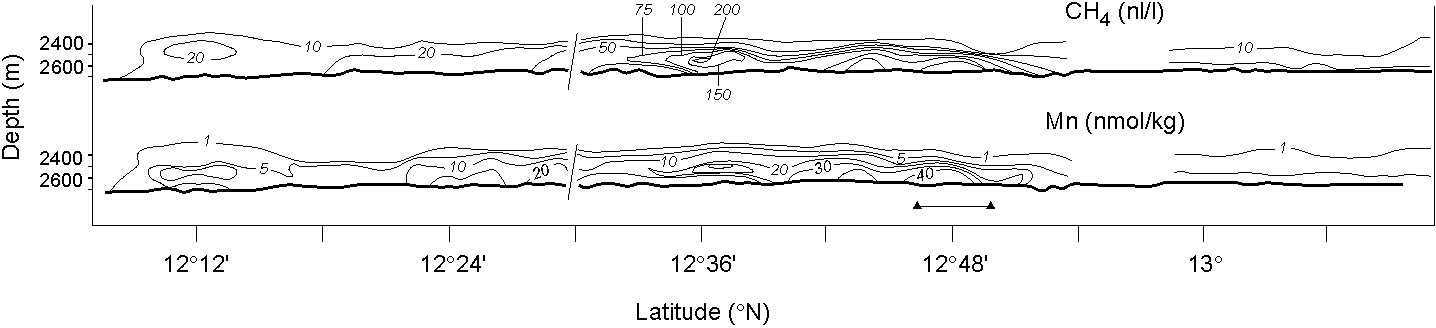
Fig. 10. Transects of methane and dissolved manganese along the East Pacific Rise determined from three Dynamic Hydrocast tows [after Bougault et al., 1990]. Connected triangles show area of known venting sites.
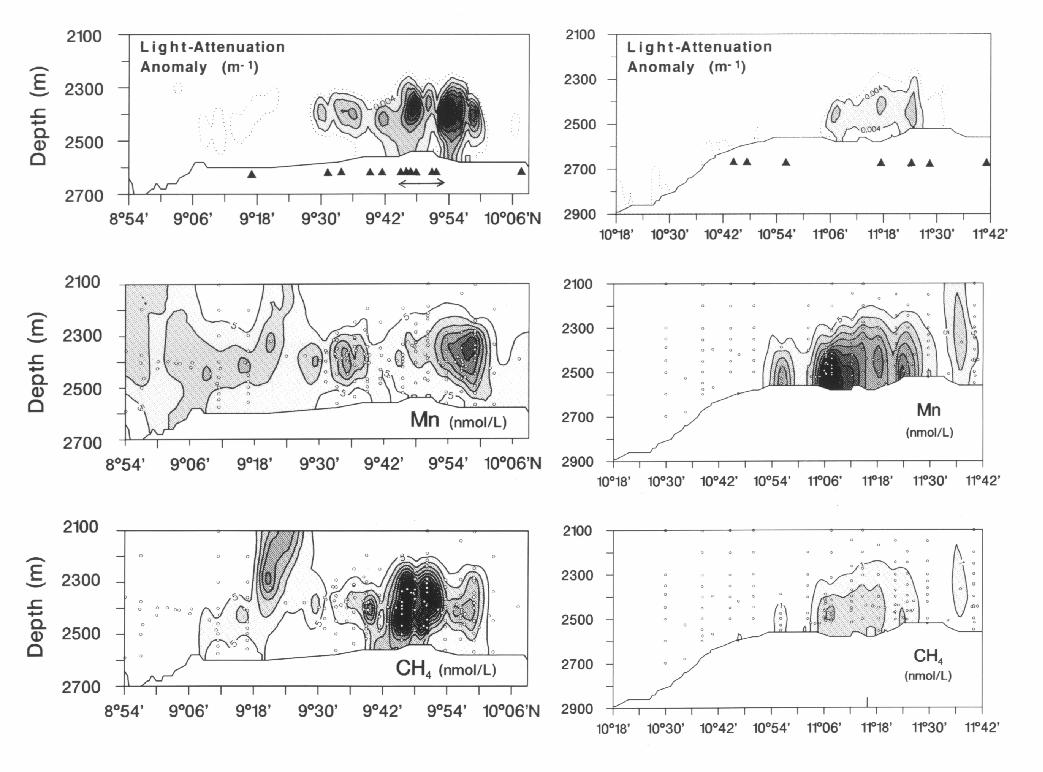
Fig. 11. Transects of light-attenuation anomaly (continuous tow-yo) [Baker
et al., 1994], dissolved Mn, and CH4 (both from discrete
samples) [Mottl
et al., 1995] obtained in November 1991 along the East Pacific Rise
south and north of the Clipperton Transform Zone. Contour intervals are
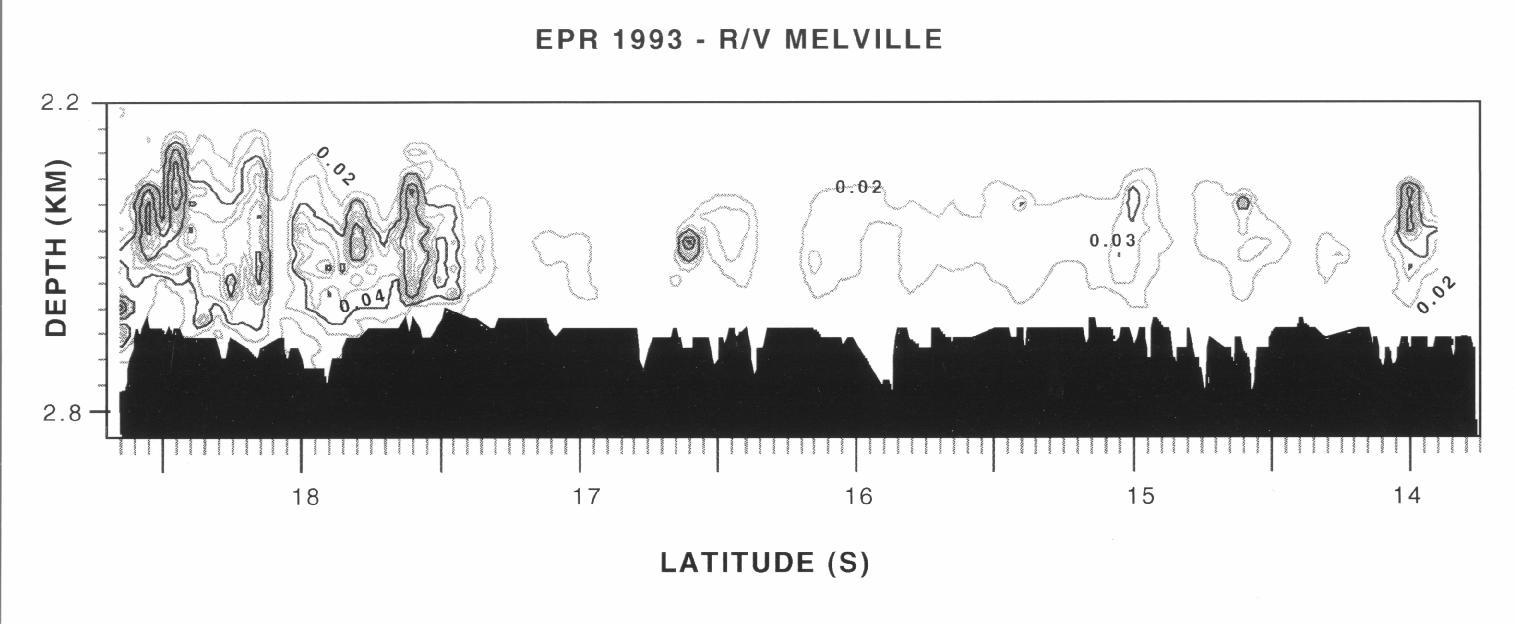
Fig. 12. Tow-yo transects of light attenuation along the East Pacific Rise
just south of the Garrett Transform Zone [Baker
and Urabe, 1994]. Nephelometer data are combined from five tow-yos,
comprising >1000 vertical profiles. Contour interval is  0.02 m-1
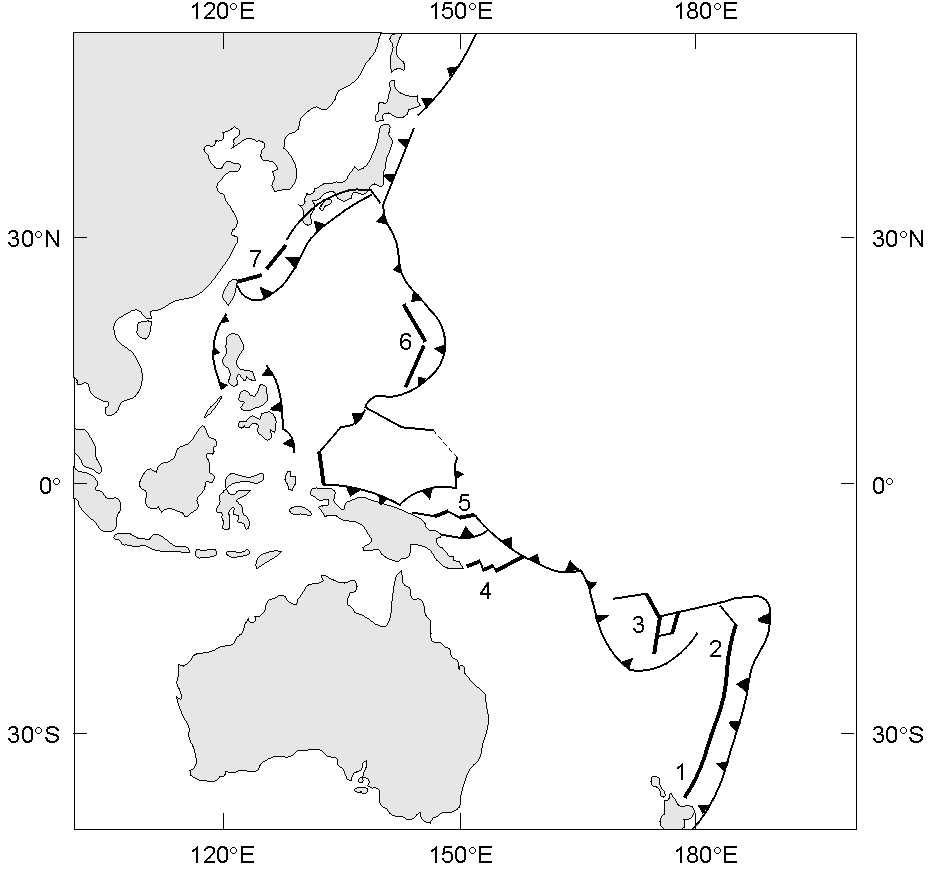
Fig. 13. Location map for western Pacific marginal basins. Thin lines are fracture zones, thick lines are spreading centers, and triangled lines are convergent plate edges. 1, Harve Trough; 2, Lau Basin/Valu Fa Ridge; 3, North Fiji Basin; 4, Woodlark Basin; 5, Manus Basin; 6, Mariana Trough; 7, Okinawa Trough.
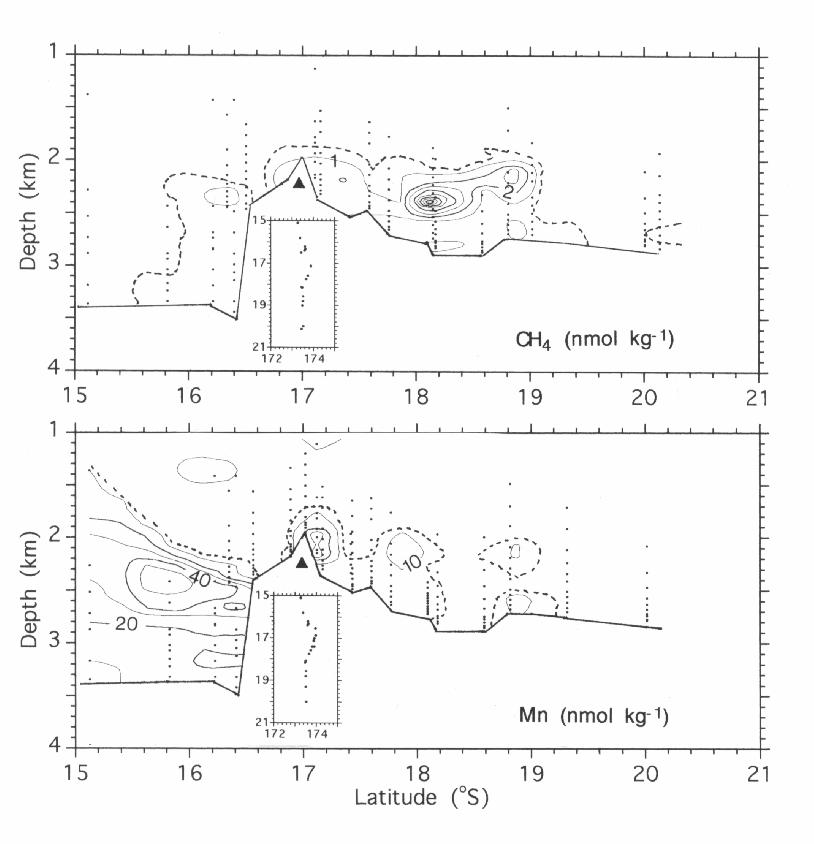
Fig. 14. Transects of methane and dissolved Mn along the central spreading axis in
the North Fiji Basin. Data compiled from published and unpublished sources (see text)
spanning several years. Note that the data base is not identical for each tracer. Contour
intervals are
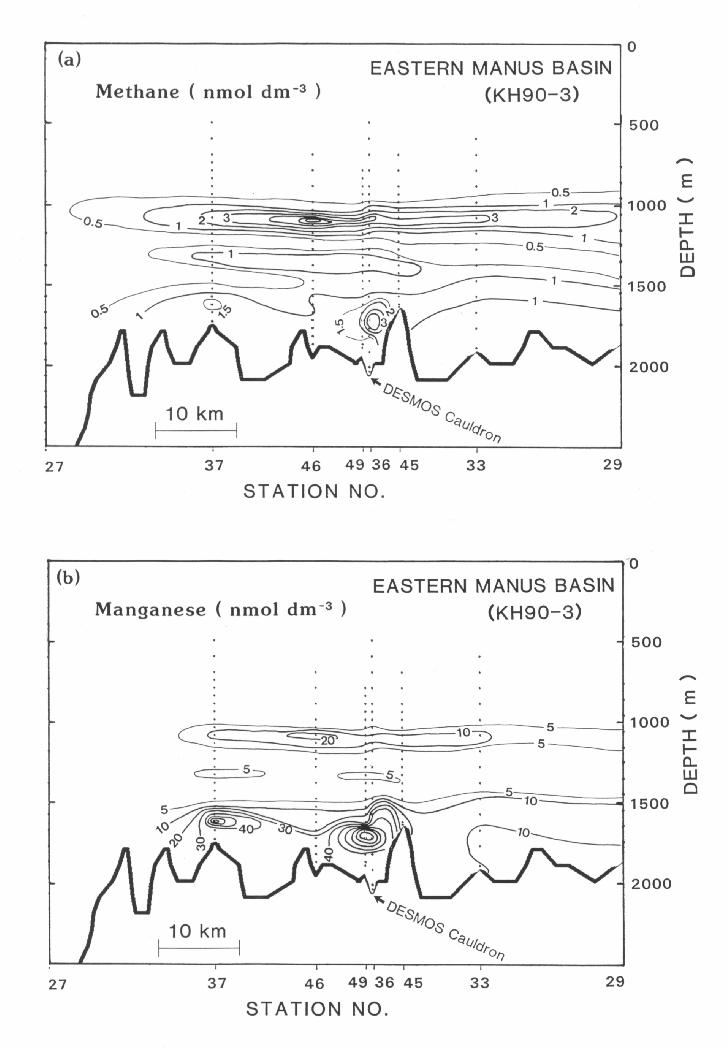
Fig. 15. Transects of methane and manganese collected in 1990 along the spreading center in the eastern Manus Basin (reprinted from Gamo et al. [1993] with kind permission from Elsevier Science Ltd., The Boulevard, Langford Lane, Kidlington OX5 16B, UK). The Papatua Expedition [Craig and Poreda, 1987] collected samples near stations 37 and 29. Triangle shows location of known venting sites.
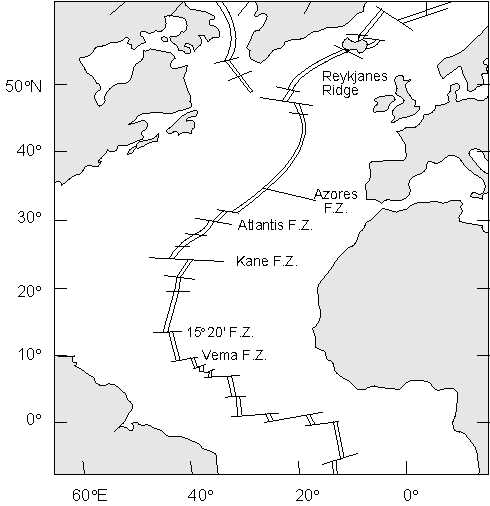
Fig. 16. Location map for the northern Mid-Atlantic Ridge and Reykjanes Ridge. Known and suspected hydrothermal sites identified in Figure 19.
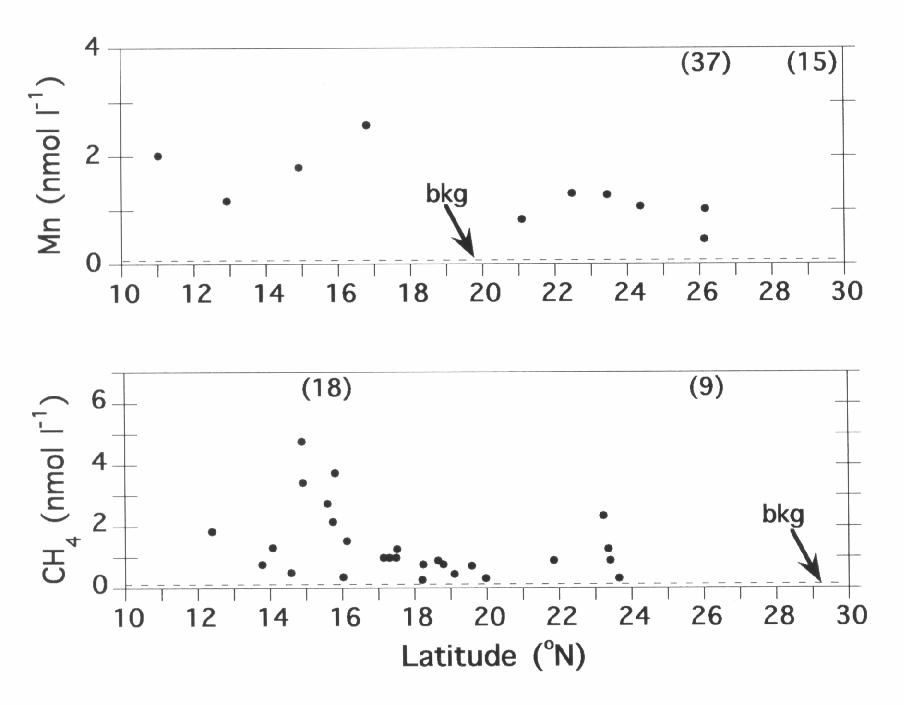
Fig. 17. Along-axis maxima in total reactive (~dissolved) Mn [Klinkhammer et al., 1985] and CH4 [Charlou and Donval, 1993] from vertical casts on the Mid-Atlantic Ridge. High values in parentheses at 26°N and 29°N are representative samples over the TAG [Klinkhammer et al., 1986] and Broken Spur [Elderfield et al., 1993] hydrothermal fields, respectively. Thin dashed line on each plot marks the regional background value of Mn and CH4.
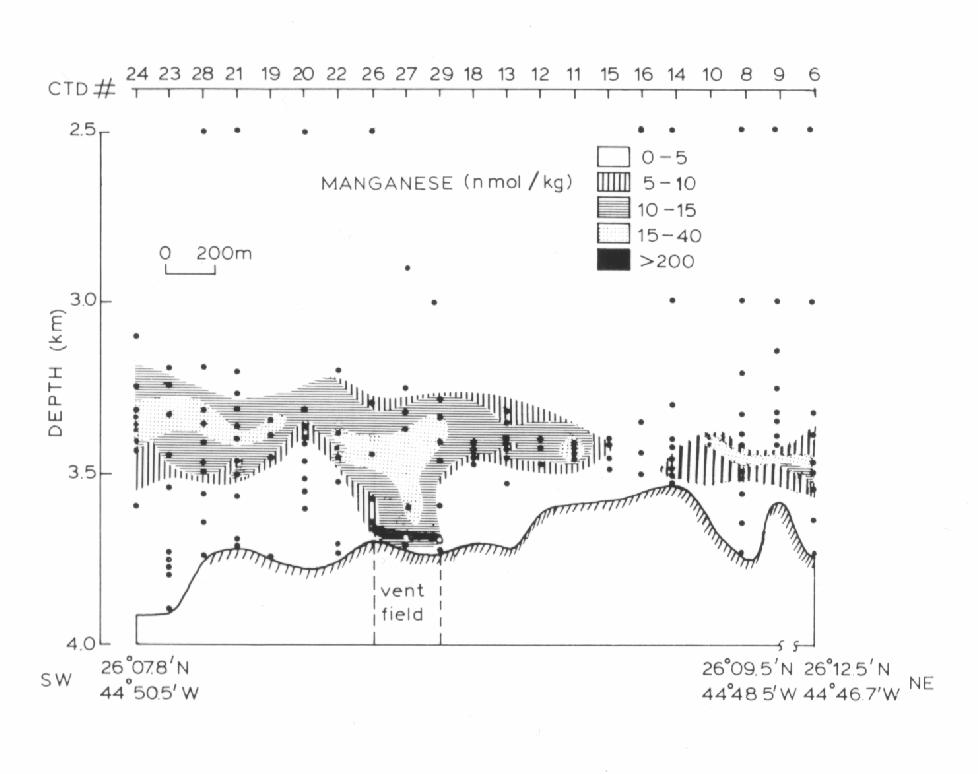
Fig. 18. Geochemical plume transect for total reactive Mn at the TAG hydrothermal site in 1985 (reprinted from Klinkhammer et al. [1986] with kind permission from Elsevier Science Ltd., The Boulevard, Langford Lane, Kiddington 0X5 16B, UK). Solid circles indicate sample positions.
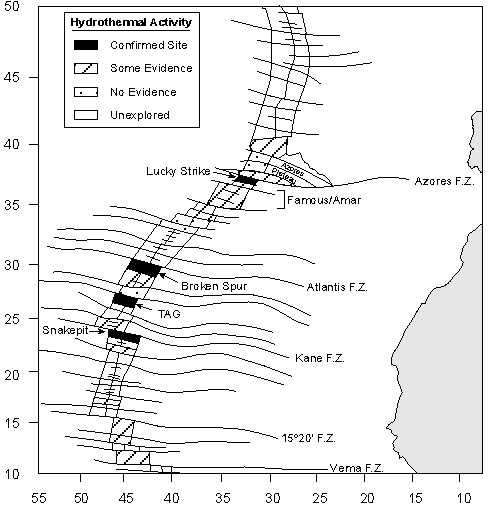
Fig. 19. Summary of evidence for hydrothermal venting along the Mid-Atlantic Ridge compiled from water-column investigations between 11° and 40°N [German et al., 1995]. Only four segments or segment portions have confirmed active venting.
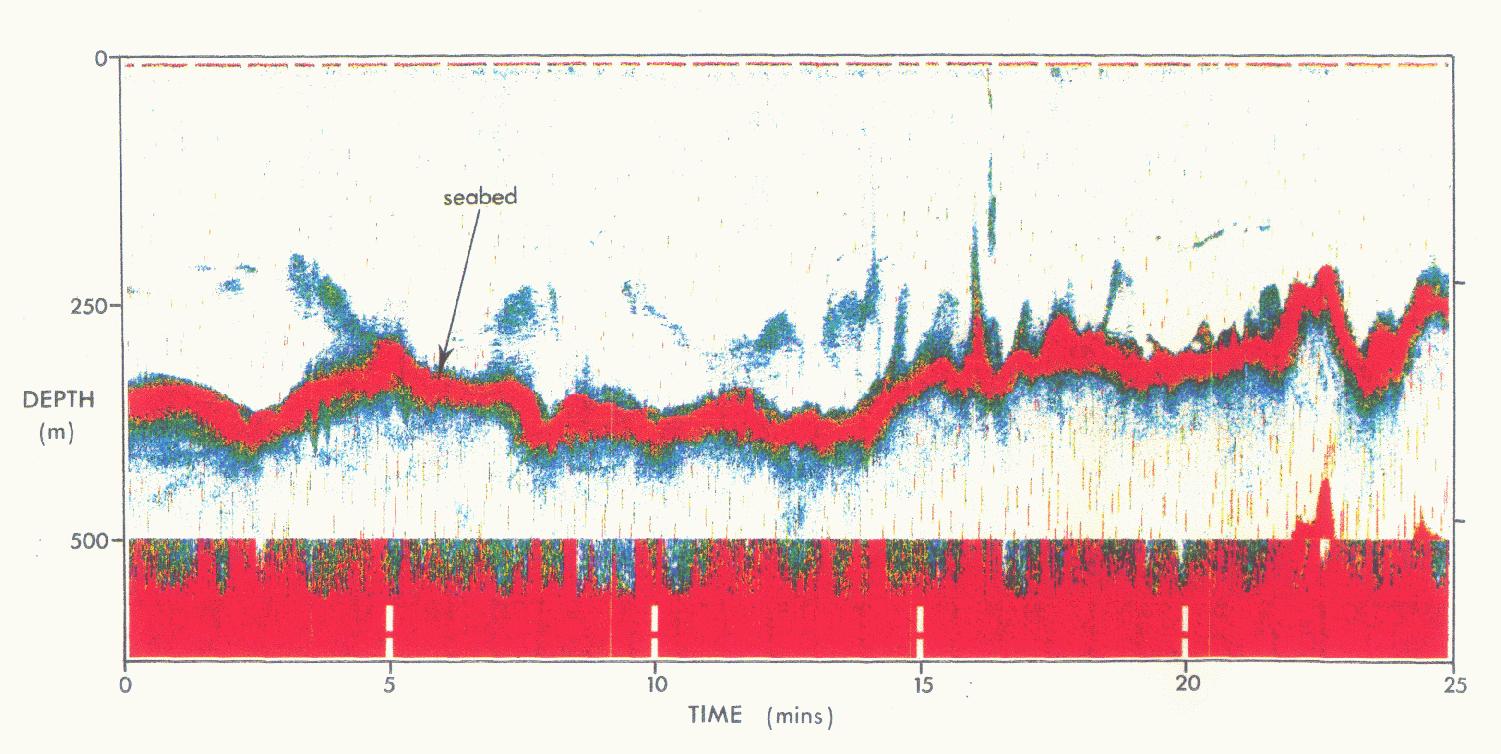
Fig. 20. 38 kHz echo-sounder trace from a transect along the axis of the Reykjanes Ridge between 63°06.04'N and 63°06.10'N, indicating the presence of gas-rich hydrothermal plumes rising from the seabed close to 63°06.06'N (reprinted from German et al. [1994] with kind permission from Elsevier Science Ltd., The Boulevard, Langford Lane, Kidlington OX5 1GB, UK).
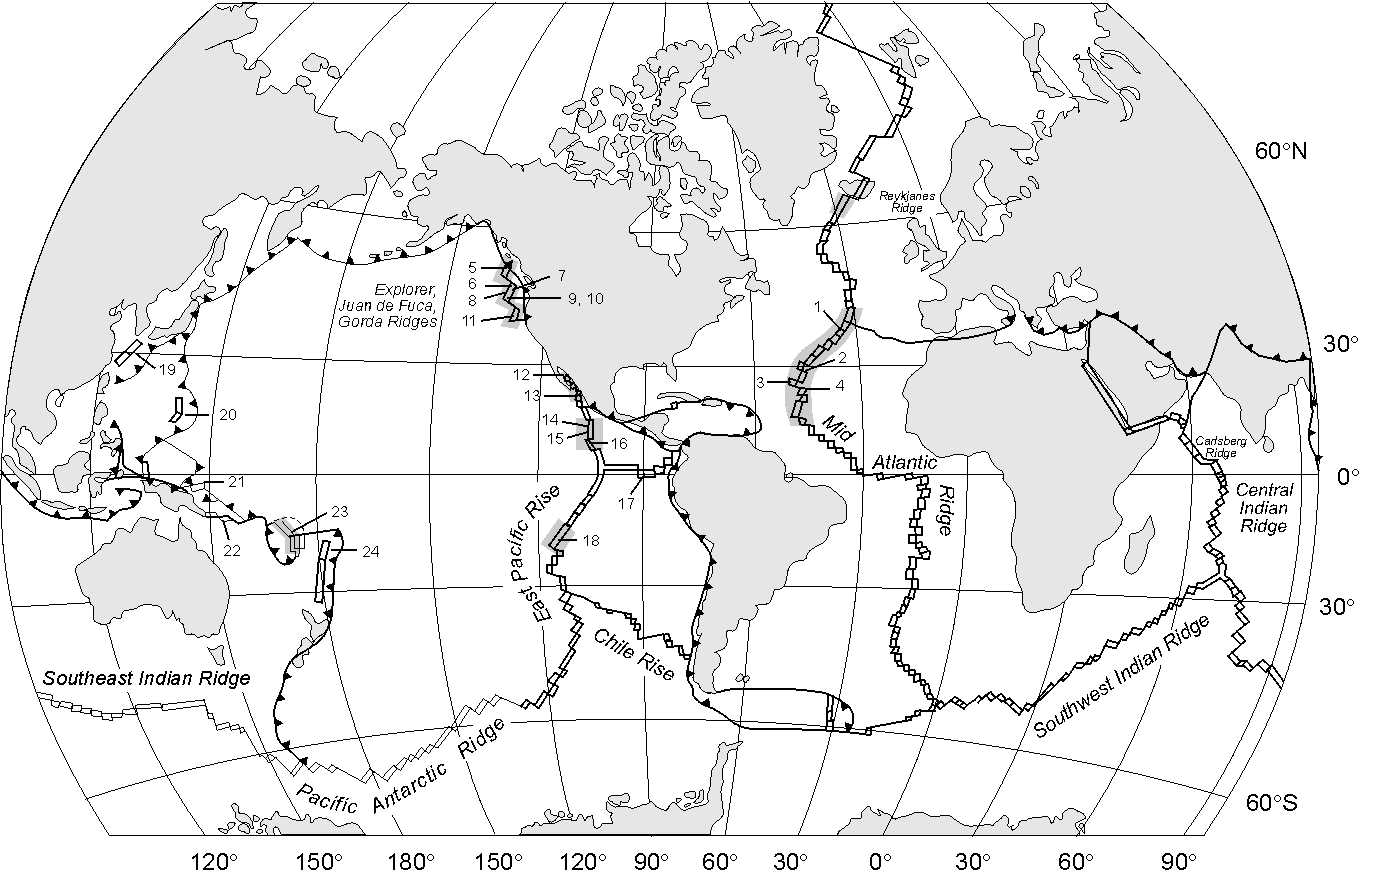
Fig. 21. Comparison of the global extent of plume studies and seafloor vent fluid sampling. Shaded areas on spreading centers mark the locations of multi-segment plume mapping investigations on the Reykjanes Ridge, Mid-Atlantic Ridge, northeast Pacific ridges, Gulf of California, northern and southern East Pacific Rise, and the north Fiji Basin. Numbers refer to Table 1 and mark sites of vent fluid collection and analysis along spreading centers; fluid discharge sites noted only from visual observations are not included.
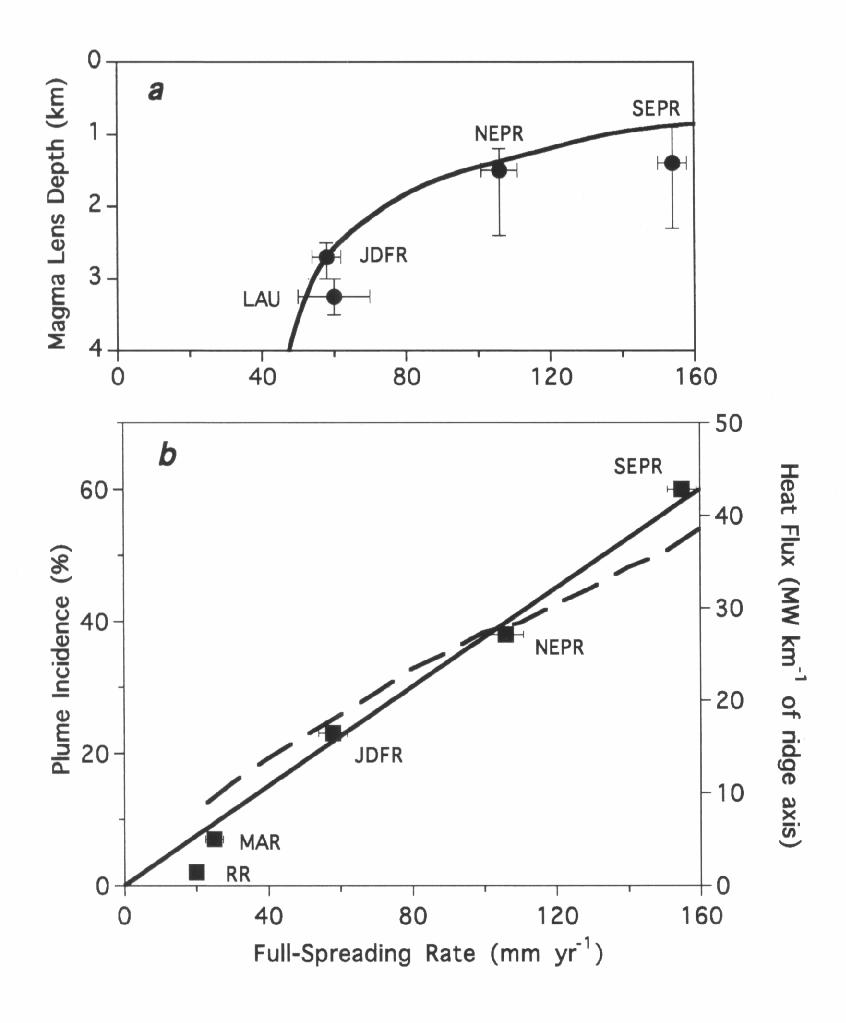
Fig. 22. (a) Full-rate seafloor spreading vs. axial magma chamber depth
from seismic observations [Purdy
et al., 1992] (solid circles; LAU, Valu Fa Ridge in the eastern Lau
Basin; JDFR, Cobb segment on the Juan de Fuca Ridge; NEPR, northern East Pacific
Rise, 9°-13°N; SEPR, southern EPR, 14°-20°S) and from the Phipps
Morgan and Chen [1993] crustal thermal model (solid line). (b) Full-rate
seafloor spreading vs. plume incidence (solid squares) and hydrothermal cooling
in the neovolcanic zone according to a crustal thermal model (Y. J. Chen and
J. Phipps Morgan, The effect of magma emplacement geometry, spreading rate,
and crustal thickness on hydrothermal heat flux at mid-ocean ridges, submitted
to Geophys. Res. Lett., 1994) (dashed line). Plume incidence data available
for the Reykjanes Ridge (RR) [German
et al., 1995], Mid-Atlantic Ridge (MAR) (11°-40°N) [German
et al., 1994], JDFR [Baker
and Hammond, 1992], NEPR (8°40-13°10'N) [Bougault
et al., 1990; Baker
et al., 1994], and SEPR (13°50'-18°40'S) [Baker
and Urabe, 1994]. "Plume incidence" is the percentage of axis
length overlain by a significant (plume tracer values greater than background
mean plus three standard deviations) plume. The heavy solid line is a least-squares
fit forced through the origin:
Return to References or go back to Abstract