
U.S. Dept. of Commerce / NOAA / OAR / PMEL / Publications
Fig. 1. Potential density plotted against potential temperature for selected
axial valley CTDT casts in 1986, 1987 and 1988. Each curve has a slope of -4.865░C
m Kg
Kg (shown
by the straight line) except where hydrothermally affected. 1986 casts in the
axial valley sampled only a thin horizon of ambient water (~27.635-27.640
(shown
by the straight line) except where hydrothermally affected. 1986 casts in the
axial valley sampled only a thin horizon of ambient water (~27.635-27.640  )
between the steady-state plume and the overlying megaplume. Density of the water
in the axial valley was significantly lower in 1986 because of enhanced vertical
mixing of the lowermost 1,000 m by the megaplume discharge. Such vertical mixing
does not affect the ambient
)
between the steady-state plume and the overlying megaplume. Density of the water
in the axial valley was significantly lower in 1986 because of enhanced vertical
mixing of the lowermost 1,000 m by the megaplume discharge. Such vertical mixing
does not affect the ambient ![]() -
relationship. The maximum temperature anomaly, defined as the temperature deviation
from the background trend along an isopycnal, was about the same on each cast.
Insets show vertical profiles of the temperature and light-attenuation (proportional
to the concentration of fine-grained hydrothermal precipitates) anomalies for
each cast. Increased anomalies above 1,950 m in 1986 indicate the megaplume
presence. Depth of the steady-state plume maximum was ~2,100 m each year. For
each cast the light-attenuation and temperature anomalies go to zero at the
same depth, supporting our interpretation of the vertical distribution of temperature
anomaly.
-
relationship. The maximum temperature anomaly, defined as the temperature deviation
from the background trend along an isopycnal, was about the same on each cast.
Insets show vertical profiles of the temperature and light-attenuation (proportional
to the concentration of fine-grained hydrothermal precipitates) anomalies for
each cast. Increased anomalies above 1,950 m in 1986 indicate the megaplume
presence. Depth of the steady-state plume maximum was ~2,100 m each year. For
each cast the light-attenuation and temperature anomalies go to zero at the
same depth, supporting our interpretation of the vertical distribution of temperature
anomaly.
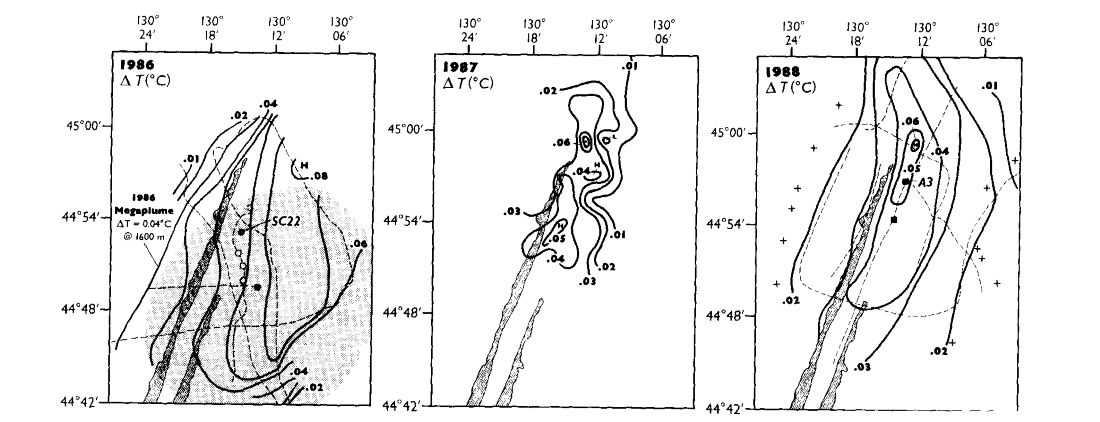
Fig. 2. Areal maps of the steady-state plume as described by the maximum temperature
anomaly between 2,000 m and 2,200 m along CTDT tow tracks (dashed lines) and vertical
casts (crosses or solid symbols) in 1986, 1987 and 1988. He
samples were collected during tows (open symbols) or on vertical casts (solid symbols);
the locations of the Fig. 1 profiles are indicated. Hatched areas are the walls of the
axial valley as defined by the 2,200-m bathymetric contour. In each year the plume was
~200 m thick and centred ~150 m above the floor of the axial valley (see Fig. 1). The
plume was more extensive in 1986 than in either 1987 or 1988. The size and location of the
1986 megaplume is shown by shading.
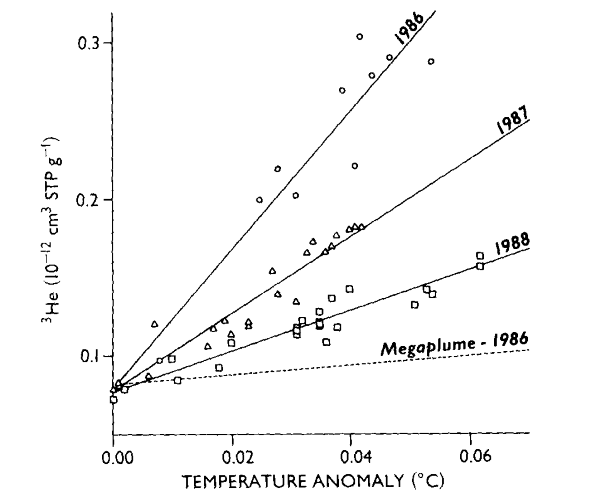
Fig. 3. He concentration plotted against
temperature anomaly for samples in steady-state plume from 1986, 1987 and 1988. Sample
locations shown in Fig. 2. Least-squares trend of 1986 megaplume samples (which had a
maximum temperature anomaly of ~0.26░C) shown for comparison. Least-squares regression
shows that the He/ T
ratio decreased from 4.4 to 2.4 to 1.3 ū 10
T
ratio decreased from 4.4 to 2.4 to 1.3 ū 10 cm STP g ░C from 1986 to 1988. A t-test analysis indicates that
these ratios are all significantly different from each other at the 95% confidence level.
cm STP g ░C from 1986 to 1988. A t-test analysis indicates that
these ratios are all significantly different from each other at the 95% confidence level.
Go back to text of paper