U.S. Dept. of Commerce / NOAA / OAR / PMEL / Publications
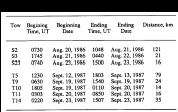
Table 1. Sequence and duration of CTD tows.
Figure 1. Bathymetry of the Cleft and Vance segments on the Juan de Fuca Ridge. Tracks of the CTD tows used to define megaplume 1 (at ~44°50′N) and megaplume 2 (at ~45°15′N) are also shown.
Figure 2. Plan view of megaplume 1 and 2 temperature anomaly (°C) contours on the 27.61σθ (~1600 m) surface. Megaplume 2 was centered about 45 km north of the original position of megaplume 1. Both plumes were radially symmetric about their vertical axis.
Figure 3. Cross sections of temperature anomaly (°C) and light attenuation (m−1) for megaplumes 1 and 2. Note that the vertical distribution of heat and particles was identical in megaplume 1 but that the particle concentration maximum was displaced downward by ~100 m in megaplume 2. Dotted lines show σθ surfaces, and sawtooth curves trace the CTD towpath. The vertical line labeled "profile" in the cross sections marks the location of the chemical profiles in Figure 5.
Figure 4. (Opposite) Scanning electron micrographs of hydrothermal minerals: (a) fresh anhydrite from the center of megaplume 1, (b) slightly degraded anhydrite from the edge of megaplume 1, (c) elemental sulfur and chalcopyrite from the center of megaplume 1, and (d) highly degraded anhydrite (overlain by other types of particles) from the center of megaplume 2. The anhydrite particles were identified by their distinctive morphology and by X ray spectra dominated by Ca and S. The arrow in Figure 4d points to the edge of the anhydrite grain.
Figure 5. Vertical profiles of (a) dissolved and (b) particulate hydrothermal constituents of megaplumes 1 and 2. The megaplume 1 profile was taken on the plume edge, whereas the megaplume 2 profile was taken near the center (see Figure 3), so profiles of conservative constituents are similar even though megaplume 1 was actually more concentrated than megaplume 2.
Figure 5. (continued)
Figure 6. Scatter plots of 3He concentration versus (a) enthalpy anomaly, (b) dissolved silica anomaly, and (c) dissolved Mn in megaplume 1 and megaplume 2. Plotted for comparison are corresponding slopes (forced through a point representing ambient seawater) from high-temperature fluids sampled on the East Pacific Ridge, Guaymas Basin, and the southern Juan de Fuca Ridge at 44°40′N. The following data are given: 3He and heat data from 21°N [Welhan and Craig, 1983], 13°N [Merlivat et al., 1987], Guaymas [Lupton, 1983], and southern JDFR [Kennedy, 1985]; silica from 21°N [Von Damm et al., 1985a], Guaymas [Von Damm et al., 1985b], and southern JDFR [Von Damm and Bischoff, 1987]; Mn at 21°N [Von Damm et al., 1985a, 1983], Guaymas [Von Damm et al., 1985b], and southern JDFR [Von Damm and Bischoff, 1987].
Figure 7. Progressive vector diagrams from current meters deployed near the megaplume 1 site. The paths represent the cumulative displacement inferred from the net velocity of water past each mooring. The Juan de Fuca Ridge axis is shown for scale. Mooring V1 was recorded from May 25, 1984, to June 17, 1985; V8, from June 9, 1985, to April 13, 1986; and V9, from August 16, 1986, to July 27, 1987. Crosses represent 30-day intervals along each path. Circles on the ridge crest show the locations of megaplumes 1 and 2.
Figure 8. Relationship between plume rise height and the vent heat flux per meter of vent fissure for a linear plume with an entrainment coefficient of 0.1. The megaplume 1 rise height required a heat flux of ~3.5 × 10⁸ J m−1 s−1.
Figure 9. Vertical profiles of temperature (T), excess salinity (ΔS), plume width (b), and vertical velocity (w) for a linear plume with an exit velocity of 2.5 m/s.
Go back to previous section
Go back to abstract