U.S. Dept. of Commerce / NOAA / OAR / PMEL / Publications
Evidence of large-scale episodic venting of hydrothermal fluids was initially discovered in August 1986 in the form of a 130-km3 radially symmetric "megaplume" over the southern Juan de Fuca Ridge. We report here on the discovery in September 1987 of a second, smaller megaplume about 45 km north of the location of the first megaplume. The 3He/heat, 3He/dissolved Mn, and 3He/dissolved silica ratios in both megaplumes were typical of high-temperature vent fluids. Evidence from long-term records of current flow over the southern Juan de Fuca Ridge, and from the mineralogy and Mn chemistry of megaplume particles, makes it unlikely that the second megaplume was a reencounter of the first. A plume model that relates the heat flux to the observed plume rise height of ~1000 m finds that the total heat content of the fluids that formed the megaplumes was 1016−1017J, or equivalently a fluid volume of 3−8 × 10⁷ m3 at 350°C. The geometry and suspended particle population of the first megaplume imply that such features are formed within a few days time. The extraordinary heat and volume fluxes associated with megaplumes (102−103 greater than ordinary vent fields), as well as their typical hydrothermal chemistry, suggest that they resulted from tectonic or hydraulic fracturing that suddenly increased the permeability of the hydrothermal fluid reservoir in the axial crust. The flux of hydrothermal heat from continuous venting and episodic megaplumes on the southern Juan de Fuca Ridge is presently 4–10 × 109 W, a factor of 5–10 greater than various geophysical model calculations for this ridge segment. This imbalance may be symptomatic of a recent surge in the local cycle of magmatic activity.
An understanding of the flow of mass and energy between the crust and the ocean requires an understanding of hydrothermal circulation within oceanic spreading centers. The most common expression of hydrothermal circulation found during the first decade of observations has been the steady emission of fluid from ridge axis hot springs marked by an at least decadal-scale stability in both composition and output [Campbell et al., 1988; Bowers et al., 1988]. The degree to which this class of hydrothermal activity is dominant over other types has obvious implications for the calculation of global hydrothermal budgets and our insight into fluid-rock interactions within the crust.
The recent and intriguing discovery of a "megaplume" apparently formed by the sudden and massive release of hydrothermal fluid on the Juan de Fuca Ridge (JDFR) [Baker et al., 1987] vividly demonstrated the existence of another class of hydrothermal activity: episodic venting on a very large scale. A cataclysmic release of hydrothermal fluids, ~108 m3 within several days time, implies the existence of previously unconsidered fluid flow processes in the axial crust and the inadequacy of steady state models of hydrothermal heat and mass discharge. Such events, if they are found to be widespread along the ocean ridge system, raise a challenge to the conventional view that hydrothermal emissions are supplied only by steadily discharging hot springs.
We report here additional evidence for the existence of episodic hydrothermal events. This evidence takes the form of a second megaplume found 13 months later and in the same general area of the JDFR as the first. We first review the similarities and differences between the two megaplumes and then address the issue of source conditions using a model of turbulent buoyancy-driven convective fluids. The model is used to infer the conditions of heat and mass flux required to form a megaplume-type feature. Finally, we discuss some hydrothermal and tectonic implications of these observations.
Both megaplume discoveries have come during extensive hydrographic and chemical surveys designed to map the distribution of hydrothermal emissions over and around the crest of the southern JDFR. Deep-two data were collected by a Sea-Bird conductivity-temperature-depth sensor (CTD) and a Sea Tech 0.25-m path length transmissometer continuously cycled through the bottom 400–1000 m of the water column while towed from a surface ship. Effective precision of the measurements was ±0.001°C for temperature, ±0.002‰ for salinity, and ±0.001 m−1 for light attenuation. Hydrothermal plumes were identified in real time by the presence of light attenuation and temperature anomalies. The plume temperature anomaly (ΔT) is the deviation along the potential temperature (θ ) axis from the normally linear relationship between potential density (σθ) and θ [Lupton et al., 1985]. The temperature anomaly thus calculated is relative to ambient water of the same potential density as the neutrally buoyant plume.
Primary navigation was by Loran C; position relative to the axial bathymetry was determined by Sea Beam and by acoustic navigation where transponders were within range. The time, duration, and distance of each tow is given in Table 1.
| Tow | Beginning | Beginning | Ending | Ending | Distance, |
|---|---|---|---|---|---|
| Time, UT | Date | Time, UT | Date | km | |
| S2 | 0730 | Aug. 20, 1986 | 1048 | Aug. 21, 1986 | 121 |
| S3 | 1745 | Aug. 21, 1986 | 0440 | Aug. 22, 1986 | 21 |
| S23 | 0740 | Aug. 23, 1986 | 1500 | Aug. 23, 1986 | 16 |
| T5 | 1230 | Sept. 12, 1987 | 1803 | Sept. 13, 1987 | 79 |
| T9 | 0630 | Sept. 19, 1987 | 1540 | Sept. 19, 1987 | 24 |
| T10 | 1805 | Sept. 19, 1987 | 0110 | Sept. 20, 1987 | 14 |
| T11 | 0303 | Sept. 20, 1987 | 0850 | Sept. 20, 1987 | 16 |
| T14 | 0220 | Sept. 23, 1987 | 1507 | Sept. 23, 1987 | 35 |
Water samples were collected during some of the tows by rosette-mounted 30-L Niskin bottles internally coated with Teflon and with silicon tubing springs. The suspended particles were isolated by N2 pressure filtration through 0.4-μm pore size Nuclepore polycarbonate filters. Elemental particulate chemistry was determined by X ray primary and secondary emission spectrometry using a Kevex Super 8000-770 X ray spectrometer with a Rh source and a Ge secondary target [Feely et al., 1987]. Individual grain identification and sizing were performed on an International Scientific Instruments DS130S scanning electron microscope coupled to the Kevex spectrometer. Dissolved Mn in acidified samples was determined onshore by flameless atomic absorption spectrometry after Klinkhammer [1980]. Nutrient samples were collected in 250-mL plastic amber bottles and analyzed spectrophotometrically at sea using a Technicon Autoanalyzer. Helium samples were collected and stored in copper tubes after cold-weld sealing [Young and Lupton, 1983] and measured by mass spectrometry at the University of California, Santa Barbara.
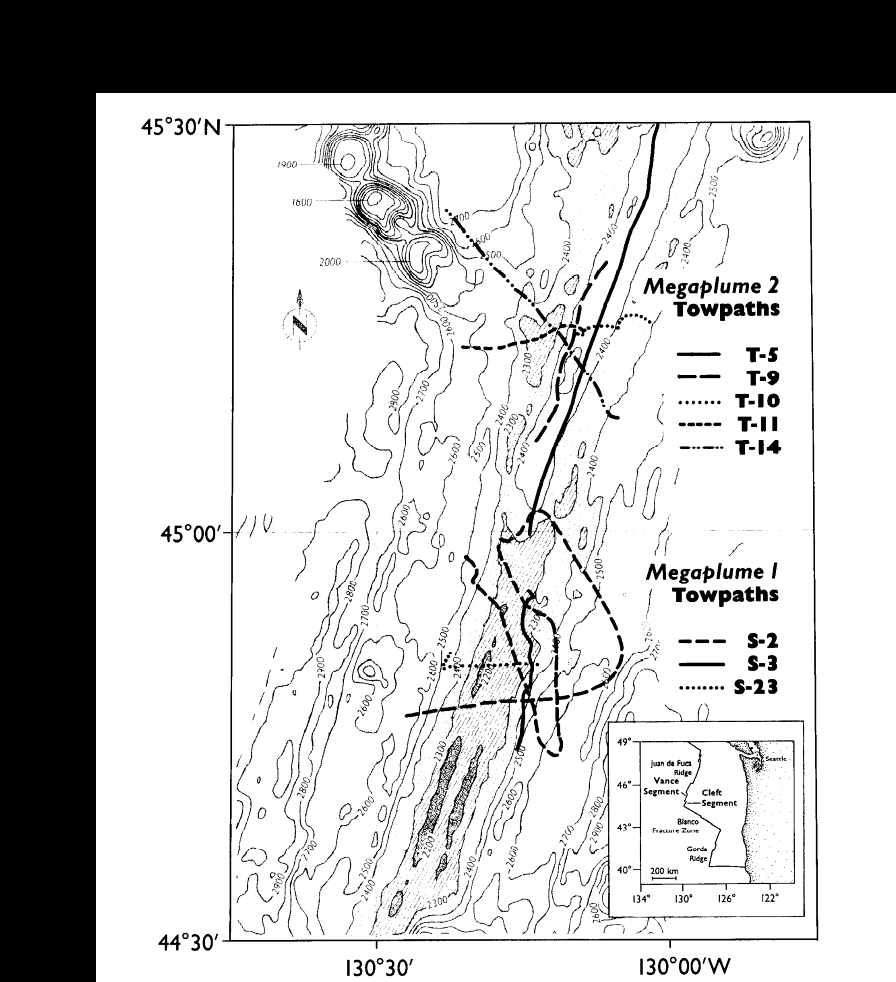
The Cleft Segment (also known as the Southern Symmetrical Segment or rift A) of the JDFR is a 55-km-long dome bounded on the south by the Blanco Fracture Zone and on the north by the Vance Segment, which is offset 5 km to the west at 45°N (Figure 1). Descriptions of the morphology of this segment by Kappel and Ryan [1986] emphasize the ubiquity of recent volcanic flows and constructional features. Throughout most of its length the axial valley of the Cleft Segment is a 2- to 3-km-wide linear feature enclosed by valley walls of 80-120 m relief. South of 44°42′N the floor of the axial valley has a smooth-textured surface of high acoustical reflectivity that is split by a remarkably continuous central cleft. The cleft is presumably the source of the voluminous and evidently fluid volcanic flows that presently cover the unsedimented valley floor [Kappel and Ryan, 1986]. From 44°42′N to 44°49′N the valley floor becomes a disrupted surface broken by faults and volcanic constructions. The largest volcanic cone is 60 m in height, though most have only 20 to 40 m of relief. North of 44°50′N the central volcanic cones give way to a nearly continuous steep-sided depression. The eastern wall correspondingly fades into a linear depression. The disappearance of the eastern wall is accompanied by a distinct eastward bulge in the depth contours on the flank of the ridge crest.
Figure 1. Bathymetry of the Cleft and Vance segments on the Juan de Fuca Ridge. Tracks of the CTD tows used to define megaplume 1 (at ~44°50′N) and megaplume 2 (at ~45°15′N) are also shown.
Two primary centers of hydrothermal activity are present on the Cleft Segment. The most studied area, a chain of vent fields distributed along a 5-km section centered on the axial high at ~44°40′N, was discovered in 1981 [Normark et al., 1983] and sampled by a submersible Alvin in 1984 [U.S. Geological Survey Juan de Fuca Study Group, 1986] and 1987 [Embley et al., 1988]. Since 1981, annual surface ship sampling and CTD/transmissometer tows [Massoth et al., 1982, 1983; Baker et al., 1985; Baker and Massoth, 1986a, 1987] have demonstrated an apparently continuous emission of hydrothermal fluids from this vent field. A much more extensive hydrothermal plume was discovered in 1986 [Baker and Massoth, 1986b; Baker et al., 1987] at the northern end of the Cleft Segment. The first megaplume was found above this vent field [Baker et al., 1987].
The term megaplume was coined by Baker et al. [1987] to describe a radially symmetric, 20-km-diameter plume apparently formed by a cataclysmic release of hydrothermal fluids from the axial valley of the Cleft Segment in August 1986 (Figure 2). A hydrothermal origin for this first megaplume was inferred from substantial anomalies of 3He δ3He = 117%, where δ3He = 100(R/Rair − 1); R = 3He/4He) [Lupton et al., 1989], dissolved Mn (115 nmol/kg), particulate Fe (1.16 μmol/kg), excess dissolved silica (12 μmol/kg), and temperature (0.28°C relative to ambient water of the same potential density) in the core of the plume. A cataclysmic origin (i.e., an extraordinarily large and rapid discharge) was inferred from the size and shape of the plume and the size of composition of hydrothermal minerals suspended in the plume. The megaplume was symmetric about its horizontal and vertical axes (Figures 2 and 3), implying that the plume had formed too rapidly to be elongated by local currents. Furthermore, during the 5-day sampling period the plume size and internal temperature and light attenuation structure remained unchanged, indicating that plume growth had ceased by the time of our discovery.
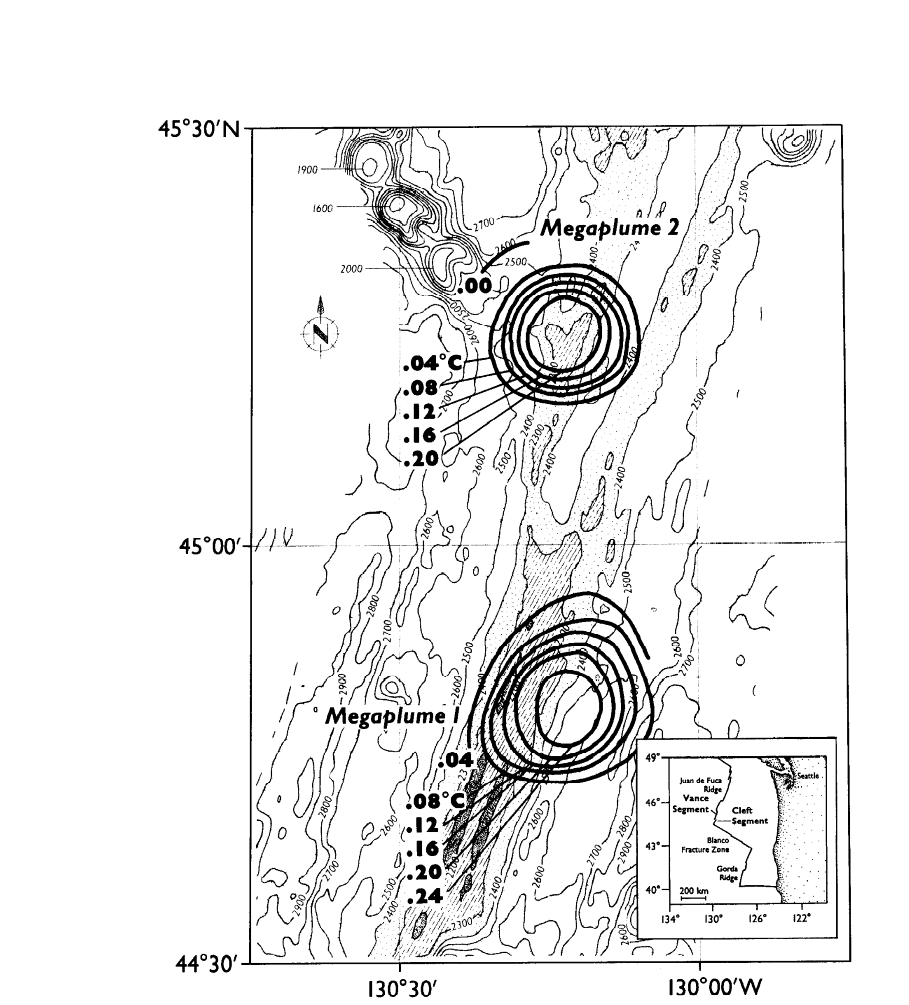
Figure 2. Plan view of megaplume 1 and 2 temperature anomaly (°C) contours on the 27.61σθ (~1600 m) surface. Megaplume 2 was centered about 45 km north of the original position of megaplume 1. Both plumes were radially symmetric about their vertical axis.
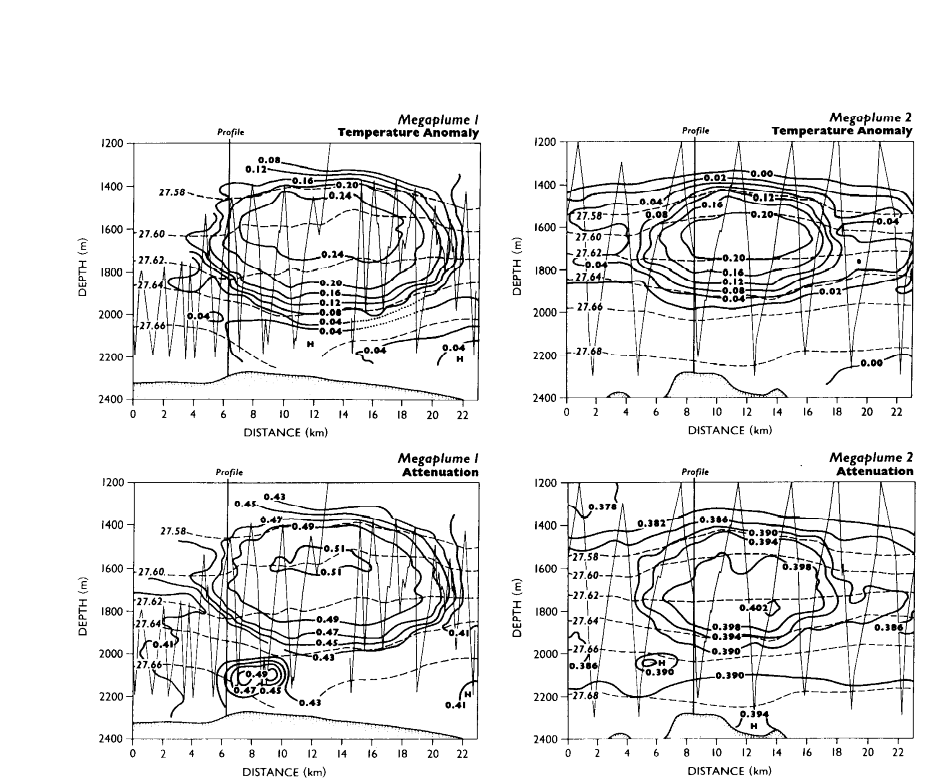
Figure 3. Cross sections of temperature anomaly (°C) and light attenuation (m−1) for megaplumes 1 and 2. Note that the vertical distribution of heat and particles was identical in megaplume 1 but that the particle concentration maximum was displaced downward by ~100 m in megaplume 2. Dotted lines show σθ surfaces, and sawtooth curves trace the CTD towpath. The vertical line labeled "profile" in the cross sections marks the location of the chemical profiles in Figure 5.
The unique population of hydrothermal minerals in the plume, however, required that the plume had been formed only days before we sampled it. Hydrothermal Fe oxyhydroxides, anhydrite, chalcopyrite, and amorphous silica were common in the plume. At both the center and outside edge of the plume anhydrite crystals as large as 150 μm in length were common (Figure 4). Particles of this size and shape settle at ~0.2 cm/s (170 m/d) in still water [Lerman et al., 1974], although turbulence in the plume might reduce the net speed. The presence of such large hydrothermal crystals implies a plume age of a few weeks or less, while the observation that anhydrite crystals at the edge of the plume were consistently in a more advanced state of dissolution than those at the center (Figures 4a and 4b) means that the radial expansion of the plume was not instantaneous. We deduce from these various constraints that megaplume 1 formed over no less than a few days but no longer than 2 or 3 weeks.
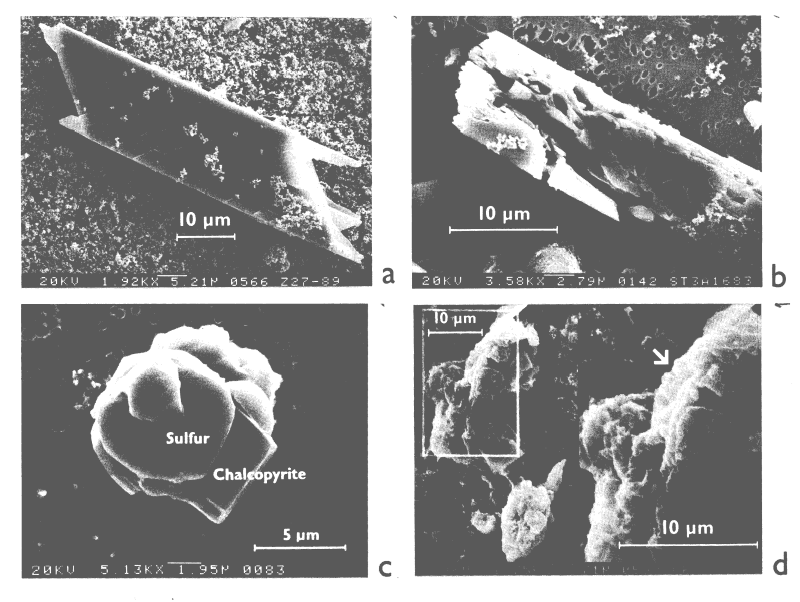
Figure 4. (Opposite) Scanning electron micrographs of hydrothermal minerals: (a) fresh anhydrite from the center of megaplume 1, (b) slightly degraded anhydrite from the edge of megaplume 1, (c) elemental sulfur and chalcopyrite from the center of megaplume 1, and (d) highly degraded anhydrite (overlain by other types of particles) from the center of megaplume 2. The anhydrite particles were identified by their distinctive morphology and by X ray spectra dominated by Ca and S. The arrow in Figure 4d points to the edge of the anhydrite grain.
In light of this extraordinary discovery, we gave careful attention to the detection of megaplume-type features during field work along the JDFR axis in September 1987, 13 months after the detection of megaplume 1. That attention was rewarded by the discovery of a second megaplume about 45 km north of the original megaplume location. We initially encountered megaplume 2 on September 12 during the beginning of a long CTD tow down the entire length of the Vance Segment (Figure 1). Four additional tows between September 19 and 23 (Table 1) documented its hydrographic similarity to megaplume 1 and recovered numerous water samples for chemical and mineralogic analyses.
Both megaplume 1 and megaplume 2 were centered at ~1600 m (Figure 3), but megaplume 2 had a thickness and diameter about 30% less than megaplume 1 (relative to the 0.08°C ΔT contour). The volume was ~1011 m3 inside the 0.04°C ΔT contour, or about 50% of the megaplume 1 volume. Several hydrographic sections across megaplume 2 confirmed that it was lens shaped, thus implying that it was created by a short-duration venting episode as was megaplume 1. The ΔT at the core of megaplume 2 was 0.23°C and the total excess heat
![]() (1)
(1)
where ρ is density, Cp is specific heat, and  t and Vi are the mean temperature anomaly and the volume
between each ΔT contour (Figure 3), respectively, was 3.2 × 10¹⁶ J, or again about 50% of the excess
contained in megaplume 1.
t and Vi are the mean temperature anomaly and the volume
between each ΔT contour (Figure 3), respectively, was 3.2 × 10¹⁶ J, or again about 50% of the excess
contained in megaplume 1.
Both the character of the particle population and the vertical distribution of heat and particles were different in the two megaplumes. Unlike the abundant distribution of large and often uncorroded hydrothermal minerals found in megaplume 1 (Figures 4a, 4b, and 4c), only a few small and highly altered hydrothermal crystalline minerals such as barite and anhydrite were present in samples from megaplume 2 (Figure 4d). The particle mass concentration, measured by suspended matter samples and light attenuation profiles, in megaplume 2 was reduced by a factor of 4 relative to megaplume 1, presumably by the settling of particles with high fall velocities and the aggregation of very slowly settling particles. The influence of settling on the particle distribution is demonstrated by the fact that the particle maximum is ~100 m deeper than the depth of the ΔT maximum for megaplume 2 (Figure 3).
Vertical profiles of conservative and quasi-conservative hydrothermal constituents through megaplume 2 show a basic similarity to analogous megaplume 1 data. The concentrations of 3He and dissolved Mn closely follow the temperature profile (Figure 5a). The concentration profile of dissolved hydrothermal silica was calculated by subtracting from the observed profile a silica profile from near-axis stations outside the megaplumes. This profile of excess silica also matches the profile of temperature, 3He, and Mn (Figure 5a).
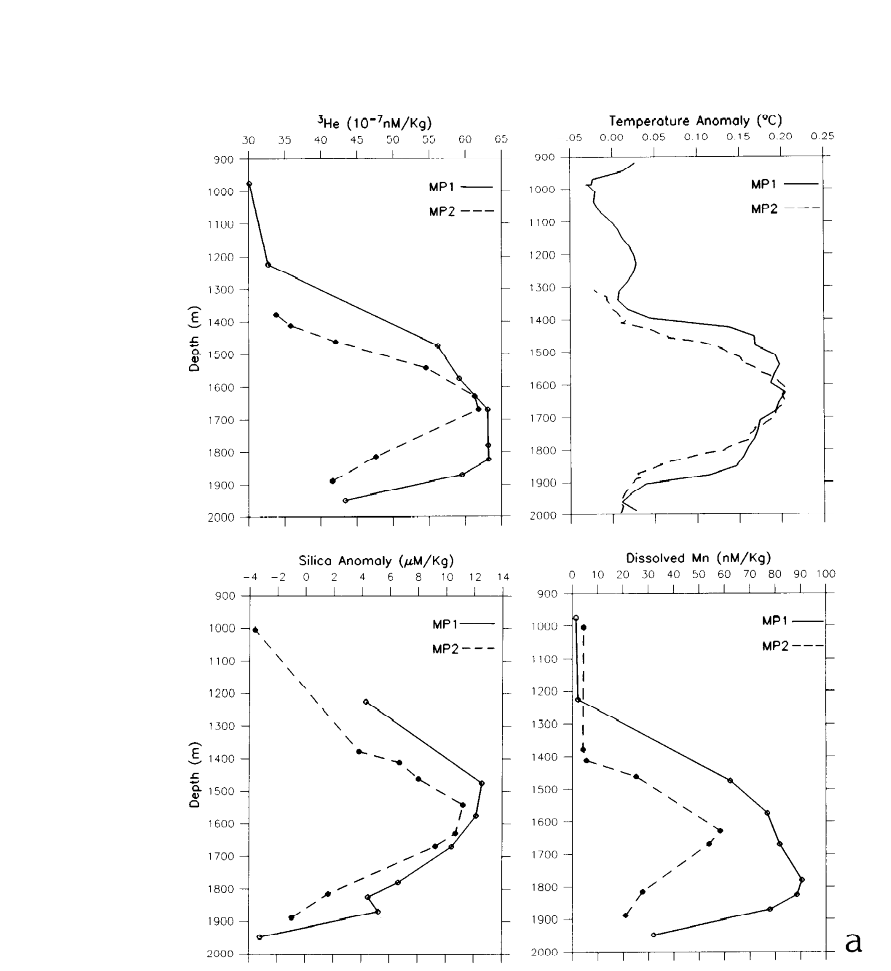
Figure 5. Vertical profiles of (a) dissolved and (b) particulate hydrothermal constituents of megaplumes 1 and 2. The megaplume 1 profile was taken on the plume edge, whereas the megaplume 2 profile was taken near the center (see Figure 3), so profiles of conservative constituents are similar even though megaplume 1 was actually more concentrated than megaplume 2.
Particulate species exhibit various types of profiles (Figure 5b), presumably as a function of the mean settling velocity of the dominant particle type with which each element is associated. Fe closely follows the trend of the dissolved components, because most of the Fe is in submicrometer-sized amorphous oxyhydroxide precipitates [Walker and Baker, 1988]. Such precipitates composed ~40% by weight of megaplume 1 solids [Baker et al., 1987]. Their very low settling velocity (<<1 × 10⁻⁵ cm/s as calculated by the Stokes equation) means their removal is principally by biological or physical aggregation rather than settling. The hydrothermal Fe precipitates may thus be considered quasi-conservative in the sense that their relative concentration profile is stable for many months.
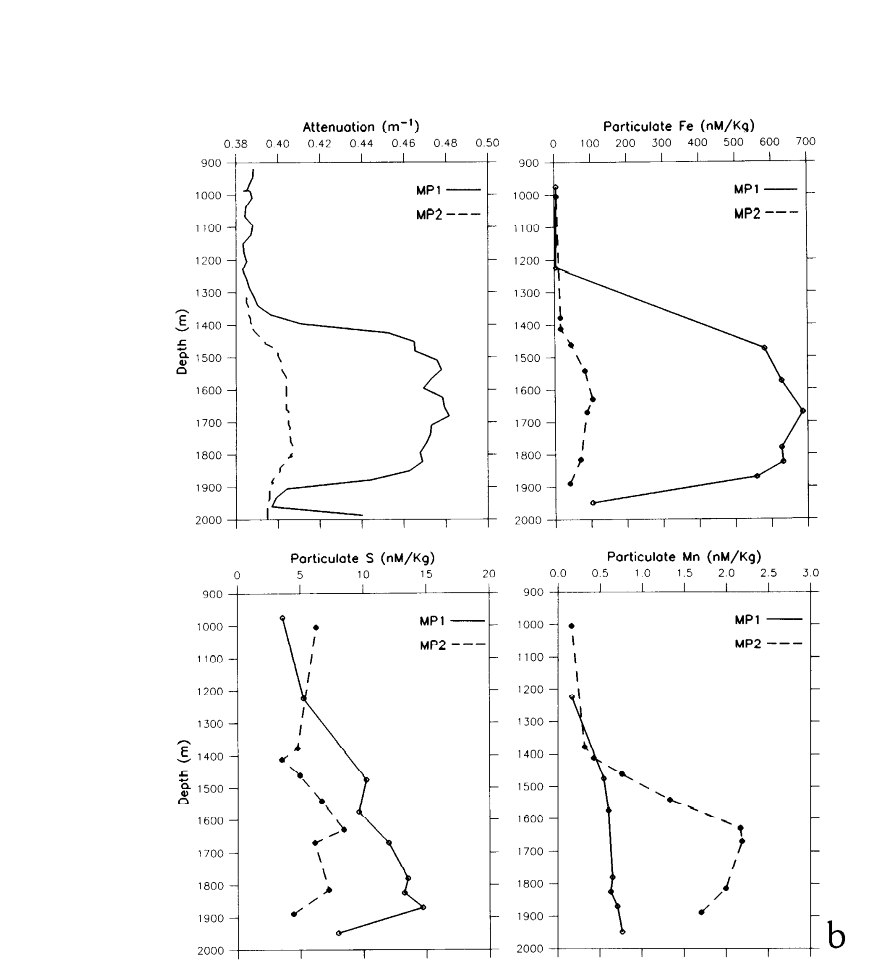
Figure 5. (continued)
Concentrations of particulate S in megaplume 2 are also lower than in megaplume 1 (Figure 5b). S occurs principally in coarse-grained hydrothermal precipitates such as anhydrite, chalcopyrite, pyrite, and barite that settle rapidly and are quickly lost from the plume [Baker and Massoth, 1987; Feely et al., 1987]. Even the vertical distribution of S in megaplume 1 shows clear evidence of settling of the particulate S phase.
The vertical distribution of particulate Mn in megaplume 2 is unique among these profiles in having a substantially higher concentration than was found in megaplume 1 (Figure 5b). About 7% of the present Mn inventory of the plume (plus an unknown fraction that has presumably been lost to settling) is particulate, compared to 1% in megaplume 1. The fraction of Mn in the particulate phase was smaller in both megaplumes than that reported for plumes at 19°S on the East Pacific Rise (EPR) [Klinkhammer and Hudson, 1986] and on the Mid-Atlantic Ridge [Klinkhammer et al., 1985].
The linear relationships between 3He and other conservative and quasi-conservative constituents in both megaplumes are similar to those characteristic of high-temperature vent fluids from a variety of locations (Figure 6). The excess heat/3He ratio from both plumes is ~3 × 10¹⁷ J/mol 3He (3.2 × 10¹² cal/cm3 STP), although the scatter of the data is greater in megaplume 1. This ratio is higher than vent fluids sampled at 21°N and 13°N on the EPR and at 44°40′N on the JDFR, but well below those from the Guaymas Basin (Figure 6a).
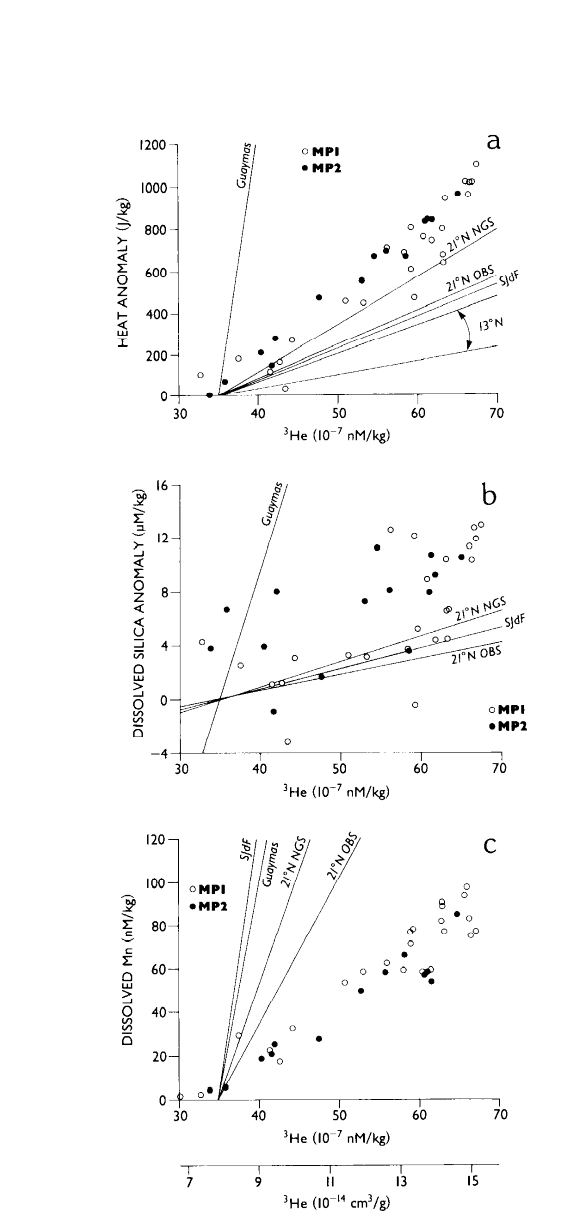
Figure 6. Scatter plots of 3He concentration versus (a) enthalpy anomaly, (b) dissolved silica anomaly, and (c) dissolved Mn in megaplume 1 and megaplume 2. Plotted for comparison are corresponding slopes (forced through a point representing ambient seawater) from high-temperature fluids sampled on the East Pacific Ridge, Guaymas Basin, and the southern Juan de Fuca Ridge at 44°40′N. The following data are given: 3He and heat data from 21°N [Welhan and Craig, 1983], 13°N [Merlivat et al., 1987], Guaymas [Lupton, 1983], and southern JDFR [Kennedy, 1985]; silica from 21°N [Von Damm et al., 1985a], Guaymas [Von Damm et al., 1985b], and southern JDFR [Von Damm and Bischoff, 1987]; Mn at 21°N [Von Damm et al., 1985a, 1983], Guaymas [Von Damm et al., 1985b], and southern JDFR [Von Damm and Bischoff, 1987].
The trend of the excess silica/3He relationship is ~2 × 10⁹ mol/mol for the megaplumes and is an analog of the excess heat/3He relationship insofar as it is higher than the vent fluid regressions from the EPR and the JDFR but lower than the regression from the Guaymas Basin fluids (Figure 6b). The excess silica curve is less precise than either the heat or Mn curves because of the relatively low enrichment of silica in hydrothermal fluids and the consequent difficulty in determining the true nonhydrothermal level of silica in the water column. Our estimate of hydrothermal silica is a maximum value because we have not accounted for the addition of silica into the megaplume by entrainment of deep, silica-rich water. The existence of a direct relationship between silica and 3He is nevertheless unequivocal.
The trend of the dissolved Mn (>93–99% of total Mn)/3He relationship is ~2.3 × 10⁷ mol/mol, a factor of ~3–10 less than sampled vent fluids (Figure 6c). This difference is not unexpected because sampling at the 44°40′N vent site on the JDFR [Baker and Massoth, 1986a] and at 21°N on the EPR [Lupton et al., 1980] has shown that Mn concentrations relative to heat or 3He are lower in the neutrally buoyant plume than in the sampled vent fluids. The cause of this difference remains uncertain. In fact, the megaplume Mn/3He trend is intermediate between that of plumes from 44°40′N and the 21°N plumes.
A central question is whether megaplume 2 was a separate event or merely a reobservation of megaplume 1. While there is circumstantial evidence for both views, our judgment is that the weight of evidence favors the case for separate megaplumes. Arguments for individual events are based on calculations of the expected horizontal advection velocity of the plume, on the size and mineralogy of individual particles in megaplume 2, and on measurements of the microbial binding rate of Mn in hydrothermal plumes.
Current meter records over and adjacent to the Cleft Segment [Cannon and Pashinski, 1987, also unpublished manuscript, 1989] indicate that net velocities over periods of 11 to 13 months and at depths between 1000 and 2000 m are typically 1–2 cm/s. Progressive vector diagrams of four such records (Figure 7) imply annual displacements of 200 to 600 km, a factor of 5 to 15 greater than the observed separation between megaplumes 1 and 2 (Figure 3). While the calculation of actual Lagrangian displacements of water parcels originating at the mooring sites would require a dense regional network of moorings, the large displacements inferred from these single moorings suggest that a megaplume is unlikely to be found near its origin on the ridge crest after a year's time. We also note that the magnitude of these displacements matches that found for a recently tracked "Meddy" centered at 1000 m in the eastern Atlantic [Armi et al., 1988].
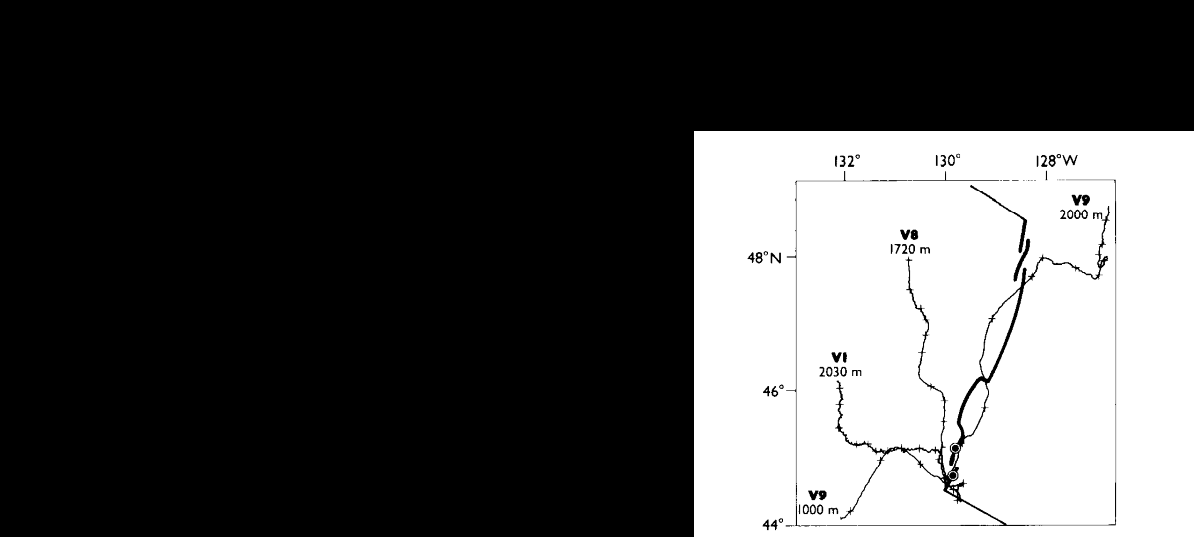
Figure 7. Progressive vector diagrams from current meters deployed near the megaplume 1 site. The paths represent the cumulative displacement inferred from the net velocity of water past each mooring. The Juan de Fuca Ridge axis is shown for scale. Mooring V1 was recorded from May 25, 1984, to June 17, 1985; V8, from June 9, 1985, to April 13, 1986; and V9, from August 16, 1986, to July 27, 1987. Crosses represent 30-day intervals along each path. Circles on the ridge crest show the locations of megaplumes 1 and 2.
We can also document a minimum displacement velocity for megaplume 1 of ~0.2 km/d from the fact that CTD taken at the location of the plume center 55 days after its initial discovery showed no trace of the plume, indicating that the plume moved a distance of at least 1 radius (~10 km) in that time.
Mineralogical samples available from megaplume 2 provide additional evidence for a plume age of less than 13 months. The anhydrite particle shown in Figure 4d appears to be part of an aggregate with an estimated settling rate of ~0.01 cm/s (9 m/d), fast enough to have settled out of the plume in much less than a year unless substantial vertical currents persist in the plume throughout its life. Furthermore, the laboratory and field experiments of Feely et al. [1987] show that anhydrite dissolves rapidly in seawater, so large crystals are unlikely to have survived for 13 months.
Finally, Cowen et al. [1988] estimated the age of both megaplume by calculating the removal rate of dissolved Mn onto particles as determined by in situ measured microbial Mn binding rates. Estimated ages were 1–3 days for megaplume 1 and about a month for megaplume 2 (assuming that the original concentration of dissolved Mn in megaplume 2 was the same as in megaplume 1).
The principal argument against separate events is the similarity of the ratios of excess heat, excess dissolved silica, and dissolved Mn to 3He in both plumes (Figure 6). If a similar process created both plumes, however, a compositional similarity would not be unexpected. Campbell et al. [1988] and Bowers et al. [1988] observed that the composition of fluids discharging from individual vent fields on the EPR was uniform over a several-year sampling interval. They argued that this constancy was maintained through buffering of the hydrothermal fluids by the host rock; if both megaplumes originated from same or petrographically similar reservoirs, they should be chemically similar.
While the evidence does not conclusively prove that megaplumes 1 and 2 were separate events, it is suggestive of it and consistent with the hypothesis that megaplume 2 formed in the vicinity of the megaplume 1 location and underwent net northward advection at ~1 cm/s for a few months before its discovery in September 1987. Although we assume separate events in the following discussions, none of the conclusions we reach are dependent upon that assumption.
Constraints on the characteristics of the hydrothermal release resulting in a megaplume can be derived from models of turbulent buoyancy-driven convective fluids [e.g., Morton et al., 1956; Turner, 1973]. Models of this kind have already been employed for hydrothermal plumes [Converse et al., 1984; Middleton and Thompson, 1986; Little et al., 1987]. Such models propose that upward convection of the hydrothermal plume is forced by the density deficiency of the hot hydrothermal fluid with respect to the surrounding water. The deficiency in density is diminished over distance from the source by entrainment of ambient water into the plume. Eventual complete quenching of the density deficiency in a stably stratified environment limits the height of rise of the plume. The observed height of rise can be used to infer the value of the heat flux at the vent. In the model presented below we specifically apply these concepts to the megaplume observations. The computations are based on an idealized plume source configuration and plume ascent, however, so the model results must be taken as suggestive rather than definitive.
The model assumes that the turbulent entrainment of ambient fluid is proportional to upward plume velocity, that profiles across the plume are similar at all heights (here top-hat profiles), and that the fluid is incompressible. Previous applications of such models to hydrothermal systems [Converse et al., 1984; Middleton and Thompson, 1986; Little et al., 1987] have addressed plumes arising from individual vents and have thus been confined to axisymmetric geometry, but for reasons to be indicated below, we choose to model a linear source and planar plume. Because of the near-radial symmetry of the observed plume cap, however, the source length must be small with respect to the diameter of the plume cap. End effects of a finite length source are not part of the model. On the basis of the development of Morton et al. [1956], the conservation equations for a two-dimensional plume are as follows: for mass,
 (2)
(2)
for momentum,
 (3)
(3)
for heat,
![]() (4)
(4)
and for salinity,
![]() (5)
(5)
where b is the plume width (e.g., the distance across the linear source
fissure), w is the upward velocity, z is the vertical coordinate (positive
upward),  is the entrainment coefficient, g is the
acceleration of gravity,
is the entrainment coefficient, g is the
acceleration of gravity,  is the density in the plume, S
and T are the salinity and temperature, respectively, Cp is the specific heat of salt water at constant
pressure, and Q is the heat content per unit volume of the plume. Qe, Te, Se, and ρe refer to
properties in the ambient environment, and ρ1 is the ambient density at the plume source. The
heat content per unit volume, Q, and the temperature are related by
is the density in the plume, S
and T are the salinity and temperature, respectively, Cp is the specific heat of salt water at constant
pressure, and Q is the heat content per unit volume of the plume. Qe, Te, Se, and ρe refer to
properties in the ambient environment, and ρ1 is the ambient density at the plume source. The
heat content per unit volume, Q, and the temperature are related by
![]() (6)
(6)
Notice that the model employs an equation conserving heat rather than temperature because Cp (as does ρ) depends nonlinearly on T at high temperature [e.g., Little et al., 1987].
Because of the assumption of incompressibility, potential temperatures and density referenced to the source depth (~2300 m) were used throughout. For T < 40°C and S < 42‰, densities at 230 bars were taken from the formula for density of seawater given by Gill [1982]; densities at T > 40°C were interpolated from tables given by Potter and Brown [1977] and Burnham et al. [1969]. The specific heat of seawater at 230 bars varies from 4100 J kg−1 °K−1 to 6600 J kg−1 °K−1 over the temperature range 200°C to 350°C [Bischoff and Rosenbauer, 1985]. Below 200°C, Cp = 4100 J kg−1 °K−1. Ambient potential temperature and salinity profiles, taken from CTD casts in ambient water just outside megaplume 1, were fit between depths of 1000 m and 2300 m with quadratic curves.
The temperature and salinity of the venting fluid were assumed to be similar to "normal" high-temperature hydrothermal fluids: 300°C < T < 400°C and S ~ 35‰. The presence of specific hydrothermal minerals such as anhydrite and chalcopyrite in megaplume 1 samples implies a temperature of at least 290°C for the vented fluid.
The model equations were consequently integrated using initial values of T0 = 350°C and S0 = 34.63‰, the ambient salinity at 2300 m, for a range of mass fluxes. In all calculations, the coefficient of entrainment of ambient water into the buoyant plume was given a value of α = 0.1 based on laboratory experiments. For example, for two-dimensional plumes a range for α of 0.055 to 0.11 has been suggested [Kostsovinos and List, 1977; Wright and Wallace, 1979], the lower value for a pure jet and the upper value for a pure plume. For axisymmetric plumes, α values of 0.09 to 0.11 have been employed [Turner, 1973; Middleton and Thompson, 1986].
The axisymmetric analogs of (equations (2)–(6)) were evaluated first. To fulfill the observed megaplume 1 rise of 1025 m, vent diameters of approximately 4 m (vent exit velocity of 5 m/s) to 9 m (exit velocity of 1 m/s) would be required. This result did not change when the initial temperature of the vented fluids was varied over the range 325°–375°C because the nearly counterbalanced dependencies of density and specific heat on temperature makes the initial heat flux virtually constant. We judged such a spatially restricted source of fluids to be unlikely and turned instead to a model in which the source was a linear one (equations (2)–(6)), a geometric analog to seafloor fissures.
Equations (2)–(6) were consequently integrated under varying conditions of vent width and fluid exit velocities. The calculated heights of rise were found to depend on the heat flux at the vent (Figure 8) just as in the case of buoyancy-conserving, linearly stratified regimes [Turner, 1973]. To force a plume to the observed megaplume 1 rise height of ~1025 m requires a source heat flux of approximately 3.5 × 10⁸ J/s per meter of vent fissure (Figure 8). The associated volume flux per unit length of the vent is 0.22 m3 m−1 s−1.
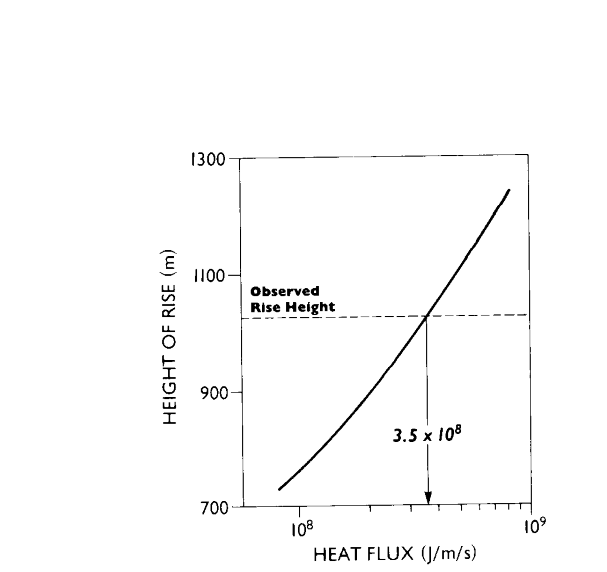
Figure 8. Relationship between plume rise height and the vent heat flux per meter of vent fissure for a linear plume with an entrainment coefficient of 0.1. The megaplume 1 rise height required a heat flux of ~3.5 × 10⁸ J m−1 s−1.
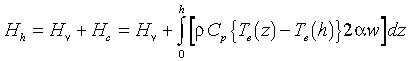
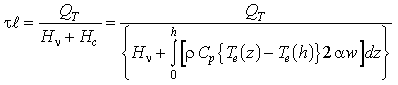
The total excess heat in the megaplume, Qt , is the product of the length of the line source, ℓ, the duration of venting, τ, and the excess heat flux per unit length of source, Hh , entering the plume at height h:
![]() (7)
(7)
where the reference temperature is the ambient temperature at height h. Given a field-measured value of Qt and a model-estimated value for Hh , (7) can be inverted to determine the product of source length and duration.
Because there are no heat sources within the plume, Hh must be the sum of Hv, the excess heat flux per unit length at the plume base (vent flux), and Hc , the excess heat flux per unit length entrained laterally into the plume stem over the vertical distance zero to h. (Note that Hc is a negative heat flux because of the cooling effect of the upward entrainment of deep water.) Since 2αwdz is the volume flux per unit length laterally entrained at any height z (equation (2)), this sum may be written as
 (8)
(8)
where Te(h) is the ambient potential temperature at height h. Equation (8) may also be derived by integrating (4) in z over the interval [0,h]. For high temperature vents, Hv is well approximated by the excess heat flux earlier estimated from plume rise height, the difference being that the ambient reference temperature in the two cases is taken at different locations (z = 0 and z = h).
The model constraint on τℓ thus takes the following form:
 (9)
(9)
For megaplume 1, Qt is estimated to be 6.7 × 10¹⁶ J, and Hv is estimated to be 3.5 × 10⁸ J m−1 s−1 as described earlier. The value of the integral in the denominator of (9) depends on the value given to h. If h = 700 m, then Hc = −1.6 × 10⁸ J m−1 s−1. The resulting source strength τℓ is approximately 4000 m d. If h = 600 m, then τℓ = 3100 m d (Hc = −1.0 × 10⁸ J m−1 s−1), and if h = 800 m, then τℓ = 6400 m d (Hc = −2.3 × 10⁸ J m−1 s−1). The value for h of 700 m is our preferred choice because it represents the height above bottom of the vertical center of the plume (Figure 3).
Using a value of 4000 m d for ℓτ, the total volume and heat released during the megaplume 1 event were 7.6 × 10⁷ m3 and 1.2 × 10¹⁷ J, respectively. (Both of these figures are about twice the preliminary estimates of Baker et al. [1987].) The comparative source strength for a megaplume 2-sized event is 1900 m d with a total volume and heat content of 3.6 × 10⁷ m3 and 5.8 × 10¹⁶ J, respectively. From considerations of the megaplume 1 geometry and suspended particle population presented earlier, reasonable bounds on the duration of the causative venting event are 2–20 days. Consequently, from (9) with h = 700 m, the length of a venting fissure would be 2000–200 m.
Profiles of properties in the plume over the interval 1–1000 m from the source are shown in Figure 9 for the case of megaplumelike venting with an exit velocity of 2.5 m/s. The plume width remains relatively narrow for the first several hundred meters. Beyond that it rapidly enlarges. This is consistent with the observations that show the plume cap to begin several hundred meters from the seafloor. On the basis of laboratory studies of linear plumes in stratified environments, the thickness of the plume cap ought to be about one half the maximum height of the plume [Wallace and Wright, 1984]. In the case of these observations that would mean a plume cap thickness of ~500 m, not unlike the observations of ~700 m.
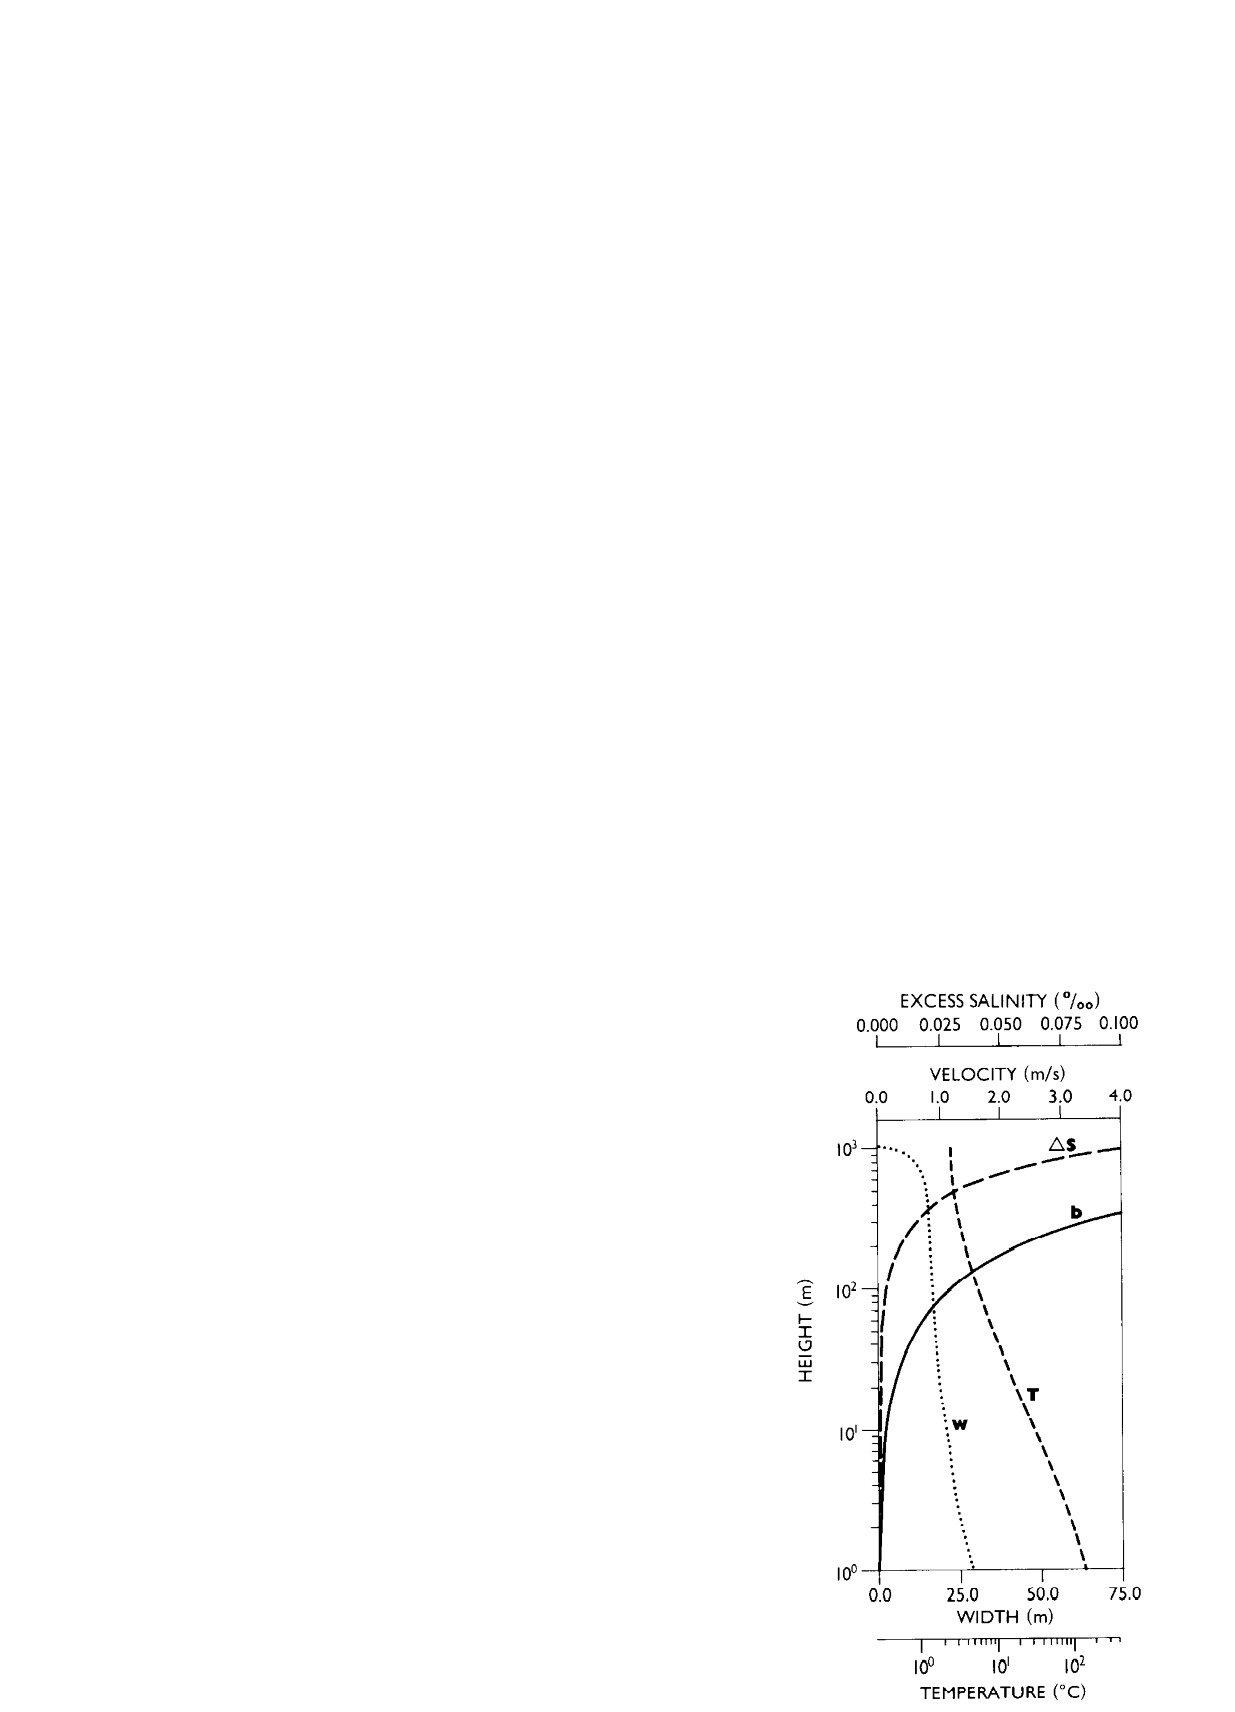
Figure 9. Vertical profiles of temperature (T), excess salinity (ΔS), plume width (b), and vertical velocity (w) for a linear plume with an exit velocity of 2.5 m/s.
Upward velocity in the plume (Figure 9) remains greater than 0.8 m/s to 700 m above bottom, after which it rapidly declines toward zero. A rough estimate of the rise time to maximum height is thus 20–30 min. These calculated velocities indicate that the plume would have no difficulty in lifting even the largest grains we observed in the filtered samples because their settling velocities are ~2 × 10⁻³ m/s. Temperature in the plume (Figure 9) falls off rapidly with height, decreasing to ~30°C at 10 m and ~6°C at 100 m. Excess salinity rises to ~0.1‰ near the top of the plume, reflecting the transport of salt in the plume from the more saline water at depth.
The process (or processes) that creates megaplumes is as yet unknown. Any proposed model must account for an extraordinarily high flux of both mass and heat in the form of a fluid compositionally similar to that from normal hydrothermal vents. A precise measure of the megaplume fluxes depends on the duration of venting. Using the bounds of 2–20 days cited above, the mass and heat fluxes necessary to form megaplume 1 would have ranged from 30–3 × 10⁷ g/s (at 350°C) and 70–7 × 10¹⁰ W, respectively. The midpoints of these ranges are about a factor of 103 greater than the flux of all the hot springs at the 21°N vent field as estimated from vent orifice flow measurements [Converse et al., 1984], about a factor of 102 greater than the heat flux from the large vent field on the Endeavour Segment of the JDFR as calculated from temperature anomalies and fluid velocities [Baker and Massoth, 1987] and from radiochemical inventories [Rosenberg et al., 1988] in the neutrally buoyant plume, and about a factor of 10 greater than the hydrothermal volume flux from the entire Guaymas Basin as calculated by a silica box model [Campbell and Gieskes, 1984].
Two general types of processes suggest themselves: the creation of superheated fluid by the extrusion of molten basalt onto the seafloor or the sudden emptying of a reservoir of hydrothermal fluids in the axial crust [Baker et al., 1987; Cann and Strens, 1987]. Given a volume specific heat of 3.8 J cm−3 °K−1 and a latent heat of fusion of 103 J/cm3, a seafloor extrusion of ~2.5 × 10⁷ m3 of 1100°C basalt would yield the heat contained in megaplume 1. While a lava flow that was thin enough, of the order of 10 m or less, could cool within a few days, it is unlikely that it could produce either the observed plume height or chemistry. If one assumes that the total heat flux from the lava flow was distributed to many fissures over the lava flow, the heat flux per unit length of source would be much less than that calculated above for the single fissure model of the megaplume. Assuming the resulting individual line plumes do not influence each other until much of their buoyancy is depleted, the rise height of these many plumes from the lava flow would be much less than the rise height observed. By the same token, the interaction of seawater with an extensive high-temperature lava flow would likely produce a very open system, unlike laboratory batch experiments, where leaching the basalt would be minimized because water would be driven away from the rock almost immediately upon coming in contact with it (K. Von Damm and M. Mottl, personal communication, 1989). This notion is consistent with the usual field characterization of recently extruded basalt as fresh and unaltered.
Although we think it likely that an event of this magnitude might be accompanied by a lava extrusion, the high discharge rate and well-developed hydrothermal chemical signature suggest that the observed megaplumes arose from the cataclysmic emptying of a reservoir of hydrothermal fluids in the axial crust. The volume of a high-temperature reaction zone in the Troodos ophiolite complex can reach ~1 km3 [Richardson et al., 1987], which could contain enough high-temperature fluid to form a megaplume if the porosity were high enough (~10%). In order to increase the mass flux from such a reaction zone by a factor of 102 to 103 the local crust must suffer a drastic increase in permeability. A permeability increase could occur passively, by tectonic fracturing unrelated to changes in the crustal fluid, or actively, by fracturing caused by an increase in the fluid volume or buoyancy pressure.
Tectonic fracturing, presumably caused by episodic rifting events, could increase the mass flux by coalescing fracture zones and creating new flow channels along irregularities on fault surfaces. Rapid heating of the country rock by a simultaneous dike intrusion might also accelerate local hydrothermal circulation. Sibson et al. [1975], for example, note that hydrothermal mineralization on terrestrial fault surfaces is usually episodic, with fluid pulses contemporaneous with fault motion, and that postseismic groundwater effusions of up to 107 m3 have been observed after large earthquakes. No earthquakes greater than magnitude 4, the approximate sensitivity limit of the land-based recording network, were associated with megaplume 1.
An alternate possibility is that the hydraulic force of the hydrothermal fluid itself occasionally exceeds the lithospheric strength and creates a temporary fracture permeability. Sibson [1981] has presented a model of this type that addresses periodic fault slippage. J.R. Cann and M.R. Strens (Modeling periodic megaplume emissions by black smoker systems, submitted to Journal of Geophysical Research, 1988) have adapted this concept specifically to a black smoker system. In their model, steadily elevating fluid temperatures increase the buoyancy pressure in the upflow zone until the strength of a low-permeability caprock is exceeded and the system catastrophically empties. The subsequent infusion of cold seawater into the reaction zone enhances sulfide precipitation, which reduces permeability and reestablishes normal black smoker flow. Hydraulic fracturing might also occur by phase separation of the hydrothermal fluid caused by a sudden decompression [Kelly and Delaney, 1987; Goldfarb and Delaney, 1988; Hulen and Nelson, 1988].
Fossil evidence of high fluid flow caused by rock fracturing and subsequent pressure release comes from the hydrothermal brecciation found in terrestrial hydrothermal fields [Hulen and Nelson, 1988], in ophiolite stockworks [Lydon and Galley, 1986], and in rock samples from the Mid-Atlantic Ridge [Delaney et al., 1987] and the Blanco Fracture Zone in the northeast Pacific [Hart et al., 1986]. Textural and chemical characteristics of hydrothermal breccias are compatible with megaplumelike events: flow channels wide enough to allow the movement of clasts up to tens of centimeters in diameter, a fluid flow rate high enough to transport large clasts, and episodic occurrences within the same hydrothermal system. The prevalence of hydrothermal breccias in the geologic record implies that cataclysmic fluid releases are not uncommon along the mid-ocean ridge system.
The occurrence of megaplumes on a ridge segment may be associated with other anomalies in the discharge rate of hydrothermal heat. Detailed plume observations on the Cleft Segment during the last few years are consistent with this idea. Over at least the last 2 years (assuming megaplume 2 originated on the Cleft Segment) episodic venting has released heat at an annual rate of ~2–4 × 10⁹ W. Continuous venting is focused at two sites centered near 44°40′N and 44°54′N. From measurements of plume size, temperature anomaly, and advective transport, Baker and Massoth [1987] estimated the present-day heat flux from the vent field at 44°40′N to be 6 ± 3 × 10⁸ W. The plume at the northern end of the Cleft Segment [Baker and Massoth, 1986b] is even larger and more intense, and although its flux has not yet been determined, its size and temperature anomaly appear at least comparable to those of the plume evolved from the Endeavour Segment of the JDFR. The heat flux from that vent field is 1–5 × 10⁹ W [Baker and Massoth, 1987; Rosenberg et al., 1988]. Thus a conservative estimate of the rate of heat loss by means of continuous hydrothermal discharge on the Cleft Segment is 2–6 ×10⁹ W, plus any diffuse convective heat not accounted for by the plume measurements. The observed hydrothermal heat flux from episodic and continuous venting within the axial valley of the Cleft Segment is therefore at least 4–10 × 109 W.
This measured flux is considerably greater than various theoretical estimates of the available axial heat from the 55-km-long Cleft Segment. For example, at steady state, the latent heat of fusion from a column of dikes and gabbro 5 km thick (roughly the thickness of the brittle layer for a 3-cm/yr half-spreading rate ridge) plus the specific heat of cooling from 1 km of intruded dikes gives a flux of 1 × 10⁹ W along the Cleft Segment. Axial-specific estimates are lower still. The hydrothermal flux within 3 km of the axis, calculated from the heat flow anomaly expression of Wolery and Sleep [1976], is 4 × 10⁸ W. The thermal model of Morton and Sleep [1985], based on the conductive and convective cooling necessary to account for the depth of the axial magma chamber inferred from seismic reflection surveys, yields a flux of 5 × 10⁸ W for hydrothermal heat sinks within 3 km of the ridge axis.
We suggest that the present imbalance between the observed and modeled heat flux on the Cleft Segment is a consequence of the fact that the hydrothermal release of heat and mass is in general an unsteady process. Is there an interpretable connection between hydrothermal episodicity and changes in the local magmatic budget? Lichtman and Eissen [1983] suggest that volcanism and hydrothermal activity along a ridge crest occur in evolutionary cycles controlled by random cycles of magma replenishment. They characterize the Cleft Segment as currently in the initial stage of a new high-effusion phase caused by a renewed magmatic pulse. Similarly, a morphological analysis of the JDFR by Kappel and Ryan [1986] led them to propose that ridge crest topography is not steady state but evolutionary, and that the Cleft Segment is currently in a phase of renewed volcanism, extending itself northward by a series of linear, rift-parallel belts of fissure eruptions. The high rate of hydrothermal discharge, and in particular the episodic megaplume events, might therefore reflect a recent surge in the local cycle of magmatic episodicity.
Acknowledgments. This research was supported by the National Oceanic and Atmospheric Administration (NOAA) Vents Program. We thank Terri Geiselman for conducting the scanning electron micrograph analyses of the particles, Geoff Lebon for XRF support, Maria J. Restrepo for performing the silica analyses, Kevin Roe for dissolved Mn determinations, and Karen Thornberry for 3He analyses. J.R. Cann provided helpful comments on the manuscript. J.E.L. was supported by the Ocean Sciences Division of NSF. Contribution 1050 from NOAA/Pacific Marine Environmental Laboratory.
Armi, L., D. Herbert, N. Oakey, J. Price, P.L. Richardson, T. Rossby, and B. Ruddick, The history and decay of a Mediterranean salt lens, Nature, 333, 649–651, 1988.
Baker, E.T., and G.J. Massoth, Hydrothermal plume measurements: A regional perspective, Science, 234, 980–982, 1986a.
Baker, E.T., and G.J. Massoth, The along-strike distribution of hydrothermal activity on a spreading segment of the Juan de Fuca Ridge (abstract), Eos Trans. AGU, 67, 1027, 1986b.
Baker E.T., and G.J. Massoth, Characteristics of hydrothermal plumes from two vent fields on the Juan de Fuca Ridge, northeast Pacific Ocean, Earth Planet. Sci. Lett., 85, 59–73, 1987.
Baker, E.T., J.W. Lavelle, and G.J. Massoth, Hydrothermal particle plumes over the southern Juan de Fuca Ridge, Nature, 316, 342–344, 1985.
Baker, E.T., G.J. Massoth, and R.A. Feely, Cataclysmic hydrothermal venting on the Juan de Fuca Ridge, Nature, 329, 149–151, 1987.
Bischoff, J.L., and R.J. Rosenbauer, An empirical equation of state for hydrothermal seawater (3.2 percent NaCl), Am. J. Sci., 285, 725–763, 1985.
Bowers, T.S., A.C. Campbell, C.I. Measures, A.J. Spivack, M. Khadem, and J.M. Edmond, Chemical controls on the composition of vent fluids at 13°–11°N and 21°N, East Pacific Rise, J. Geophys. Res., 93, 4522–4536, 1988.
Burnham, C.W., J.R. Holloway, and N.F. Davis, Thermodynamic properties of water to 1000°C and 10,000 bars, 96 pp., Spec. Pap. Geol. Soc. Am., 132, 1969.
Campbell, A.C., and J.M. Gieskes, Water column anomalies associated with hydrothermal activity in the Guaymas Basin, Gulf of California, Earth Planet. Sci. Lett., 68, 57°72, 1984.
Campbell, A.C., T.S. Bowers, C.I. Measures, K.K. Falkner, M. Khadem, and E.M. Edmond, A time series of vent fluid composition from 21°N, East Pacific Rise (1979, 1981, 1985) and the Guaymas Basin, Gulf of California (1982, 1985), J. Geophys. Res., 93, 4537–4550, 1988.
Cann, J.R., and M.R. Strens, Venting events in hot water, Nature, 329, 104, 1987.
Cannon, G.A., and D.J. Pashinski, Middepth flow near a venting site on the Juan de Fuca Ridge (abstract), Eos Trans. AGU, 68, 1306, 1987.
Converse, D.R., H.D. Holland, and J.M. Edmond, Flow rates in the axial hot springs of the East Pacific Rise (21°N): Implications for the heat budget and the formation of massive sulfide deposits, Earth Planet. Sci. Lett., 69, 159–175, 1984.
Cowen, J.P., G.J. Massoth, E.T. Baker, and R.A. Feely, Dating of two megaplumes: Microbial manganese binding in a hydrothermal plume (abstract), Eos Trans. AGU, 69, 1094, 1988.
Delaney, J.R., D.W. Mogk, and M.J. Mottl, Quartz-cemented breccias from the Mid-Atlantic Ridge: Samples of a high-salinity hydrothermal upflow zone, J. Geophys. Res., 92, 9175–9192, 1987.
Embley, R.W., S. Hammond, K. Murphy, C. Fox, B. Appelgate, G. Massoth, R.A. Feely, E. Baker, J. Gendron, G. Lebon, D. Butterfield, B. Coughlin, J. Lupton, I. Jonasson, M. Perfit, J. Cowen, V. Tunnicliffe, and A. Trivett, Submersible observations of the "megaplume" area: Southern Juan de Fuca Ridge (abstract), Eos Trans. AGU, 69, 1497, 1988.
Feely, R.A., M. Lewison, G.J. Massoth, G. Robert-Baldo, J.W. Lavelle, R.H. Byrne, K.L. Von Damm, and H.C. Curl, Jr., Composition and dissolution of black smoker particulates from active vents on the Juan de Fuca Ridge, J. Geophys. Res., 92, 11,327–11,363, 1987.
Gill, A.E., Atmosphere-Ocean Dynamics, 662 pp., Academic, San Diego, Calif. 1982.
Goldfarb, M.S., and J.R. Delaney, Response of two-phase fluids to fracture configurations within submarine hydrothermal systems, J. Geophys. Res., 93, 4584–4594, 1988.
Hart, R.S., D. Pyle, and M. De Wit, Siliceous breccias in marine hydrothermal systems: Evidence for rapid change of fluid chemistry (abstract), Eos Trans. AGU, 67, 1282, 1986.
Hulen, J.B., and D.L. Nelson, Hydrothermal brecciation in the Jemez Fault Zone, Valles Caldera, New Mexico: Results from Continental Scientific Drilling Program core hole VC-1, J. Geophys. Res., 93, 6077–6089, 1988.
Kappel, E.S., and W.B.F. Ryan, Volcanic episodicity and a non-steady state rift valley along northeast Pacific spreading centers: Evidence from Sea MARC I, J. Geophys. Res., 91, 13,925–13,940, 1986.
Kelly, D.S., and J.R. Delaney, Two-phase separation and fracturing in mid-ocean ridge gabbros at temperatures greater than 700°C, Earth Planet. Sci. Lett., 83, 53–66, 1987.
Kennedy, B.M., Nobel gases in vent fluids from the Juan de Fuca Ridge (abstract), Eos Trans. AGU, 66, 929, 1985.
Klinkhammer, G., Determination of Mn in seawater by flameless atomic absorption spectrometry after pre-concentration with B-hydroxyquinoline in chloroform, Anal. Chem., 52, 117–120, 1980.
Klinkhammer, G., and A. Hudson, Dispersal patterns for hydrothermal plumes in the South Pacific using manganese as a tracer, Earth Planet. Sci. Lett., 79, 241–249, 1986.
Klinkhammer, G., P. Rona, M. Greaves, and H. Elderfield, Hydrothermal manganese plumes in the Mid-Atlantic Ridge rift valley, Nature, 314, 727–731, 1985.
Kostsovinos, N.E., and E.J. List, Plane turbulent buoyant jets, 1, Integral properties, J. Fluid Mech., 81, 25–44, 1977.
Lerman, A., D. Lal, and M.F. Dacey, Stokes' settling and chemical reactivity of suspended particles in natural waters, in Suspended Solids in Water, edited by R.J. Gibbs, pp. 17–48, Plenum, New York, 1974.
Lichtman, G.S., and J.-P. Eissen, Time and space constraints on the evolution of medium-rate spreading centers, Geology, 11, 592–595, 1983.
Little, S.A., K.D. Stolzenbach, and R.P. Von Herzen, Measurements of plume flow from a hydrothermal vent, J. Geophys. Res., 92, 2587–2596, 1987.
Lupton, J.E., Fluxes of helium-3 and heat from submarine hydrothermal systems: Guaymas Basin versus 21°N EPR (abstract), Eos Trans. AGU, 64, 723, 1983.
Lupton, J.E., E.T. Baker, and G.J. Massoth, Variable 3He/heat ratios in submarine hydrothermal systems: evidence from two plumes over the Juan de Fuca ridge, Nature, 337, 161–164, 1989.
Lupton, J.E., G.P. Klinkhammer, W.R. Normark, R. Haymon, K.C. Macdonald, R.F. Weiss, and H. Craig, Helium-3 and manganese at the 21°N East Pacific Rise hydrothermal site, Earth Planet. Sci. Lett., 50, 115–127, 1980.
Lupton, J.E., J.R. Delaney, H.P. Johnson, and M.K. Tivey, Entrainment and vertical transport of deep-ocean water by buoyant hydrothermal plumes, Nature, 316, 621–623, 1985.
Lydon, J.W., and A. Galley, The chemical and mineralogical zonation of the Mathiati alteration pipe, Cyprus, and its genetic significance, in Metallogeny of Basic and Ultrabasic Rocks, edited by M.J. Gallagher, pp. 49–68, Institute of Mining and Metallurgy, London, 1986.
Massoth, G.J., R.A. Feely, and H.C. Curl, Jr., Hydrothermal manganese over the Juan de Fuca and Gorda ridges (abstract), Eos Trans. AGU, 63, 1147, 1982.
Massoth, G.J. R.A. Feely, H.C. Curl, Jr., and E.T. Baker, The geochemistry of particulate hydrothermal plumes over the Juan de Fuca Ridge (abstract), Eos Trans. AGU, 64, 722, 1983.
Merlivat, L., F. Pineau, and M. Javoy, Hydrothermal vent waters at 13°N on the East Pacific Rise: Isotopic composition and gas concentration, Earth Planet. Sci. Lett., 84, 100–108, 1987.
Middleton, J.M., and R.E. Thompson, Modelling the rise of hydrothermal plumes, Can. Tech. Rep. Hydrogr. Ocean Sci. 69, 18 pp., Can. Dep. of Fish. and Oceans, Sidney, B.C., 1986.
Morton, B.R., G.I. Taylor, and J.S. Turner, Turbulent gravitational convection from maintained and instantaneous sources, Proc. R. Soc. London, Ser. A, 234, 1-23, 1956.
Morton, J.L., and N.H. Sleep, A mid-ocean ridge thermal model: Constraints on the volume of axial hydrothermal heat, J. Geophys. Res., 90, 11,345–11,353, 1985.
Normark, W.R., J.L. Morton, R.A. Koski, D.A. Clague, and J.R. Delaney, Active hydrothermal vents and sulfide deposits on the southern Juan de Fuca Ridge, Geology, 11, 158–163, 1983.
Potter, R.W., and D.L. Brown, The volumetric properties of aqueous sodium chloride solutions from 0°C to 500°C at pressures up to 2000 bars based on a regression of available data in the literature, U.S. Geol. Surv. Bull., 1421-C, 1977.
Richardson, C.J., J.R. Cann, H.G. Richards, and J.G. Cowan, Metal-depleted root zones of the Troodos ore-forming hydrothermal systems, Cyprus, Earth Planet. Sci. Lett., 84, 243–253, 1987.
Rosenberg, N.D., J.E. Lupton, D. Kadko, R. Collier, M.D. Lilley, and H. Pak, Estimation of heat and chemical fluxes from a seafloor hydrothermal vent field using radon measurements, Nature, 334, 604–607, 1988.
Sibson, R.H., Fluid flow accompanying faulting: Field evidence and models, in Earthquake Prediction: An International Review, Maurice Ewing Ser., vol. 4, edited by D.W. Simpson and P.G. Richards, pp. 593–603, AGU, Washington, D.C., 1981.
Sibson, R.H., J.M. Moore, and A.H. Rankin, Seismic pumping—A hydrothermal fluid transport mechanism, J. Geol. Soc. London, 131, 653–659, 1975.
Turner, J.S., Buoyancy Effects in Fluids, Cambridge University Press, New York, 367 pp., 1973.
U.S. Geological Survey Juan de Fuca Study Group, Submarine fissure eruptions and hydrothermal vents on the southern Juan de Fuca Ridge: Preliminary observations from the submersible Alvin, Geology, 14, 823–827, 1986.
Von Damm, K.L., and J.L. Bischoff, Chemistry of hydrothermal solutions from the southern Juan de Fuca Ridge, J. Geophys. Res., 92, 11,334–11,346, 1987.
Von Damm, K.L., J.M. Edmond, B. Grant, C.I. Measures, B. Walden, and R.F. Weiss, Chemistry of submarine hydrothermal solutions at 21°N, East Pacific Rise, Geochim. Cosmochim. Acta, 49, 2197–2220, 1985 a.
Von Damm, K.L., J.M. Edmond, C.I. Measures, and B. Grant, Chemistry of submarine hydrothermal solutions at Guaymas Basin, Gulf of California, Geochim. Cosmochim. Acta, 49, 2221–2237, 1985b.
Von Damm, K.L., B. Grant, and J.M. Edmond, Preliminary report on the chemistry of hydrothermal solutions at 21°N, East Pacific Rise, in Hydrothermal Processes at Seafloor Spreading Centers, edited by P.A. Rona et al., pp. 369–390, Plenum, New York, 1983.
Walker, S.L., and E.T. Baker, Particle-size distributions within hydrothermal plumes over the Juan de Fuca Ridge, Mar. Geol., 78, 217–226, 1988.
Wallace, R.B., and S.J. Wright, Spreading layer of two-dimensional buoyant jet, J. Hydraul. Eng., 110, 813–828, 1984.
Welhan, J.A., and H. Craig, Methane, hydrogen and helium in hydrothermal fluids at 21°N on the East Pacific Rise, in Hydrothermal Processes at Seafloor Spreading Centers, edited by P.A. Rona et al., pp. 391–410, Plenum, New York, 1983.
Wolery, T.J., and N.H. Sleep, Hydrothermal circulation and geochemical flux at mid-ocean ridges, J. Geol., 84, 249–275, 1976.
Wright, S.J., and R.B. Wallace, Two-dimensional buoyant jets in stratified fluid, J. Hydraul. Div. Am. Soc. Civ. Eng., 105(HY11), 1393–1406, 1979.
Young, C., and J.E. Lupton, An ultra-tight fluid sampling system using cold-welded copper tubing (abstract), Eos Trans. AGU, 64, 735, 1983.
Return to Abstract