U.S. Dept. of Commerce / NOAA / OAR / PMEL /Publications
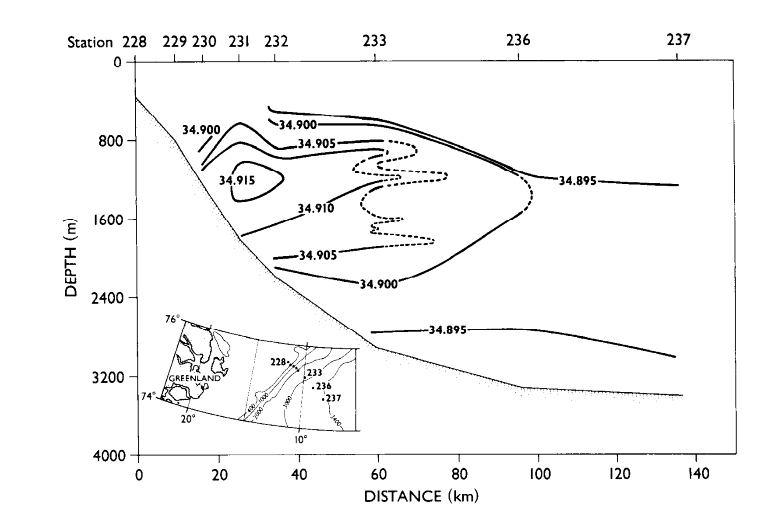
One or more intermediate salinity maxima connected with the outflow of deep water from the Arctic Ocean were found throughout most of the southwestern Greenland Sea during the 1987 cruise. Figure 2 shows the section extending NW-SE across the Greenland slope near 75°N. The saline core, which contains a salinity maximum of 34.919, lies over the slope just inshore of the 2000-m isobath, but its influence can be seen extending out over the abyssal plain. The salinity inversion structures with vertical scales as much as several hundred meters in the seaward extension of the core are reminiscent of those portrayed in Figure 10 of Aagaard et al. [1985] and would therefore seem to be a common feature in the spreading in the Greenland Sea of the salinity maxima which represent deep water from the Arctic Ocean. We did in fact also observe such salinity structures during subsequent cruises in both 1988 and 1989, although the details differ somewhat from year to year. We shall return to this latter issue.
Figure 2. Salinity distribution below about 500 m in the section between 75°-76°N (see inset for location). The most saline portion of the Arctic Ocean outflow is centered near 1200 m.
Figure 3 shows the potential temperature-salinity
characteristics below about 800 m at three stations: station 231, located over
the Greenland slope in the core of the saline outflow (cf. Figure
2); station 233, near the base of the slope where multiple cores with salinity
somewhat lower than at station 231 are apparent (cf. Figure
2); and station 264, near the supposed center of the deep convective region
of the Greenland Sea. Particularly notable is the presence of a salinity maximum
even in the latter region; a similar feature has been described by Clarke
et al. [1990]. Above 1900 m depth the potential temperature-salinity
values are plotted in Figure 3 at 50-m intervals
except for station 264, where the intervals are 100 m, as is also the case below
1900 m at station 233. Note that in moving away from the saline core over the
slope (station 231), the salinity maximum layers appear to be both freshened
and cooled, in accord with the proposed scheme of mixing between the Arctic
Ocean outflow and the GSDW. Examination of the entire data set for 1987 suggests
that the various salinity maxima can be represented as being of three types.
Type 1 is by far the most common salinity maximum below 1000 m. It almost always
represents the most saline water at that location (except for the upper layer
of warm water of recent Atlantic origin); its potential density is 28.075 ±
0.003; it generally lies at a depth of 1500 ± 300 m, except near the center
of the gyre where it is found down to about 2500 m; and at some stations it
is represented by several distinct maxima in the vertical. The absolute salinity
maxima at all three stations in Figure 3 are
of type 1. Type 2 is warmer and/or less saline, with a significantly lower potential
density, typically 28.067, and it is usually found above 1000 m. The upper salinity
maximum near 950 m at station 233 (Figure 3)
is an example of type 2. Because of its lower density, we will not consider
type 2 further here, but note that in like types 1 and 3, it also appears to
mix with relatively fresh and cold Greenland Sea waters. Type 3 is a colder
water with potential density 28.080 or more; it occurs at a relatively small
number of stations, where it is typically found near 2000 m. The deepest salinity
maximum at station 233, near 1800 m (Figure 3),
is an example of type 3. Note that the three thickest fingerlike salinity structures
shown in Figure 2 correspond to the three types
of salinity maximum we have described, with type 2 lying highest in the water
column and type 3 lowest. Note also that a typical density contrast between
waters of types 1 and 3 of 0.005 in ![]() increases to nearly 0.02 when the waters are compared at 2000 db.
increases to nearly 0.02 when the waters are compared at 2000 db.
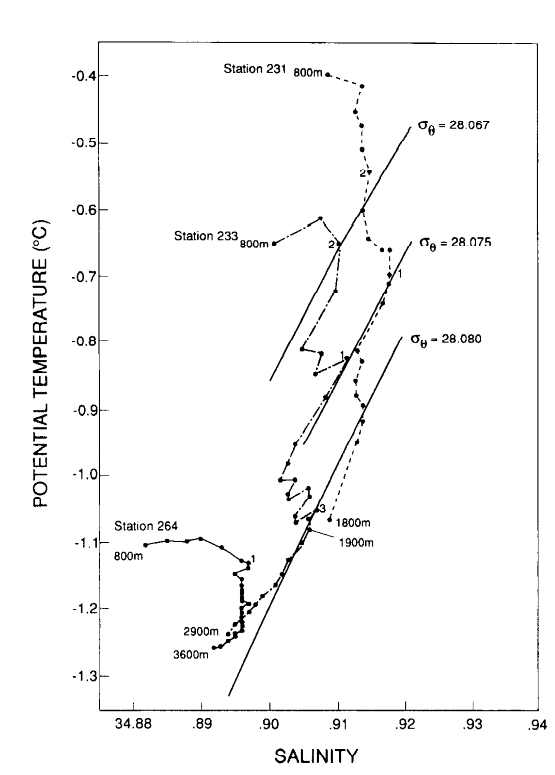
Figure 3. Potential temperature-salinity characteristics below 800 m at stations 231, 233, and 264. These stations respectively represent the Greenland slope where the Arctic Ocean outflow of highest salinity is found, the region near the base of the slope containing multiple reduced salinity maxima, and the central Greenland Sea in the region of deep winter convection where the deep water is the freshest. Plotting intervals for stations 321 and 233 are 50 m above 1900 m and 100 below 1900 m depths, plotting intervals for station 264 are 100 m over the entire depth range. The numbers 1, 2, and 3 denote the salinity maximum type (see text), and the solid lines represent the associated isopycnals at surface pressure.
The potential temperature-salinity characteristics of the type 1 salinity maximum at the various stations are remarkably well correlated. Figure 4 shows these characteristics for all the 1987 Greenland Sea stations south of 77°N, together with their linear regression (marked LR). Also shown in Figure 4 are the potential temperature-salinity relations below 1300 m at stations 203 and 204, the former located in northern Fram Strait over the lower Greenland slope, where the Arctic Ocean outflow first enters the Greenland Sea, and the latter in deeper water farther east, where its Arctic Ocean characteristics have been significantly altered. The type 1 points are clustered tightly about the regression line, with a correlation coefficient of 0.95 (n = 30). Furthermore, the regression line passes through the potential temperature-salinity characteristics of the GSDW as represented by the water below 3300 m at station 264, and it intersects the curve for station 203 just above 1700 m. Note also in Figure 4 that there is relatively little variation in core properties along the Greenland slope (compare station 231 over the central Greenland slope with stations 257 and 248 located 300-400 km to the southwest). These features suggest that the prominent intermediate salinity maximum in the Greenland Sea, which we have denoted type 1, represents water which has been withdrawn from the Arctic Ocean through western Fram Strait at about the 1700-m level (compare Aagaard et al. [1985]). This water flows southeastward along the slope, with the western part of the core being mixed relatively little. However, saline water on the eastern side of the core is drawn in toward the interior of the Greenland Sea, where it is mixed with cold, low-salinity Greenland Sea waters. Particularly notable is the presence of a slight salinity maximum even in the center of the deep Greenland Sea, where it lies above the colder and fresher GSDW (e.g., at station 263); Figure 4 suggest an Arctic Ocean contribution there of about 10%.
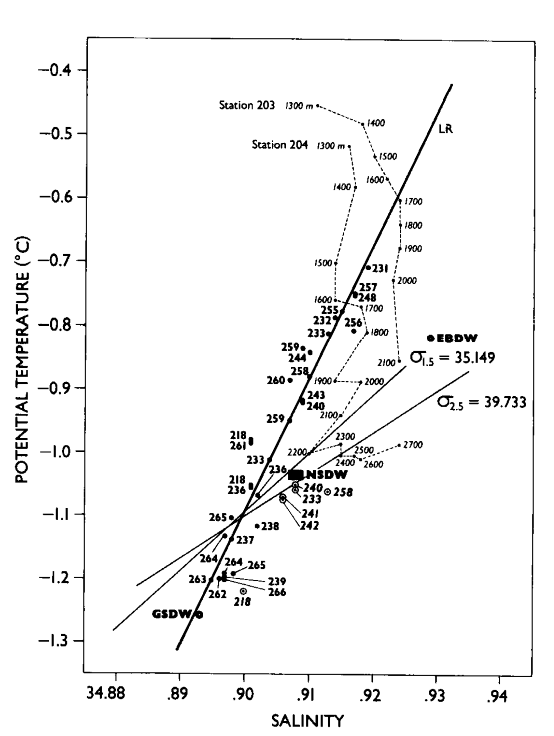
Figure 4. Potential temperature/salinity characteristics at the depth of the intermediate salinity maximum (solid circles with station numbers); the line LR shows their linear regression. At some stations there was more than one salinity maximum of type 1. The two lighter lines represent isopycnals at 1500 and 2500 db. The lighter solid circles labeled with their observation depths show the potential temperature/salinity characteristics below 1300 m at stations 203 and 204 (see Figure 1 for locations). The open circles denote type 3 salinity maxima. The deep water characteristics of the Greenland Sea (GSDW), Norwegian Sea (NSDW) and the adjacent Arctic Ocean (EBDW) are respectively derived from observations below 3300 m at station 264, from observations below 2500 m at the Norwegian Sea intercalibration station (denoted I in Figure 1) ,and from Swift and Koltermann [1988].
An important aspect of Figure 4 is that the
intermediate salinity maxima lie along a line (LR) strongly suggestive of two-component
mixing which is diapycnal at all but surface pressure, as is clear from the
orientation of the two subsurface isopycnals shown in Figure
4: ![]()
![]() = 35.149 and
= 35.149 and ![]()
![]() = 39.733. This contrasts with earlier suggestions that such mixing should be
isopycnal at ambient pressure [Aagaard
et al., 1985; Swift
and Koltermann, 1988]. We return to this issue in connection with the
formation of NSDW.
= 39.733. This contrasts with earlier suggestions that such mixing should be
isopycnal at ambient pressure [Aagaard
et al., 1985; Swift
and Koltermann, 1988]. We return to this issue in connection with the
formation of NSDW.
We have indicated in Figure 4 the characteristics of NSDW as exemplified by the property range below 2500 m determined by bottle samples at an intercalibration station in the northern Norwegian Sea during 1989 (denoted I in Figure 1). The NSDW characteristics adopted by Swift and Koltermann [1988] lie just outside this range on the cold and saline side. Note that these NSDW characteristics lie to the right of the type 1 regression line. Ignoring for the moment the possibility of temporal variability, this suggests that NSDW contains an Arctic Ocean contribution more dense and of deeper origin than what we have denoted as type 1 water. We also show in Figure 4 the potential temperature-salinity characteristics for the type 3 salinity maximum which was found at six stations. The control of the CTD salinity quality with independent bottle samples was very good at these stations, but the extreme maximum at station 258 (34.913) was seen only on the downcast. Since the CTD appears to have been well-behaved on both the preceding and following stations, and since agreement between the CTD and bottle samples was also acceptable on the upcast (with a potential temperature-salinity value at the depth of the deep salinity maximum comparable to those at stations 233 and 240), we do not feel justified in rejecting the salinity maximum on the downcast at station 258. Rather, the observations at this station may point to small-scale structure or fronts within the deep water, which were crossed during the time between the down- and upcasts. Regardless of uncertainty with respect to this station, it is clear that most of the type 3 water, which in potential temperature-salinity space lies extremely close to the properties of NSDW, could be formed by mixing between GSDW and water from the Arctic Ocean similar to that found at 2100 m at station 203. The latter is in fact close to the characteristics for such water adopted by Swift and Koltermann [1988] and labeled in Figure 4 as EBDW (Eurasian Basin deep water, a subset of AODW). Note also that such a mixing line lies closer to an in situ isopycnal than does the regression line for the type 1 salinity maxima, although the mixing would still be significantly diapycnal.
The potential temperature-salinity characteristics of station 204 (Figure 4) further strengthen the argument for mixing between GSDW and an Arctic Ocean source deeper and denser than that of the saline core over the Greenland slope (type 1). In particular, note that the potential temperature-salinity curve for station 204 is drawn down toward GSDW properties at a number of depths, including a thick layer between 2000-2500 dbar which approaches NSDW properties. Note also that this station lies in northern Fram Strait, suggesting that water with NSDW properties may be formed there by mixing between GSDW and EBDW. It is therefore possible that the presence of NSDW along the northern periphery of the Greenland gyre, first noted by Metcalf [1960], results at least in part from local formation of this water mass in Fram Strait, rather than simply representing a deep westward recirculation of water with a southern origin which has come northward through the eastern Greenland Sea as part of the large-scale cyclonic circulation.
Finally, we point out that our classification of the water exhibiting the salinity maximum into three types, while useful, is somewhat arbitrary even within this single data set, and that we can expect observations which do not fit the scheme rigorously. For example, the second-deepest salinity maximum at station 233, near 1600 m (Figure 3), is actually intermediate between types 1 and 3. However, the properties of this water are extremely close to those of NSDW defined in Figure 4, suggesting that type classifications, mixing schemes, and water mass conceptualizations need to retain a certain flexibility. This becomes particularly important when comparing data from different cruises. For example, while we found the salinity structures over the Greenland slope during both 1988 and 1989 to be generally similar to those in 1987, the details differ somewhat. Had we been working solely from either of those later data sets, we might therefore have chosen slightly different criteria in classifying or characterizing the structures, e.g., with respect to their density ranges. Thus, while the salinity maxima for 1988 and their associated potential temperatures cluster very closely around the type 1 regression line for 1987 (Figure 4), the 1989 data suggest the salinity maxima during that year to be slightly lower in density (by about 0.001 in the mean). However, none of these differences in detail alter our fundamental conclusion that a spectrum of saline water types from the deep water regime of the Arctic Ocean interleaf and mix with fresher and colder waters which have been conditioned by surface processes in the Greenland Sea.
We have plotted in Figure 5 the areal distribution
of the salinity maximum for water with type 1 characteristics (shown by three-digit
salinity values), together with the salinity distribution on the surface ![]() = 28.075 (heavy lines denoted by five-digit salinity values). This surface corresponds
to the mean potential density of the type 1 salinity maximum. We note that the
selection of a plotting surface is somewhat arbitrary in this instance, since
the mixing appears to be significantly diapycnal, but mapping the salinity distribution
on other surfaces yields similar results.
= 28.075 (heavy lines denoted by five-digit salinity values). This surface corresponds
to the mean potential density of the type 1 salinity maximum. We note that the
selection of a plotting surface is somewhat arbitrary in this instance, since
the mixing appears to be significantly diapycnal, but mapping the salinity distribution
on other surfaces yields similar results.
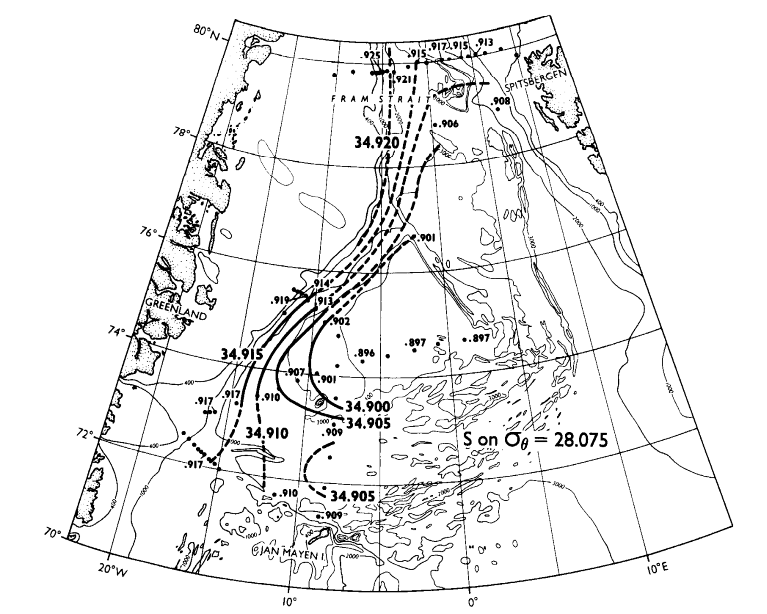
Figure 5. Salinity at the depth of the intermediate salinity maximum; only the last three digits are shown. Heavy lines denoted by five digits show the distribution of the salinity on an isopycnal surface corresponding approximately to the midpoint of the regression line in Figure 4.
Two features in Figure 5 stand out. One is the
suggestion that the saline outflow from the Arctic Ocean follows the Greenland
continental slope in a coherent fashion only to about 74°N. South of that latitude
the isopleths diverge, and a significant portion of the saline core appears
to recirculate eastward, closely following the deeper isobaths. This recirculation
is clearly seen in the records from current meters moored approximately along
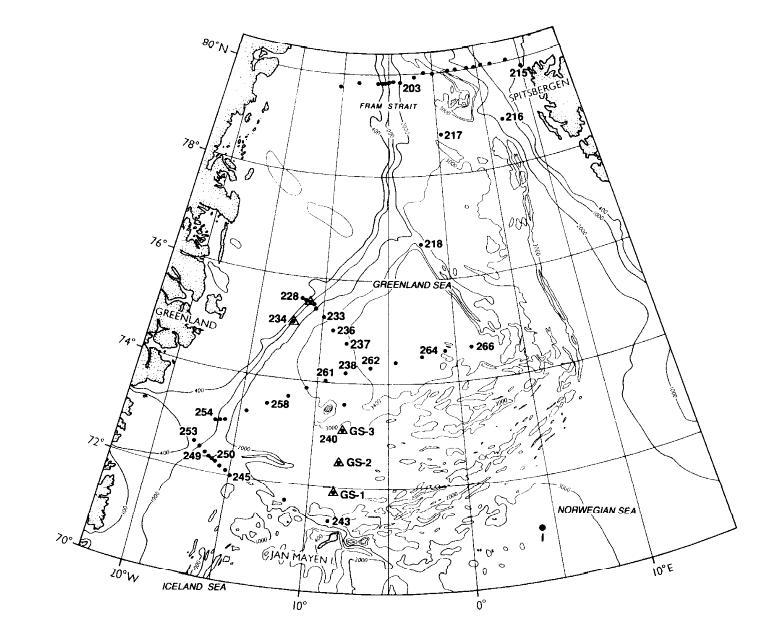
the meridian 8°W during 1987-1988 (positions shown in Figure
1). Table 1 shows that at the northernmost mooring (GS-3 at 73°N), the long-term
mean flow, which is barotropic, was directed eastward at 5-6 cm s![]() .
In contrast, the two sites farther south did not show statistically significant
mean flow at any level. The concentration of the recirculation north of 72°30
.
In contrast, the two sites farther south did not show statistically significant
mean flow at any level. The concentration of the recirculation north of 72°30![]() N
suggested by the current records is consistent with the stronger horizontal
gradient in the salinity field in that region shown in Figure
5. Instead of representing a broad eastward sweep throughout the southern
Greenland Sea, the recirculation therefore appears to be concentrated in a rather
narrow band, perhaps 50 km in meridional extent (contrast the schematic representation
in Figure 12 of Smethie
et al. [1988]).
N
suggested by the current records is consistent with the stronger horizontal
gradient in the salinity field in that region shown in Figure
5. Instead of representing a broad eastward sweep throughout the southern
Greenland Sea, the recirculation therefore appears to be concentrated in a rather
narrow band, perhaps 50 km in meridional extent (contrast the schematic representation
in Figure 12 of Smethie
et al. [1988]).
| Standard | |||||
|---|---|---|---|---|---|
| Maximum Speed | Deviation | ||||
| Depth, | Record Length, | Mean Velocity, | (6-Hour Mean), | Principal | (6-Hour Mean), |
| m | Days | cm s |
cm s |
Axis, °T | cm s |
| Mooring GS-1 (71°55.7 |
|||||
| 74 | 80 | 0.3, 173°T | 3.0 | 330 | 0.8 |
| 214 | 355 | 1.6, 118°T | 12.3 | 275 | 2.6 |
| 2374 | 355 | 1.6, 87°T | 8.6 | 260 | 2.1 |
| Mooring GS-2 (72°27.6 |
|||||
| 60 | 356 | 1.5, 299°T | 14.2 | 295 | 3.8 |
| 200 | 356 | 1.1, 301°T | 12.8 | 290 | 3.5 |
| 2410 | 356 | 1.3, 288°T | 14.8 | 315 | 2.2 |
| Mooring GS-3 (73°03.8 |
|||||
| 80 | 357 | 6.0, 94°T | 20.7 | 290 | 3.8 |
| 220 | 357 | 5.5, 93°T | 20.1 | 290 | 3.6 |
| 2570 | 357 | 5.4, 90°T | 20.9 | 280 | 4.3 |
The second important feature in Figure 5 is the apparent continuation of the most saline water southward into the Iceland Sea, as indicated by the orientation of the isohaline 34.915. The sill depth between Greenland and Jan Mayen exceeds 1600 m, with a trough cutting southward across the western part of that passage near the location of station 248, where Figure 5 shows a maximum salinity of 34.917 near 1300 m. (Other stations in this southernmost section were in water insufficiently deep to define a salinity maximum.) Except for type 3 water, the saline cores are therefore not topographically constrained from entering the Iceland Sea. They cannot, however, continue out of the Iceland Sea along the Greenland slope, since the sill depth in Denmark Strait, between Greenland and Iceland, is only about 600 m. It therefore appears that saline outflow from the Arctic Ocean contributes directly and in significant quantities to the deep water of the Iceland Sea, where there is no low-salinity GSDW to dilute it, only the slightly less dense intermediate waters produced there. We would, for example, expect a high-resolution comparison of the deep waters of the Norwegian and Iceland seas to show the water in the latter basin to be slightly more saline. Clarke et al. [1990] have in fact shown that the deep Norwegian Sea contains a slight salinity maximum in the vertical, and we suggest that this feature originates with the intermediate salinity maximum carried southward from the Arctic Ocean into the Iceland Sea, whence its mixing products feed the Norwegian Sea. Very recently, Malmberg et al. [1990] have also presented evidence of Arctic Ocean outflow in the Iceland Sea; during the 3 years 1987-1989 the most pronounced occurrence appears to have been in 1987, the year of the observations reported here.
We had earlier suggested that the saline core of Arctic Ocean outflow might
also be distinguishable by a local silicate maximum [Aagaard
et al., 1985]. Our present detailed sampling does not show any nutrient
extrema associated with the salinity maximum, however (Figure
6). Instead, there is a small minimum in dissolved oxygen, with values near
7 mL L![]() (Figure
6). Such a minimum is also present at middepth (6.9 mL L
(Figure
6). Such a minimum is also present at middepth (6.9 mL L![]() near 1600 m) at station 203 in northernmost Fram Strait, where it is probably
a representative feature of upper Arctic Ocean deep water. Within the Greenland
Sea, therefore, the oxygen minimum appears to be advected from the north with
the saline core, rather than being formed locally by nonconservative processes.
Its origin within the Arctic Ocean is uncertain and will probably remain so
until the data base there is expanded considerably.
near 1600 m) at station 203 in northernmost Fram Strait, where it is probably
a representative feature of upper Arctic Ocean deep water. Within the Greenland
Sea, therefore, the oxygen minimum appears to be advected from the north with
the saline core, rather than being formed locally by nonconservative processes.
Its origin within the Arctic Ocean is uncertain and will probably remain so
until the data base there is expanded considerably.
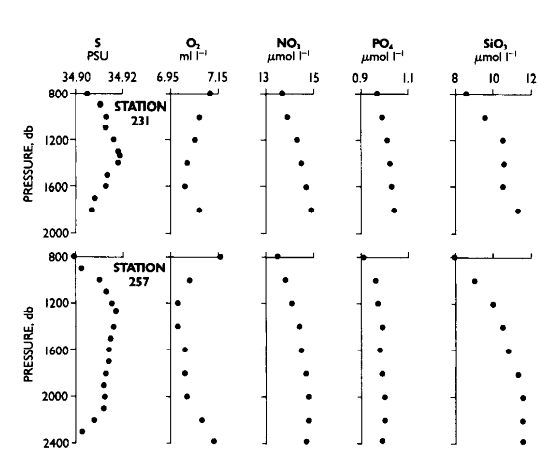
Figure 6. Distribution below 800 m of salinity, dissolved oxygen, and nutrients at two stations in the core of the saline Arctic Ocean outflow (see Figure 1 for locations).
However, the distribution in the Greenland Sea of the oxygen minimum provides independent evidence of two-part mixing similar to that suggested by the temperature/salinity correlations. To check the applicability of the two-component mixing concept, we performed a regression analysis on the bottle-based oxygen, temperature, and salinity data corresponding to the type 1 salinity maximum. We found that not only did the bottle-based temperature-salinity data provide a fit virtually identical to that of Figure 4, based on the CTD data, but the correlation between these two parameters and dissolved oxygen also corresponded closely to two-part mixing (Figure 7), with a correlation coefficient of -0.94 (n = 23). Over the spatial and temporal scales represented by these observations, dissolved oxygen in the Greenland Sea therefore appears to be a nearly conservative tracer, the distribution of which is consonant with the two-part diapycnal mixing suggested by the temperature-salinity correlation portrayed in Figure 4.
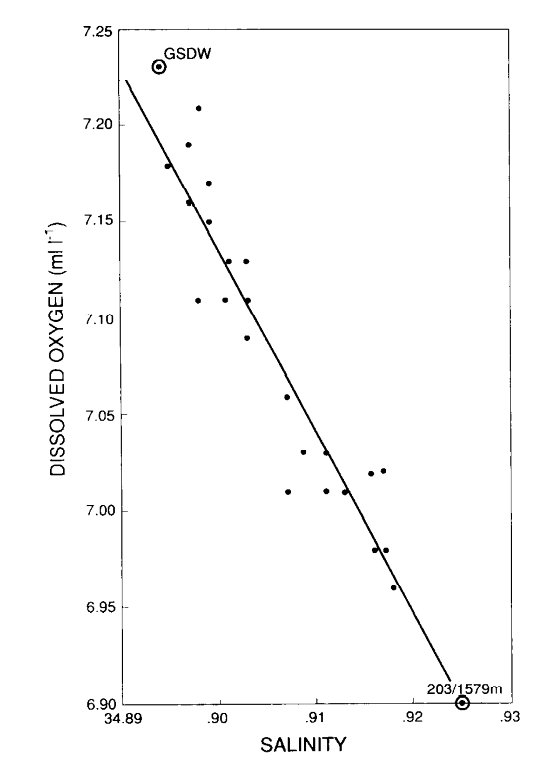
Figure 7. Dissolved oxygen-salinity characteristics at the depth of the intermediate salinity maximum; the line LR shows their linear regression. The characteristics of the deep Greenland Sea (GSDW) and of the outflow from the Arctic Ocean of the type 1 salinity maximum (203/1579 m) are respectively derived from samples at 3337 m at station 264 and at 1579 m at station 203.
Go to previous or next section