Pacific Marine Environmental Laboratory
7600 Sand Point Way NE
Seattle, WA 98115 USA
Meghan Cronin's Home Page
DOC | NOAA | OAR | PMEL
Privacy Policy | Disclaimer
Presented by Meghan Cronin
to
OAR Fleet Management Committee and OAR reps
(Fred Rossman, Louisa Koch, Beth White, Ken Mooney,...)
via conference call on 2/13/01.
* The TAO/PACS-EPIC project requests a 3-4 day piggyback on the TAO 95W/110W Ron Brown cruise in FY02 and in FY03.
* Three days are the minimum days required to achieve our science goals.
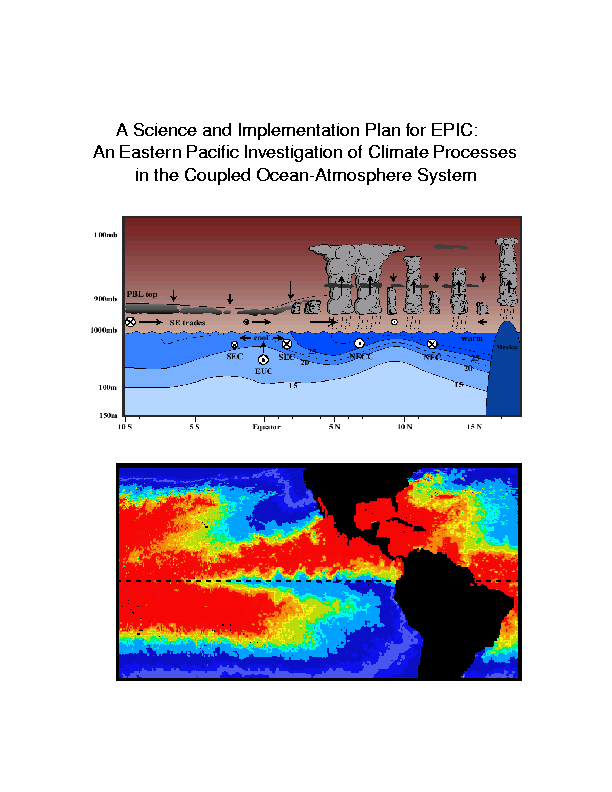
Figure 1. EPIC science objectives
I'll begin with a discussion of the EPIC science
objectives.
* This figure shows the cover page of the "Science and
Implementation Plan for EPIC: An Eastern Pacific
Investigation of Climate Processes in the Coupled Ocean-Atmosphere
System".
* The bottom figure shows SST field, with cool (blue color) water off
South America and along the equator, and warm waters (represented
by reds) north of the equator. As shown in the top
cartoon, the meridional structure of the SST field is reflected
in the cloud structure: The sratus deck extends from the cool waters
off South America to the convective region of the cold tongue / ITCZ
complex. At and north of the ITCZ, in the "breeding grounds" of east
Pacific tropical storms, SSTs are extremely warm.
* Understanding the ocean-atmosphere coupling responsible for the
structure and evolution of the CT/ITZC complex is a prime objective of
the EPIC program. It is expected that this will lead to improved
predictability of short-term climate analyses in the Pan-American
region and improved predictability of warm season rainfall over the
Americas.
EPIC is a US CLIVAR initiative. EPIC fieldwork includes short-term
intensive process studies embedded within longer-term larger-scale
enhanced monitoring. The EPIC2001 process study (which will take
place next September) is funded jointly by NOAA and NSF. Longer-term
enhanced monitoring projects (such as the TAO/EPIC project) are funded
through the NOAA PACS program by NOAA OAR and OGP.
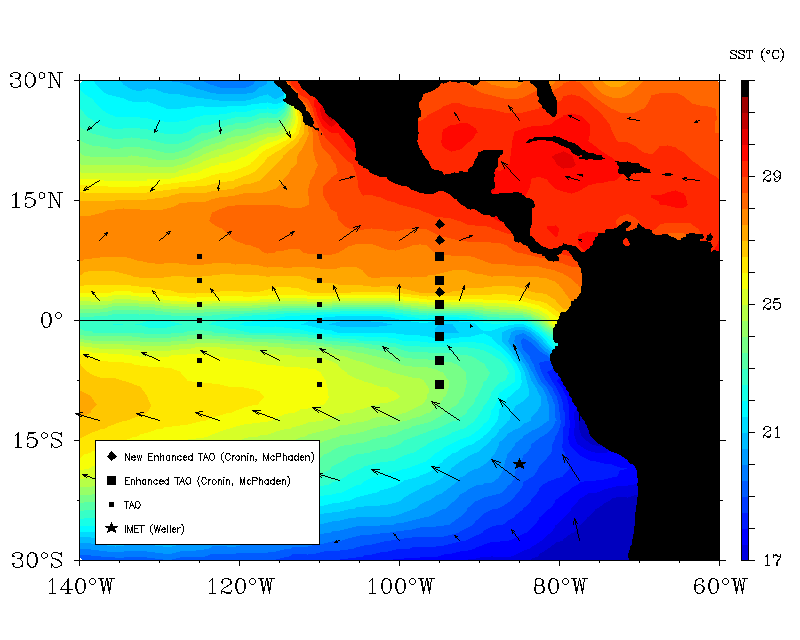
As part of the enhanced monitoring for EPIC, the TAO array has been
enhanced with extra sensors and 3 extra buoys which extend the line
northward through the monsoonal trough, and add resolution on the
northern edge of the cold tongue where the meridional gradients are
large.
Small squares are the TAO moorings.
Each of the 10 enhanced TAO moorings carries shortwave and longwave
radiometers, a rain gauge, barometric pressure sensor, extra thermistors
in the mixed layer, 7 conductivity sensors and 1-2 current meters, in
addition to the standard TAO sensors. These enhancements enable us
to monitor the air-sea heat, moisture and momentum fluxes, and upper ocean
temperature, salinity and horizontal current structure in the
cold tongue/ITCZ complex from the stratus deck region at 8°S, 95°W
through the CT/ITCZ complex to the warm pool region at 12°N, 95°W.
The enhancements began in November 1999. Final recoveries will occur
in the Fall 2003, thus providing 3-4 years of data.
* Funding:
* Required Shiptime:
However, because of the extra payload associated with these 3 moorings, the
work must be done from a class 1 ship. Thus we have requested
a minimum of 3 additional days on the Ron Brown TAO cruise.
The fourth day requested was to do a 1-day intercomparison between the
buoy and shipboard measurements. Chris Fairall will have a suite of
sensors onboard the 95W/110W TAO tender cruise as part of his EPIC
enhanced monitoring project. This made the buoy/ship intercomparison
partiuclary interesting as we would be able to compare our bulk fluxes
to Chris Fairall's direct flux measurements.
* Effects of dropping the project:
The 1-day intercomparison was a cool idea but is not critical to the
science objectives of the program. It could be dropped without
jeopardizing the program. However, 3 days are critical. Essentially
without these 3 days of shiptime, we cannot have these 3 moorings at
12N, 10N, and 3.5N. 3-days per year to maintain the EPIC enhancements
is Rock Bottom.
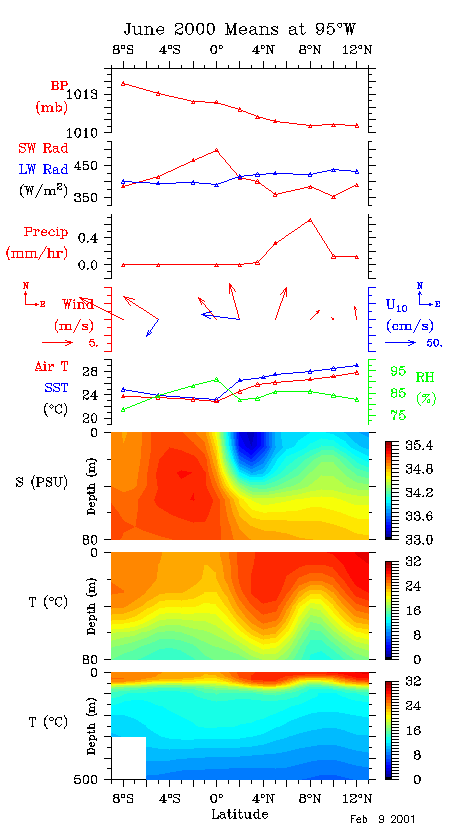
Figure 3. June 2000 Cold Tongue/ITCZ complex
(from TAO/EPIC data)
This figure shows the 95W mean cross-section for June 2000.
Essentially, this is the observed realization of the cartoon
on the cover of the science and implementation document that
I showed at the start.
Top panel shows the barometric pressure field,
Note, this figure is based only on realtime data. During the first
deployment year, most of the subsurface currents were not
transmitted and therefore are not shown here.
So what is the effect of not having the 3 extra moorings?
Looking at the winds, we see the convergence (and rainfall) associated
with the ITCZ between 5N and 10N. Without the 10N and 12N moorings, we
would not have data that straddles the ITCZ.
And what about the 3.5N mooring? Certainly, we need this mooring to
help resolve the very temperature front on edge of the cold tongue.
However what's really curious is that the salinity field is anomalously
fresh between 2N and 4N. Thus the salinity gradient changes sign in
this region. What is the role of this salinity structure? What causes
and maintains these large meridional gradients? How do they affect the
coupled system? We need the 3.5N mooring to help resolve these sharp
gradients.
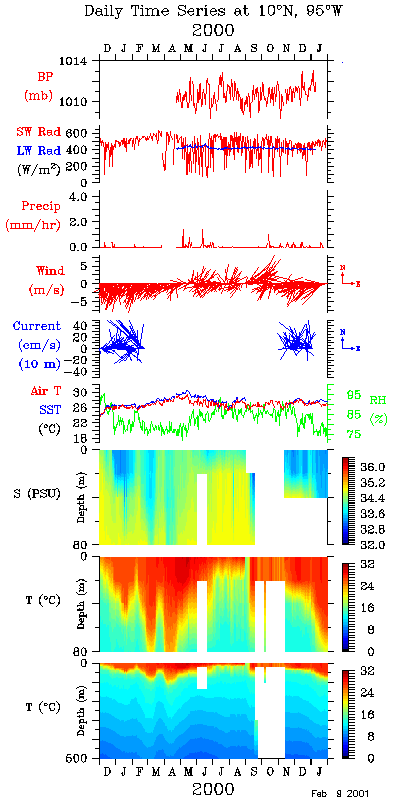
Of course, the system varies on a variety of timescales -- interannually
associated with ENSO, seasonally, and on even more rapid time scales.
A major advantage of moored buoys is that they we can monitor this
temporal variability.
This figure shows the time series of the daily averaged realtime data
at 10N, 95W. The panels show the variables in the same order as the
previous figure -- bp at top, winds in the middle, and the ocean salinity,
and temperature at the bottom. Time here ranges from Nov 99 to yesterday.
Clearly, this is a very complicated system, with large spatial and
temporal variability.
In September 2001, the CT/ITCZ phase of the EPIC2001 process study
will take place next to 10N,95W buoy. As shown in this diagram,
measurements will be made from a variety of platforms including
-- the Ron Brown, the New Horizon, 2 aircraft, and aerosonds.
The TAO/EPIC mooring array provides critical data to this effort
to better understand the meridional structure and evolution of the
cold tongue/ITCZ complex.
* 3 days are required to recover and deploy the 3 EPIC moorings at
3.5N, 10N, 12N along 95W. These days are critical for success of EPIC
and EPIC2001.
* Because of payload constraints associated with the 3 extra moorings,
the ship must be a class 1 ship, such as the Ron Brown.
* The TAO/EPIC project has 5 years of funding from NOAA OGP/OAR (May
1999 - May 2004).
* EPIC is a US CLIVAR initiative. Enhanced monitoring has been funded
through the NOAA PACS program by NOAA OGP and OAR. EPIC2001 fieldwork
is funded jointly through NOAA and NSF.
Big Squares are TAO enhanced moorings.
Big Diamonds are new TAO enhanced moorings -- at 3.5N, 10N, and 12N, 95W
The Star is Bob Weller's IMET mooring in the stratus region.
The project has 5-years of funding through NOAA OGP.
As discussed by Paul Freitag, each mooring must be recovered and a new
mooring redeployed in its place at 12 month intervals +/- 1 month.
A mooring recovery/deployment takes 1 full day. Thus the 3 additional
moorings at 3.5N, 10N, and 12N involve at a minimum, 3 additional
shipdays annually, which can be piggybacked onto the TAO tender cruise.
We have requested 3-4 days shiptime on the Ron Brown TAO cruise.
next panels shows shortwave and longwave radiation.
Next panel -- rain. Highest accumulations are at 8N.
Below that -- winds and some of the currents (in blue).
The bottom 3 panels show upper ocean salinity, upper ocean temperature, and
the temperature down to 500 m.
* 3-4 days on the TAO 95W/110W Ron Brown cruise
|
Meghan F. Cronin Pacific Marine Environmental Laboratory 7600 Sand Point Way NE Seattle, WA 98115 USA |
Return to: Meghan Cronin's Home Page DOC | NOAA | OAR | PMEL Privacy Policy | Disclaimer |