


2017 State of the Climate_Ocean Heat 2017.jpg
Image
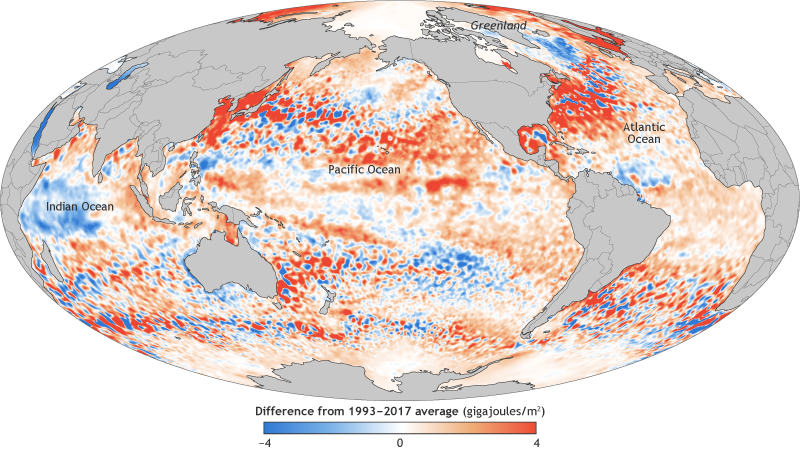
This map shows the ocean heat content in the upper ocean (from the sea surface to a depth of 700 meters, or 2,300 feet) for 2017 relative to the 1993–2017 baseline. It's based on a combination of Argo float observations and satellite data. Places with higher-than-average heat storage are orange, while places with lower-than-average heat storage are blue