Hi Ajay,
If you specify a time axis using the arange specifier, then 'size' should be the number of days between the start date you list, and the last date in the data. The time menu on the interface will list all of the days.
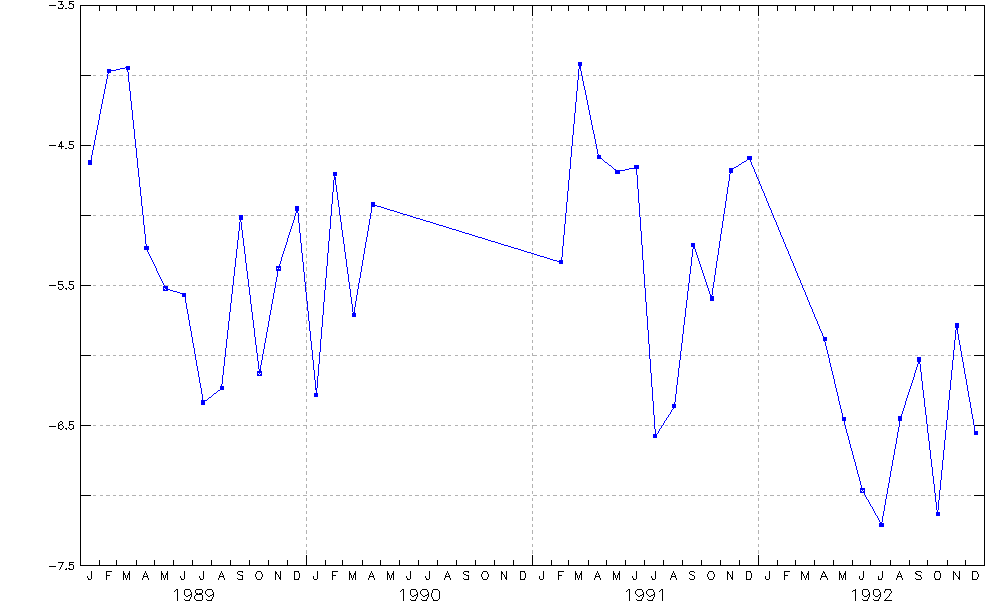
Depending on how the data is stored in the dataset, it will likely appear that there is a large timestep in the time axis for the data, so that instead of seeing missing data values, you'd see something like this for a time series plot (This is monthly data where I took out a number of months in the middle.)
On 7/25/2013 8:54 AM, Ajay Krishnan - NOAA Affiliate wrote:
Hello!
Say, I have an ncml aggregation that contains 1000 records (1 record per day). The data is not necessarily contiguous, i.e. data might be missing for certain days in between.
How should this value of 1000 records correspond to the time variable generated from the addXML utility?
The data generated from the addXML has a time format which looks like this
<time-t-id-7dc5e40ce0 type="t" units="day">
<arange start="2008-04-01" size="x" step="1" />
</time-t-id-7dc5e40ce0>
Should the 'size' attribute above be equal to the total number of records in the ncml (1000, in this case) or 1941(which is the number of days to date, since the start time)
Thanks,
Ajay
