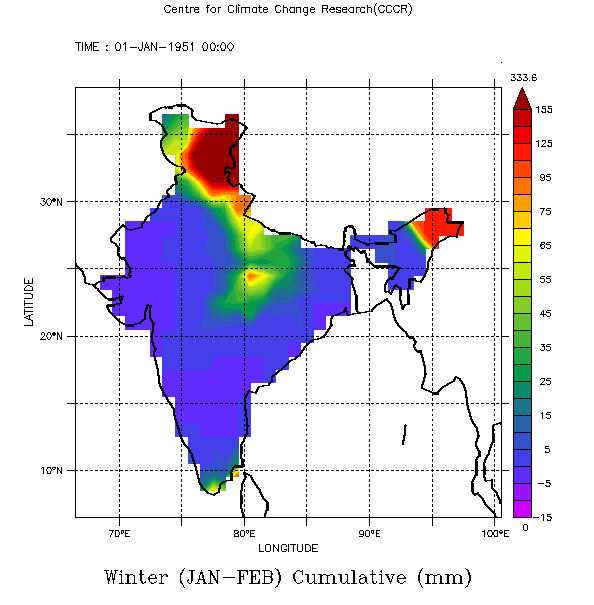
One addition to my answer to question 1 below. For an anomaly variable, it's useful to have a property that will tell the Ferret scripts that the levels should be centered. This will mean that the same color is used for zero on all plots and the levels are symmetric around zero. A centered color palette is used to highlight this.
<ferret>
<palette>light_centered</palette>
<fill_levels>vc</fill_levels>
</ferret>
The V gives us the variance-based, open-ended levels; the C specifies centered levels.
Ansley
On 3/29/2011 9:50 AM, Ansley Manke wrote:
On 3/29/2011 3:31 AM, sandip wrote:Hi Dear All,In your xml configuration for this variable, you can set some custom color levels. This would generally be done as a Ferret property for each variable, though if you had a dataset whose variables all have similar ranges, it could be a Ferret property applying to the whole dataset.
I am struggling to make the changes in ferret files, categorise and sub categorise the datasets and OpenLayer Map.
1. Range of column bar is of the ferret map is starting from random minus value instead of zero (It must start from zero) and some case like anomaly
it should start from minus value. (for anomaly its showing right values). How to set the colour bar range in ferret file?
This might look something like this:
<variables>
<RAIN-id-60f7e24b64 name="rainfall" units="mm" url="">
<link match="/lasdata/grids/grid-LONGITUDE-LATITUDE-TIME-id-60f7e24b64" />
<properties>
<ferret>
<fill_levels>(0,75,5)(75,155,10)(inf)</fill_levels>
</ferret>
</properties>
</RAIN-id-60f7e24b64>
Which would use similar levels to what is automatically computed, but always starting at zero. It still keeps an open-ended level at the top. If you want to set up your own levels for an anomaly, (-inf) is used to specify an open-ended level at the lower end of the scale. You could also use just a linear scale such as
<fill_levels>(0,160,10)(inf)</fill_levels>
Or any other Ferret specification for LEVELS, which are discussed in the Ferret documentation,
http://ferret.pmel.noaa.gov/Ferret/documentation/users-guide/customizing-plots/CONTOURING#_VPINDEXENTRY_852
2. How to arrange the Multiple datasets in one category (e.g. All rainfall dataset should come under Rainfall category). I have done with -D option in addxml.sh but it wont work.
3. Third problem is, I want to change the tile of OpenLayer Map. Is it possible to change the map or replace the tile in LAS Application.
--
Warm Regards,
Sandip Ingle,

