John Maurer, IV wrote:
Hi
Roland,
All are calling the same UI default, so I don't think that's the issue
about why the x axis is being ignored. But hopefully the full
configuration files will help tease out the problem. I've attached two
and renamed them to old_working.xml and new_broken.xml. In addition,
I've included their default UI config file in case that helps
(ui_hawaii.xml). If you need something else, lemme know. Thanks!
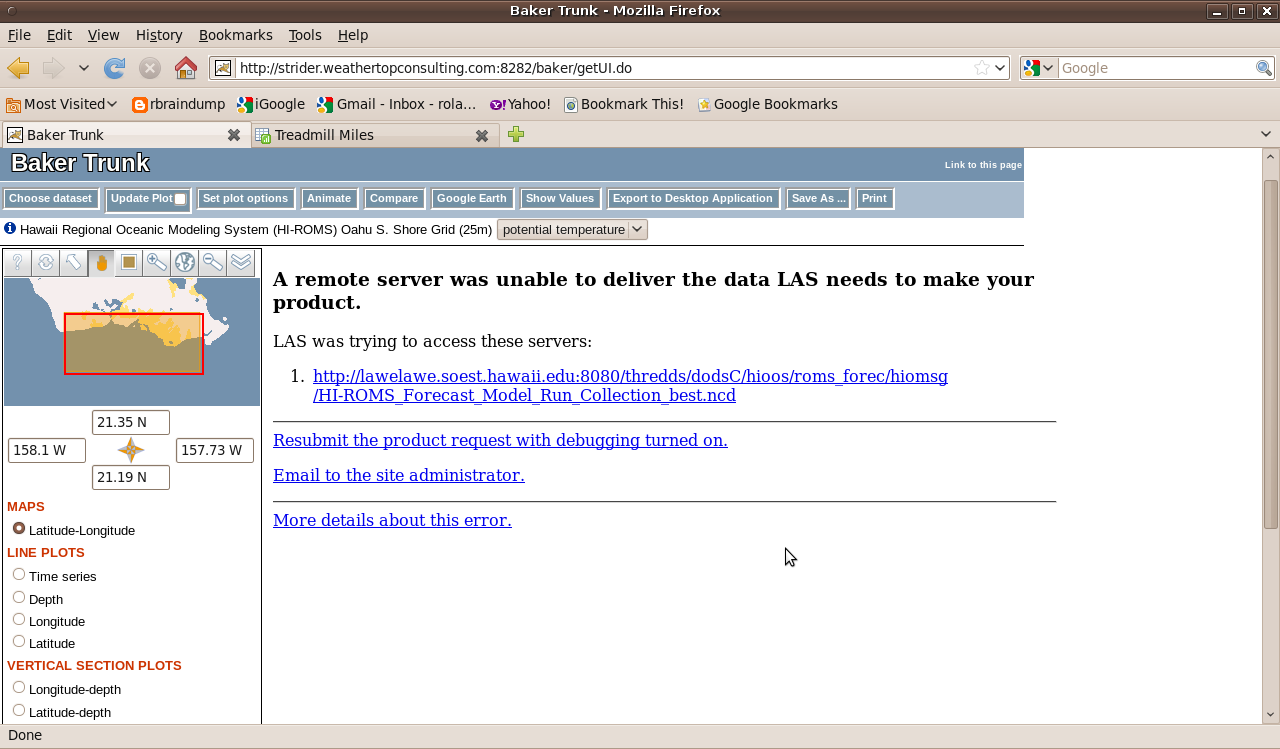
Well, I've had a look. Here's a screen shot of the new interface with
the new_broken.xml configuration.
Is the region you expect to see in the old interface?
Roland
Cheers,
John
----- Original Message -----
From: Roland Schweitzer <Roland.Schweitzer@xxxxxxxx>
Date: Thursday, June 3, 2010 8:41 am
Subject: Re: [las_users] longitude range in dataset XML ignored by LAS
UI map
To: "John Maurer, IV" <jmaurer@xxxxxxxxxx>
Cc: oar.pmel.las_users@xxxxxxxx
|
>
John Maurer, IV wrote:
Dear LAS Community,
>
I'm having difficulty specifying the longitude range
for a new dataset that I'm trying to add to our LAS installation (LAS
UI Version 6.5.2.2). No matter what I put in my LAS XML config file,
the longitude range is ignored and the entire available longitude range
in my LAS interactive map is used instead. The only thing that differs
between this and a previous dataset (ROMS ocean model) is that this one
is higher resolution (~25 m, or ~0.0027 degrees longitude). Does LAS
have a minimum allowable "step"/cell size? Here is what I have in my
LAS XML config file for latitude and longitude for this dataset:
>
>
<axes>
>
<xi_rho-x-id-3ef0b0503f type="x"
units="degrees_east">
>
<arange start="-158.1" size="139"
step="0.0027" />
>
</xi_rho-x-id-3ef0b0503f>
>
<eta_rho-y-id-3ef0b0503f type="y"
units="degrees_north">
>
<arange start="21.187" size="47" step="0.0035"
/>
>
</eta_rho-y-id-3ef0b0503f>
>
[cont'd...]
>
>
In other words, the longitude should range from
-158.1 to 139*0.0027+-158.1=-157.7247. But neither this min or max
longitude is used when the interactive map appears in the LAS UI.
Instead, the full longitude range of my interactive map is used instead
(-166 to -151), resulting in xy map plots that do not render any data
and span the entire globe in longitude (0-360 degrees). I have tried
slightly modifying the "start", "size", and "step" values for the x
axis with no luck.
>
>
The data that this is working on pulls from a "best
time series" forecast model run collection (FMRC) output in our THREDDS
Data Server (TDS) using the following OPeNDAP URL:
>
>
http://lawelawe.soest.hawaii.edu:8080/thredds/dodsC/hioos/roms_forec/hiomsg/HI-ROMS_Forecast_Model_Run_Collection_best.ncd
>
>
To see what I mean, go to:
>
>
http://oos.soest.hawaii.edu/las
>
>
Select "Hawaii Regional Oceanic Modeling System
(HI-ROMS) Oahu S. Shore Grid (25m)". Select any variable (e.g.
"potential temperature"). Click "Next>". The full region is a small
but wide sliver over what is a map of Hawaii (mostly greyed out). Note
that the longitude range is much wider than what I specified in the XML
(pasted above). Click "Next>" and you will get a mostly empty xy map
plot that spans globally from 0-360 degrees in longitude. Go back and
change the longitude range from -158.0 to -157.8. Click "Next>" and
you will see what the data should look like.
>
>
Any ideas why LAS is ignoring my longitude settings?
Thanks for any help. I have been baffled by this for longer than I want
to admit!
>
I'm sorry you're having trouble. I'm guessing that the
other data sets in this configuration have a "UI default" property the
defines the map. It looks like the new data set might be trying to use
the global base map. Can you send the full configuration for the new
data set and one of the others so we can compare?
>
>
Roland
>
>
Regards,
>
John Maurer
>
---
>
Hawaiʻi Ocean Observing System (http://hioos.org)
>
School of Ocean and Earth Science and Technology
(SOEST)
>
University of Hawaiʻi at Mānoa
|
|