Regards,
Anton Yoel Buenavista
-------- Original Message --------
Subject: Re: [las_users] Using ferret scripts in LAS
From: Ansley Manke <Ansley.B.Manke@xxxxxxxx>
To: Buenavista Anton Yoel Dioquino <ay.buenavista@xxxxxxxxxx>
Cc: "oar.pmel.las_users@xxxxxxxx" <oar.pmel.las_users@xxxxxxxx>
Date: Wednesday, 10 March, 2010 7:58:00 AM
Hi Anton,
Sending this last message back to the LAS users group so that the thread there gets this info.
Ok, good. So this is quite a small region. I don't usually see grids with small ranges like this, and I couldn't quite see the axis labels on the plots you sent. This will work fine. The change we need is in the definition of the X and Y axes. The min, max, and step sizes need to be set so that
min + nstep*stepsize = max
The step sizes in the xml file you were trying were too big.
<axes>
<lon-x-id-d91582b933 type="x" units="degrees_east">
<arange start="102.8096" size="1320" step="0.001333" />
</lon-x-id-d91582b933>
<lat-y-id-d91582b933 type="y" units="degrees_north">
<arange start="0.1909" size="1482" step="0.001212" />
</lat-y-id-d91582b933>
I realize that when you made this with AddXML, it puts the properties in each variable. We can simplify the xml file by just putting these as dataset properties at the start. I tried this xml file in my test LAS server, and it works fine.
curv_lat_min and curv_lat_max are not ever actually used; AddXML must have put them in. But they don't harm anything.
<datasets>
<id-d91582b933 name="Hydro Model"
url="" moz-do-not-send="true" class="moz-txt-link-rfc2396E" href="http://www.porl.nus.edu.sg:9080/thredds/dodsC/las/TMH/hydro_avged_2D.nc">"http://www.porl.nus.edu.sg:9080/thredds/dodsC/las/TMH/hydro_avged_2D.nc">
<!-- Default properties for this dataset -->
<properties>
<ferret>
<curvi_coord_lon>LON</curvi_coord_lon> <!-- curv. coords -->
<curvi_coord_lat>LAT</curvi_coord_lat> <!-- curv. coords -->
<lon_modulo>0</lon_modulo>
<curv_lon_min>102.81</curv_lon_min>
<curv_lat_min>0.19093</curv_lat_min>
<curv_lon_max>104.57</curv_lon_max>
<curv_lat_max>1.9865</curv_lat_max>
</ferret>
</properties>
<variables>
<h-id-d91582b933 name="distance from still water level to sea bed" units="meter" url="">
<link match="/lasdata/grids/grid-lon-lat-id-d91582b933" />
</h-id-d91582b933>
<mask-id-d91582b933 name="computational mask. 1 is a computational cell, 0 is a land cell." units="none" url="">
<link match="/lasdata/grids/grid-lon-lat-id-d91582b933" />
</mask-id-d91582b933>
<e-id-d91582b933 name="water surface elevation from still water level" units="meter" url="">
<link match="/lasdata/grids/grid-lon-lat-time-id-d91582b933" />
</e-id-d91582b933>
<va-id-d91582b933 name="depth averaged current speed along y-axis" units="meter/second" url="">
<link match="/lasdata/grids/grid-lon-lat-time-id-d91582b933" />
</va-id-d91582b933>
<ua-id-d91582b933 name="depth averaged water current speed along x-axis" units="meter/second" url="">
<link match="/lasdata/grids/grid-lon-lat-time-id-d91582b933" />
</ua-id-d91582b933>
</variables>
</id-d91582b933>
</datasets>
<grids>
<grid-lon-lat-id-d91582b933>
<link match="/lasdata/axes/lon-x-id-d91582b933"/>
<link match="/lasdata/axes/lat-y-id-d91582b933"/>
</grid-lon-lat-id-d91582b933>
<grid-lon-lat-time-id-d91582b933>
<link match="/lasdata/axes/lon-x-id-d91582b933"/>
<link match="/lasdata/axes/lat-y-id-d91582b933"/>
<link match="/lasdata/axes/time-t-id-d91582b933"/>
</grid-lon-lat-time-id-d91582b933>
</grids>
<!-- The X and Y ranges here are the ranges for the curvilinear
coordinates, not the coordinate axes of the variables -->
<axes>
<lon-x-id-d91582b933 type="x" units="degrees_east">
<arange start="102.8096" step="0.001333" size="1320"/>
</lon-x-id-d91582b933>
<lat-y-id-d91582b933 type="y" units="degrees_north">
<arange start="0.1909" step="0.001212" size="1482"/>
</lat-y-id-d91582b933>
<time-t-id-d91582b933 type="t" units="minute">
<v>23-JAN-2008 00:00</v>
<v>23-JAN-2008 00:15</v>
<v>23-JAN-2008 00:30</v>
<v>23-JAN-2008 00:45</v>
<v>23-JAN-2008 01:00</v>
<v>23-JAN-2008 01:15</v>
<v>23-JAN-2008 01:30</v>
<v>23-JAN-2008 01:45</v>
<v>23-JAN-2008 01:00</v>
<v>23-JAN-2008 02:15</v>
<v>23-JAN-2008 02:30</v>
<v>23-JAN-2008 02:45</v>
<v>23-JAN-2008 02:00</v>
<v>23-JAN-2008 03:15</v>
<v>23-JAN-2008 03:30</v>
<v>23-JAN-2008 03:45</v>
<v>23-JAN-2008 03:00</v>
<v>23-JAN-2008 04:15</v>
<v>23-JAN-2008 04:30</v>
<v>23-JAN-2008 04:45</v>
<v>23-JAN-2008 04:00</v>
<v>23-JAN-2008 05:15</v>
<v>23-JAN-2008 05:30</v>
<v>23-JAN-2008 05:45</v>
<v>23-JAN-2008 05:00</v>
<v>23-JAN-2008 06:15</v>
<v>23-JAN-2008 06:30</v>
<v>23-JAN-2008 06:45</v>
<v>23-JAN-2008 06:00</v>
<v>23-JAN-2008 07:15</v>
<v>23-JAN-2008 07:30</v>
<v>23-JAN-2008 07:45</v>
<v>23-JAN-2008 07:00</v>
<v>23-JAN-2008 08:15</v>
<v>23-JAN-2008 08:30</v>
<v>23-JAN-2008 08:45</v>
<v>23-JAN-2008 08:00</v>
<v>23-JAN-2008 09:15</v>
<v>23-JAN-2008 09:30</v>
<v>23-JAN-2008 09:45</v>
<v>23-JAN-2008 09:00</v>
<v>23-JAN-2008 10:15</v>
<v>23-JAN-2008 10:30</v>
<v>23-JAN-2008 10:45</v>
<v>23-JAN-2008 10:00</v>
<v>23-JAN-2008 11:15</v>
<v>23-JAN-2008 11:30</v>
<v>23-JAN-2008 11:45</v>
<v>23-JAN-2008 11:00</v>
<v>23-JAN-2008 12:15</v>
<v>23-JAN-2008 12:30</v>
<v>23-JAN-2008 12:45</v>
<v>23-JAN-2008 12:00</v>
<v>23-JAN-2008 13:15</v>
<v>23-JAN-2008 13:30</v>
<v>23-JAN-2008 13:45</v>
<v>23-JAN-2008 13:00</v>
<v>23-JAN-2008 14:15</v>
<v>23-JAN-2008 14:30</v>
<v>23-JAN-2008 14:45</v>
<v>23-JAN-2008 14:00</v>
<v>23-JAN-2008 15:15</v>
<v>23-JAN-2008 15:30</v>
<v>23-JAN-2008 15:45</v>
<v>23-JAN-2008 15:00</v>
<v>23-JAN-2008 16:15</v>
<v>23-JAN-2008 16:30</v>
<v>23-JAN-2008 16:45</v>
<v>23-JAN-2008 16:00</v>
<v>23-JAN-2008 17:15</v>
<v>23-JAN-2008 17:30</v>
<v>23-JAN-2008 17:45</v>
<v>23-JAN-2008 17:00</v>
<v>23-JAN-2008 18:15</v>
<v>23-JAN-2008 18:30</v>
<v>23-JAN-2008 18:45</v>
<v>23-JAN-2008 18:00</v>
<v>23-JAN-2008 19:15</v>
<v>23-JAN-2008 19:30</v>
<v>23-JAN-2008 19:45</v>
<v>23-JAN-2008 19:00</v>
<v>23-JAN-2008 20:15</v>
<v>23-JAN-2008 20:30</v>
<v>23-JAN-2008 20:45</v>
</time-t-id-d91582b933>
</axes>
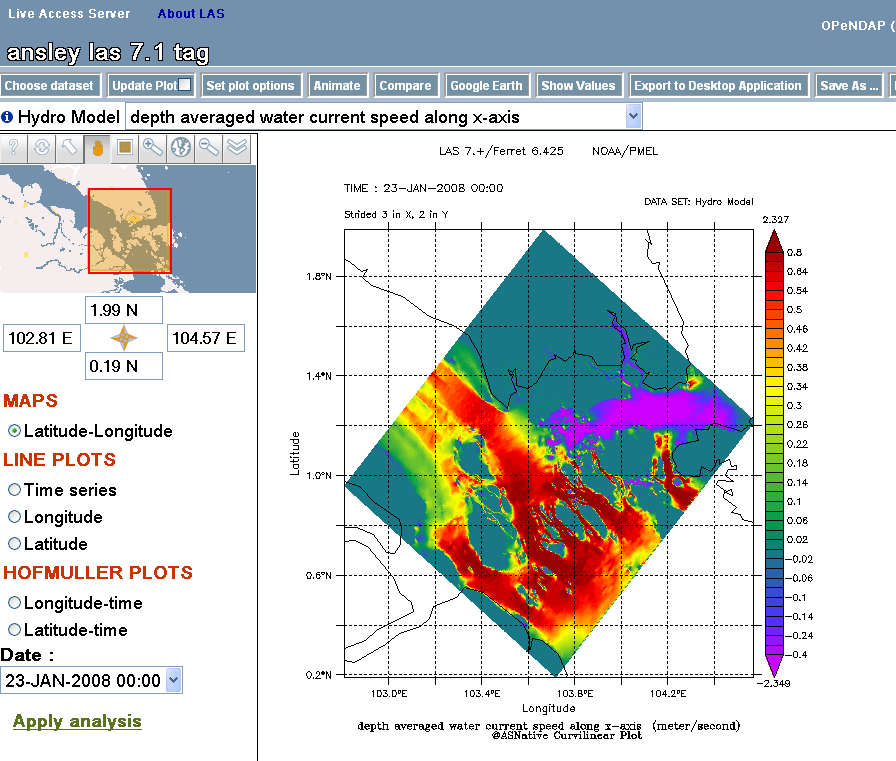
Here is a screenshot from my test server. This is LAS V7.1, which is due to be released within the next few weeks.
Ansley
Anton Yoel Buenavista wrote:Hello Ansley,
The values indicated in the curv_lon and curv_lat elements were taken in an interactive session with Ferret. See below for details.
yes? use hydro_avged_2D.nc
yes? stat lon
longitude(east)
X: 0.5 to 1320.5
Y: 0.5 to 1482.5
Z: N/A
T: N/A
DATA SET: ./hydro_avged_2D.nc
Total # of data points: 1956240 (1320*1482*1*1)
# flagged as bad data: 0
Minimum value: 102.81
Maximum value: 104.57
Mean value: 103.69 (unweighted average)
Standard deviation: 0.36026
yes? stat lat
latitude(north)
X: 0.5 to 1320.5
Y: 0.5 to 1482.5
Z: N/A
T: N/A
DATA SET: ./hydro_avged_2D.nc
Total # of data points: 1956240 (1320*1482*1*1)
# flagged as bad data: 0
Minimum value: 0.19093
Maximum value: 1.9865
Mean value: 1.0887 (unweighted average)
Standard deviation: 0.37039
The values in the axis definitions were also based from the data above. I have a thredds server set-up. You can view the file in question here: http://www.porl.nus.edu.sg:9080/thredds/catalog/las/TMH/catalog.html?dataset=las/TMH/hydro_avged_2D.nc
Regards,
Anton Yoel Buenavista