I have rigorously followed the instructions here: http://ferret.pmel.noaa.gov/LAS/documentation/installer-documentation/adding-curvilinear-data/configuring-by-hand/. I have also checked the values generated by the script in these elements in Ferret:
<curv_lon_min>102.81</curv_lon_min>
<curv_lat_min>0.19093</curv_lat_min>
<curv_lon_max>104.57</curv_lon_max>
<curv_lat_max>1.9865</curv_lat_max>
I have also tried removing these elements from the configuration file. However, the results remain the same. This error is still being returned:
**ERROR: dimensions improperly specified: must be a 2D region
SHADE/HLIM=-257.19:2051.06/LEVELS=(-inf)(-0.2,-8.0000E-02,0.04)(-8.0000E-02,0.1300,1.0000E-02)(0.1300,0.25,0.04)(inf)/PALETTE=rainbow/HLIM=-257.19:2051.06/VLIM=0.191:1777.391/TRIM/TITLE=" depth averaged current speed along y-axis (meter/second) Native Curvilinear Plot"/SET plot_var[d=1] , xcoord, ycoord
I have also confirmed that this error is being thrown in Ferret when I tried to recreate the values used in Ferret.
yes? LET/d=1 plot_var = va[d=1,T="23-JAN-2008 00:00":"23-JAN-2008 00:00",i=1:66,j=1:0]
yes? DEFINE VARIABLE/TITLE="Longitude"/units=degrees xcoord = lon[d=1,i=1:66,j=1:0]
yes? DEFINE VARIABLE/TITLE="Latitude"/units=degrees ycoord = lat[d=1,i=1:1320,j=1:1482]
yes? SHADE/HLIM=-257.19:1061.81/LEVELS=(-inf)(-0.2000,-8.0000E-02,0.04)(-8.0000E-02,0.1200,1.0000E-02)(0.1200,0.24,0.04)(inf)/PALETTE=rainbow/HLIM=-257.19:1061.81/VLIM=0.191:1481.191/TRIM/TITLE=" depth averaged current speed along y-axis (meter/second) Native Curvilinear Plot"/SET plot_var[d=1] , xcoord, ycoord
**ERROR: dimensions improperly specified: must be a 2D region
I have tried placing other values when defining the plot_var, xcoord, and ycoord variables, yet the outcome remains the same. Basically, in Ferret, we are able to transform Fig. A into Fig. B, and would like the same result as Fig. B to be displayed in LAS. Attached below are the images.
I would like to seek your advice on this. Thank you for all your help. It is greatly appreciated!
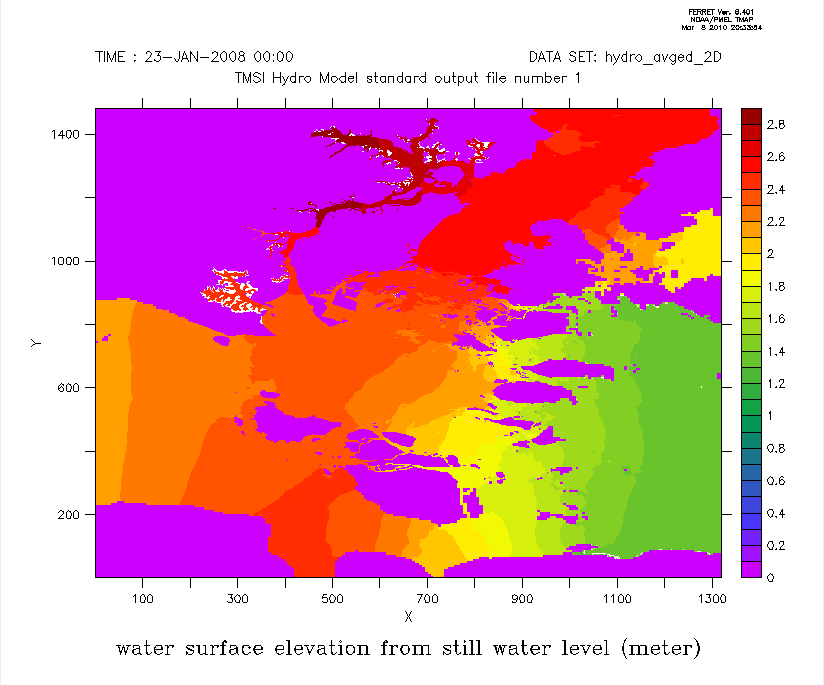
Fig. A
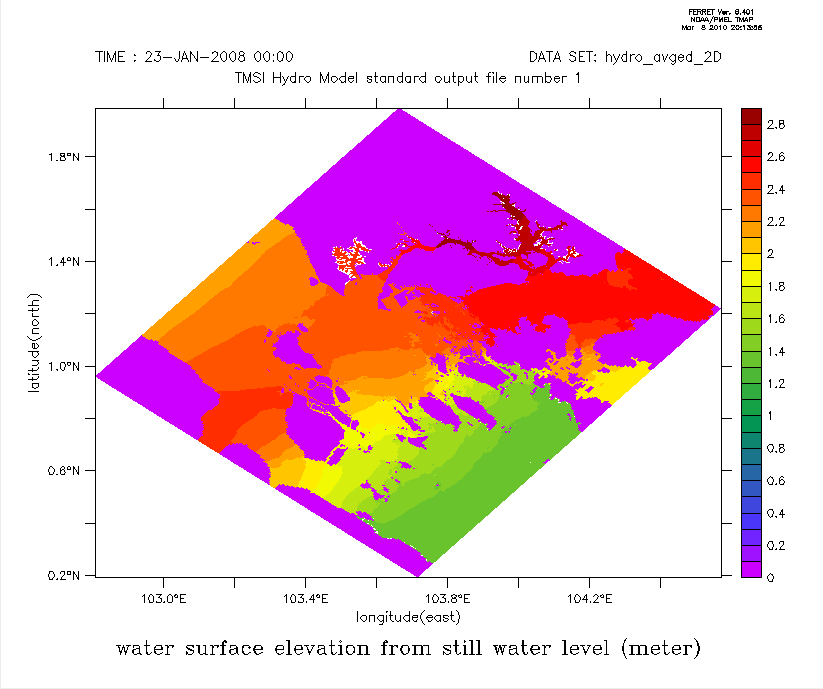
Fig. B
Regards,
Anton Yoel Buenavista
-------- Original Message --------
Subject: Re: [las_users] Using ferret scripts in LAS
From: Ansley Manke <Ansley.B.Manke@xxxxxxxx>
To: Buenavista Anton Yoel Dioquino <ay.buenavista@xxxxxxxxxx>
Date: Friday, 5 March, 2010 1:32:37 AM
Hi Anton,
The range of longitudes and latitudes in
<curv_lon_min>102.81</curv_lon_min>
<curv_lat_min>0.19093</curv_lat_min>
<curv_lon_max>104.57</curv_lon_max>
<curv_lat_max>1.9865</curv_lat_max>
throughout your xml file look incorrect. Did you use addXML to generate this? If so, it looks as if that hasn't worked well for this particular grid. Please see if you can work through the "configuring by hand" directions in the documentation.
http://ferret.pmel.noaa.gov/LAS/documentation/installer-documentation/adding-curvilinear-data/configuring-by-hand/
Anton Yoel Buenavista wrote:Hi Ansley,
Thanks again for the tips. I have, however, already tried what is written there. LAS returns this error when trying to display the plot:
Cached data cleared from memory
**ERROR: dimensions improperly specified: must be a 2D region
SHADE/HLIM=-257.19:2051.06/LEVELS=(-inf)(-0.2,-8.0000E-02,0.04)(-8.0000E-02,0.1300,1.0000E-02)(0.1300,0.25,0.04)(inf)/PALETTE=rainbow/HLIM=-257.19:2051.06/VLIM=0.191:1777.391/TRIM/TITLE=" depth averaged current speed along y-axis (meter/second) Native Curvilinear Plot"/SET plot_var[d=1] , xcoord, ycoord
So I was wondering if there are other ways to go about this. I have attached my XML file below for reference.
You've been a great help! Thanks for helping me out on this.
----- start of XML -----
<datasets>
<id-d91582b933 name="Hydro Model" url="">
<variables>
<h-id-d91582b933 name="distance from still water level to sea bed" units="meter" url="">
<link match="/lasdata/grids/grid-lon-lat-id-d91582b933" />
<properties>
<ferret>
<curv_lon_min>102.81</curv_lon_min>
<curv_lat_min>0.19093</curv_lat_min>
<curv_lon_max>104.57</curv_lon_max>
<curv_lat_max>1.9865</curv_lat_max>
</ferret>
</properties>
</h-id-d91582b933>
<mask-id-d91582b933 name="computational mask. 1 is a computational cell, 0 is a land cell." units="none" url="">
<link match="/lasdata/grids/grid-lon-lat-id-d91582b933" />
<properties>
<ferret>
<curv_lon_min>102.81</curv_lon_min>
<curv_lat_min>0.19093</curv_lat_min>
<curv_lon_max>104.57</curv_lon_max>
<curv_lat_max>1.9865</curv_lat_max>
</ferret>
</properties>
</mask-id-d91582b933>
<e-id-d91582b933 name="water surface elevation from still water level" units="meter" url="">
<link match="/lasdata/grids/grid-lon-lat-time-id-d91582b933" />
<properties>
<ferret>
<curv_lon_min>102.81</curv_lon_min>
<curv_lat_min>0.19093</curv_lat_min>
<curvi_coord_lon>lon</curvi_coord_lon>
<curvi_coord_lat>lat</curvi_coord_lat>
<curv_lon_max>104.57</curv_lon_max>
<curv_lat_max>1.9865</curv_lat_max>
<lon_modulo>0</lon_modulo>
</ferret>
</properties>
</e-id-d91582b933>
<va-id-d91582b933 name="depth averaged current speed along y-axis" units="meter/second" url="">
<link match="/lasdata/grids/grid-lon-lat-time-id-d91582b933" />
<properties>
<ferret>
<curv_lon_min>102.81</curv_lon_min>
<curv_lat_min>0.19093</curv_lat_min>
<curvi_coord_lon>lon</curvi_coord_lon>
<curvi_coord_lat>lat</curvi_coord_lat>
<curv_lon_max>104.57</curv_lon_max>
<curv_lat_max>1.9865</curv_lat_max>
<lon_modulo>0</lon_modulo>
</ferret>
</properties>
</va-id-d91582b933>
<ua-id-d91582b933 name="depth averaged water current speed along x-axis" units="meter/second" url="">
<link match="/lasdata/grids/grid-lon-lat-time-id-d91582b933" />
<properties>
<ferret>
</ferret>
<curv_lon_min>102.81</curv_lon_min>
<curv_lat_min>0.19093</curv_lat_min>
<curvi_coord_lon>lon</curvi_coord_lon>
<curvi_coord_lat>lat</curvi_coord_lat>
<curv_lon_max>104.57</curv_lon_max>
<curv_lat_max>1.9865</curv_lat_max>
<lon_modulo>0</lon_modulo>
</properties>
</ua-id-d91582b933>
</variables>
</id-d91582b933>
</datasets>
<grids>
<grid-lon-lat-id-d91582b933>
<link match="/lasdata/axes/lon-x-id-d91582b933" />
<link match="/lasdata/axes/lat-y-id-d91582b933" />
</grid-lon-lat-id-d91582b933>
<grid-lon-lat-time-id-d91582b933>
<link match="/lasdata/axes/lon-x-id-d91582b933" />
<link match="/lasdata/axes/lat-y-id-d91582b933" />
<link match="/lasdata/axes/time-t-id-d91582b933" />
</grid-lon-lat-time-id-d91582b933>
</grids>
<axes>
<lon-x-id-d91582b933 type="x" units="degrees_east">
<arange start="102.8096" size="1320" step="1.75" />
</lon-x-id-d91582b933>
<lat-y-id-d91582b933 type="y" units="degrees_north">
<arange start="0.1909" size="1482" step="1.2" />
</lat-y-id-d91582b933>
<time-t-id-d91582b933 type="t" units="minute">
<v>23-JAN-2008 00:00</v>
<v>23-JAN-2008 00:15</v>
<v>23-JAN-2008 00:30</v>
<v>23-JAN-2008 00:45</v>
<v>23-JAN-2008 01:00</v>
<v>23-JAN-2008 01:15</v>
<v>23-JAN-2008 01:30</v>
<v>23-JAN-2008 01:45</v>
<v>23-JAN-2008 01:00</v>
<v>23-JAN-2008 02:15</v>
<v>23-JAN-2008 02:30</v>
<v>23-JAN-2008 02:45</v>
<v>23-JAN-2008 02:00</v>
<v>23-JAN-2008 03:15</v>
<v>23-JAN-2008 03:30</v>
<v>23-JAN-2008 03:45</v>
<v>23-JAN-2008 03:00</v>
<v>23-JAN-2008 04:15</v>
<v>23-JAN-2008 04:30</v>
<v>23-JAN-2008 04:45</v>
<v>23-JAN-2008 04:00</v>
<v>23-JAN-2008 05:15</v>
<v>23-JAN-2008 05:30</v>
<v>23-JAN-2008 05:45</v>
<v>23-JAN-2008 05:00</v>
<v>23-JAN-2008 06:15</v>
<v>23-JAN-2008 06:30</v>
<v>23-JAN-2008 06:45</v>
<v>23-JAN-2008 06:00</v>
<v>23-JAN-2008 07:15</v>
<v>23-JAN-2008 07:30</v>
<v>23-JAN-2008 07:45</v>
<v>23-JAN-2008 07:00</v>
<v>23-JAN-2008 08:15</v>
<v>23-JAN-2008 08:30</v>
<v>23-JAN-2008 08:45</v>
<v>23-JAN-2008 08:00</v>
<v>23-JAN-2008 09:15</v>
<v>23-JAN-2008 09:30</v>
<v>23-JAN-2008 09:45</v>
<v>23-JAN-2008 09:00</v>
<v>23-JAN-2008 10:15</v>
<v>23-JAN-2008 10:30</v>
<v>23-JAN-2008 10:45</v>
<v>23-JAN-2008 10:00</v>
<v>23-JAN-2008 11:15</v>
<v>23-JAN-2008 11:30</v>
<v>23-JAN-2008 11:45</v>
<v>23-JAN-2008 11:00</v>
<v>23-JAN-2008 12:15</v>
<v>23-JAN-2008 12:30</v>
<v>23-JAN-2008 12:45</v>
<v>23-JAN-2008 12:00</v>
<v>23-JAN-2008 13:15</v>
<v>23-JAN-2008 13:30</v>
<v>23-JAN-2008 13:45</v>
<v>23-JAN-2008 13:00</v>
<v>23-JAN-2008 14:15</v>
<v>23-JAN-2008 14:30</v>
<v>23-JAN-2008 14:45</v>
<v>23-JAN-2008 14:00</v>
<v>23-JAN-2008 15:15</v>
<v>23-JAN-2008 15:30</v>
<v>23-JAN-2008 15:45</v>
<v>23-JAN-2008 15:00</v>
<v>23-JAN-2008 16:15</v>
<v>23-JAN-2008 16:30</v>
<v>23-JAN-2008 16:45</v>
<v>23-JAN-2008 16:00</v>
<v>23-JAN-2008 17:15</v>
<v>23-JAN-2008 17:30</v>
<v>23-JAN-2008 17:45</v>
<v>23-JAN-2008 17:00</v>
<v>23-JAN-2008 18:15</v>
<v>23-JAN-2008 18:30</v>
<v>23-JAN-2008 18:45</v>
<v>23-JAN-2008 18:00</v>
<v>23-JAN-2008 19:15</v>
<v>23-JAN-2008 19:30</v>
<v>23-JAN-2008 19:45</v>
<v>23-JAN-2008 19:00</v>
<v>23-JAN-2008 20:15</v>
<v>23-JAN-2008 20:30</v>
<v>23-JAN-2008 20:45</v>
</time-t-id-d91582b933>
</axes>
----- end of XML -----
Regards,
Anton Yoel Buenavista
-------- Original Message --------
Subject: Re: [las_users] Using ferret scripts in LAS
From: Ansley Manke <Ansley.B.Manke@xxxxxxxx>
To: Buenavista Anton Yoel Dioquino <ay.buenavista@xxxxxxxxxx>
Cc: "las_users@xxxxxxxx" <oar.pmel.las_users@xxxxxxxx>
Date: Thursday, 4 March, 2010 2:19:45 AM
Hi Anton,
LAS already has what you need to work with data on curvilinear grids. In the LAS Installer Documentation, http://ferret.pmel.noaa.gov/LAS/documentation/installer-documentation, please look at "Adding Curvilinear Data". You will put some extra bits in the xml configuration for the dataset which tell the Ferret scripts that are included with LAS that this is curvilinear data, and the names of the longitude and latitude coordinate variables. Then the scripts will take that data and make plots with the 3-argument Ferret plot calls, or subsets of data including the curvilinear coordinates.
Ansley
Anton Yoel Buenavista wrote:Hello everyone,
I would like to know how to use Ferret scripts in LAS? For example for a curvilinear grid, this Ferret line will be executed:
yes? fill/L=<time> e, lon, lat
Where <time> is a certain time in the grid depending on the choice of the user from the date dropdown menu in the LAS interface. I have read about init scripts, however I'm still unsure as to how to retrieve values from the data set variables.
Your help is greatly appreciated!