I just followed your instructions to have a quick look. Only reporting here that I was unable to reproduce your error report. Screen snapshots below using Firefox 3.0.5. What browser are you using?
- Steve
dbali@xxxxxxxxxxx wrote:
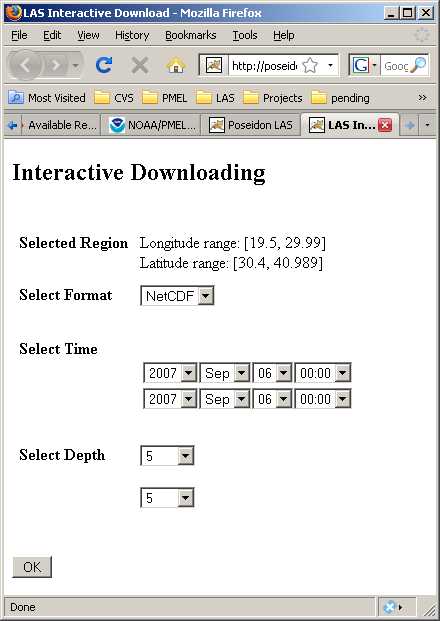
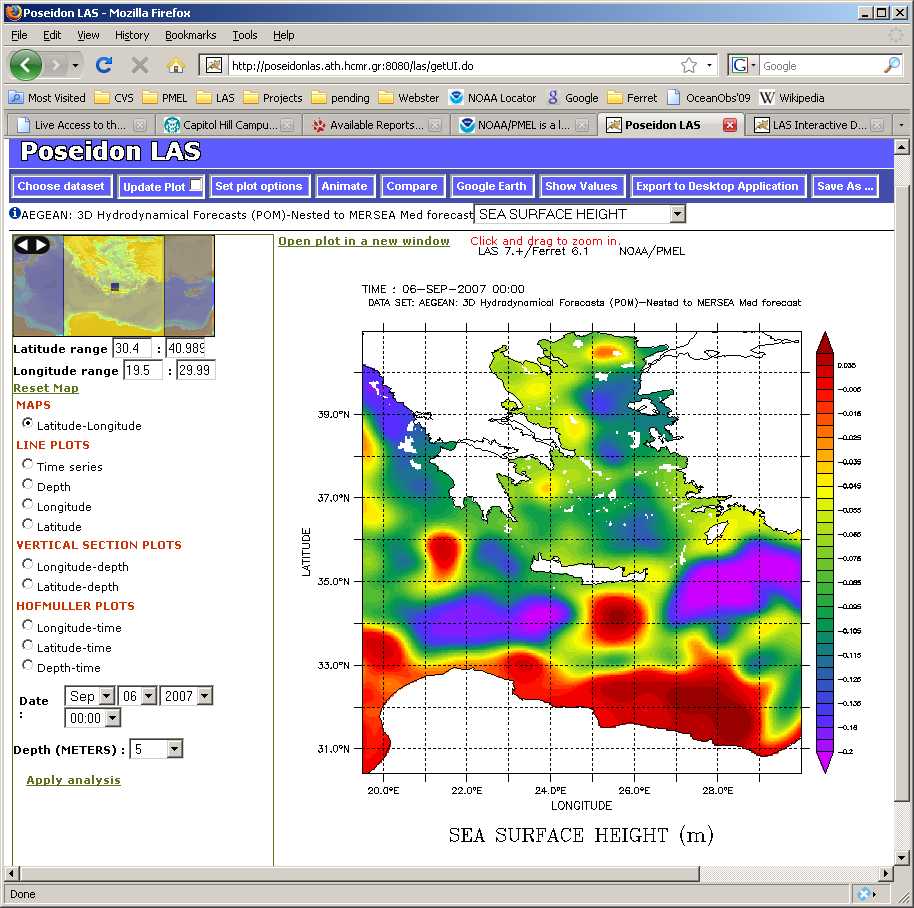
Hello again,Hello,I downloaded and installed the newest version (LAS v7.0.1) and the problem is now solved. :0) I have one new question though. Does the new version handle null values from NetCDF files differently than the previous ones? I am asking this as I have noticed that with the new version I sometimes get an error message when I request certain netCDF files and the error messages indicate that some values are null/missing.No. The way missing values are treated has not changed. Can you be more specific about this new problem? The best situation would be for you to send the URL for your LAS and instructions for what actions to take to reproduce the problem.Step one: http://poseidonlas.ath.hcmr.gr:8080/las Step two: Select the following dataset "AEGEAN: 3D Hydrodynamical Forecasts (POM)-Nested to MERSEA Med forecast" with Sea Surface Height and press "Save As...", enter OK (no evaluate axpression) and then select Netcdf Format. By following these, you should get an error pop-up window. The error messages include some missing values and also coords that dont match variable coords on axis LONGITUDE. So, since our files and data have remained the same the handling must have changed and we probably need to adjust them. :0) Once again, thank you for your time and patience with the matter. Dimitra Bali.RolandThank you very much for your assistance and your immadiate response in the matter. Kind Regards, Dimitra Bali. Roland Schweitzer wrote:Hello, We believe that this issue has been resolved in LAS v7.0.1 which is now available from the ftp site (ftp://ftp.pmel.noaa.gov/pub/las/las.v7.0.1.tar.gz). This is the only change for this release. Please let us know whether or not it resolves your problem. Thanks, Roland dbali@xxxxxxxxxxx wrote:Hello again, I tried the new version of LAS instead of the beta release but the problems I was discribing still remain. Any ideas on how to get round to it, would be most appreciated. Thanks in advance, Dimitra BaliDimitra Bali, It looks like you are running the Beta version of v7.0 instead of the latest release. There is a new tar file (ftp://ftp.pmel.noaa.gov/pub/las/las.v7.0.tar.gz) which has the latest software. The new version has many bug fixes and enhancements. When you have a chance, please try installing the latest and we'll go from there. Thanks, Roland Dimitra Bali wrote:Hello to everyone, I have installed LAS v7.0 and it is available if someone wishes to have a look at: *MailScanner has detected a possible fraud attempt from "poseidonlas.ath.hcmr.gr80" claiming to be* http://poseidonlas.ath.hcmr.gr:8080/las/ I have managed to figured out some problems that have occured during the installation and set-up but I am currently stuck with two small issues: 1. Whenever I try to select "Time series", "Longtitude" or "Depth" for any of my datasets I get a wrong colour plot. If for example I select an area or point with a stable Latitude of 36,738 I get a colour plot with a stable Latitude of 55,1. The weird thing is that all the other formats work fine. If for the same area I request an ASCII file, NetCDF, Table of Values etc I get the correct data. The only thing that is wrong is the colour plot. Also, the only case were the colour plot works fine is at the Maps section. By trying a few point on the map, I figured out that the "leap" in Latitude that appears to be happening is that the difference in the Latitude I request and the Latitude I get, is a number that always seems to be multiplied by 1.5 2. If I request the dataset "Europe: Weather forecast" (with any variable) and select Latitude-Longtitude in "MAPS" I get a colout plot which is correct but the top and bottom borders seem to be reversed for some reason. Thank you in advance for any ideas, Dimitra Bali.-- This message has been scanned for viruses and dangerous content by MailScanner, and is believed to be clean.-- This message has been scanned for viruses and dangerous content by MailScanner, and is believed to be clean.
--
Steve Hankin, NOAA/PMEL -- Steven.C.Hankin@xxxxxxxx
7600 Sand Point Way NE, Seattle, WA 98115-0070
ph. (206) 526-6080, FAX (206) 526-6744

"The only thing necessary for the triumph of evil is for good men
to do nothing." -- Edmund Burke