Ryo,
How strange. I tested with classic-Ferret and it does this too, so it's not a pyferret thing and not dependent on the system. After your script runs, if you do this:
yes? ppl list labels
it lists the location and size of the labels. Removing the clutter from that output, and making the sizes bold in the listing, you can see that the sizes are small then larger then somewhat smaller again as the script is called over and over. These are PPLUS "moveable" labels so their size should be 0.12
XPOS YPOS HGT ROT UNITS
LAB 1 6.000E-01 5.750E+00 0.060 0 SYSTEM y=0
LAB 2 6.000E-01 5.550E+00 0.060 0 SYSTEM y=5
LAB 3 6.000E-01 5.350E+00 0.060 0 SYSTEM y=10
LAB 4 6.000E-01 5.150E+00 0.120 0 SYSTEM y=15
LAB 5 6.000E-01 4.950E+00 0.120 0 SYSTEM y=20
LAB 6 6.000E-01 4.750E+00 0.102 0 SYSTEM y=25I'll see if I can see what's going on, or maybe update that script.
Ansley
On 8/24/2022 9:25 AM, Ryo Furue wrote:
Dear Ferret users,
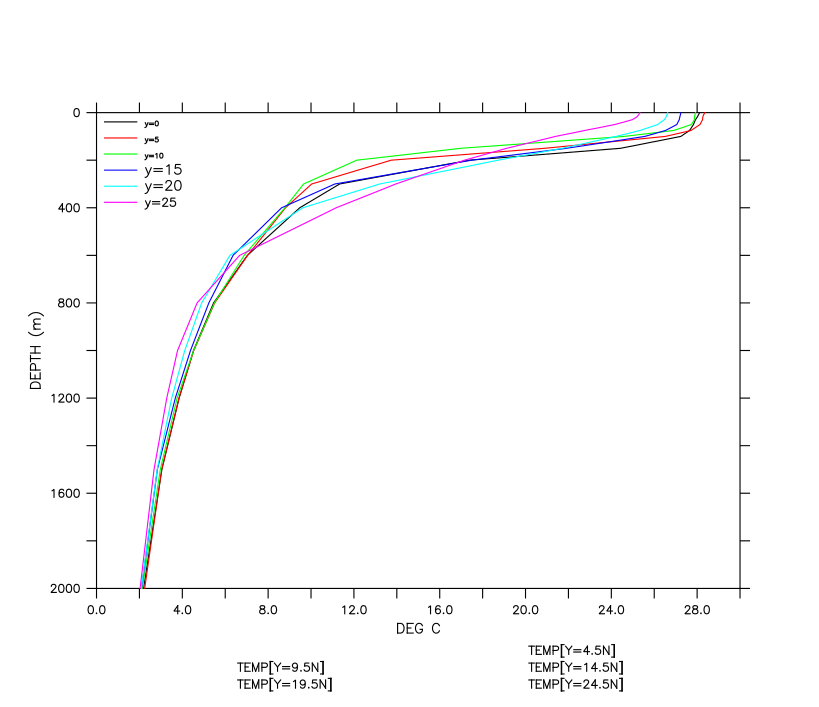
I've found that the font size changes after the 3rd element of the legend as in the image below. This is the first time for me to use the legend script and I know very little about it. Have you seen this problem before? Below I paste the script that generated the image.
macOS 12.5.1PyFerret v7.63 (optimized)
Darwin 19.6.0 - 10/13/20
Best regards,
Ryo-----set data levitus_climatology
set region/x=180
plot/vlimits=0:2000/set\
temp[y=0], temp[y=5], temp[y=10],\
temp[y=15], temp[y=20], temp[y=25]
go legend 1 "y=0"
go legend 2 "y=5"
go legend 3 "y=10"
go legend 4 "y=15"
go legend 5 "y=20"
go legend 6 "y=25"
ppl plot
frame/file=tmp.png