My apologies; something went wrong with the images I attached.
Here are two more. Here I have used the coarser etopo120 dataset
and I didn't make the call to mp_graticule which obscures what we
are looking at. Otherwise the script is the same.
Hi Grainne,
Here's an example that shows the kind of slice that I think you're seeing.
use etopo60
set region/y=45:90
go mp_stereographic_north
set grid rose
go mp_aspect
shade/noax/nolab/pal=land_sea/lev=c rose, x_page, y_page
go mp_land
go mp_graticule
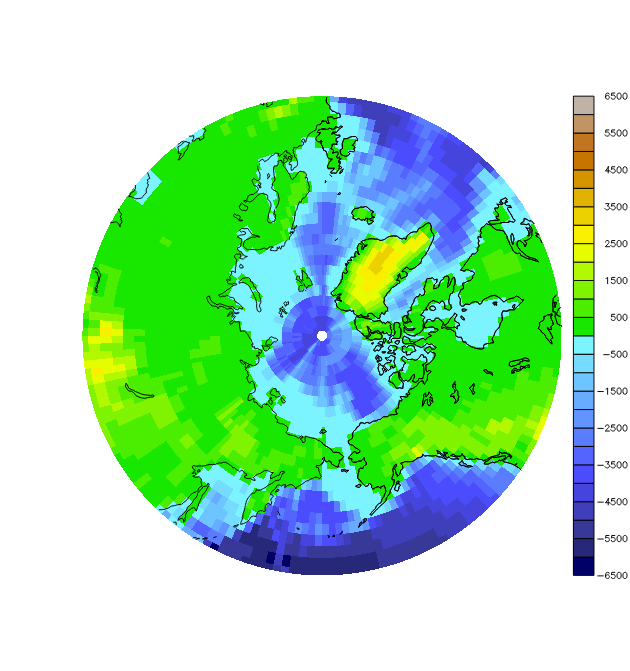
frame/file=mp_stereographic_wedge.pngThis happens because the color fill of the SHADE plot is starting with the first grid point and ending at the last grid point, but the lower half of the first grid cell and the upper half of the last grid cell are not filled in.
To work around this, set a region in X that's at least a grid-cell larger than the 360-degree range of the grid. For this dataset, the grid cell size is 1 degree, so try,
use etopo60
set region/y=45:90/x=-1:361
go mp_stereographic_north
set grid rose
go mp_aspect
shade/noax/nolab/pal=land_sea/lev=c rose, x_page, y_page
go mp_land
go mp_graticule
frame/file=mp_stereographic_no_wedge.png
-Ansley
On 7/8/2022 7:22 AM, Grainne O'Neill wrote:
Hello,
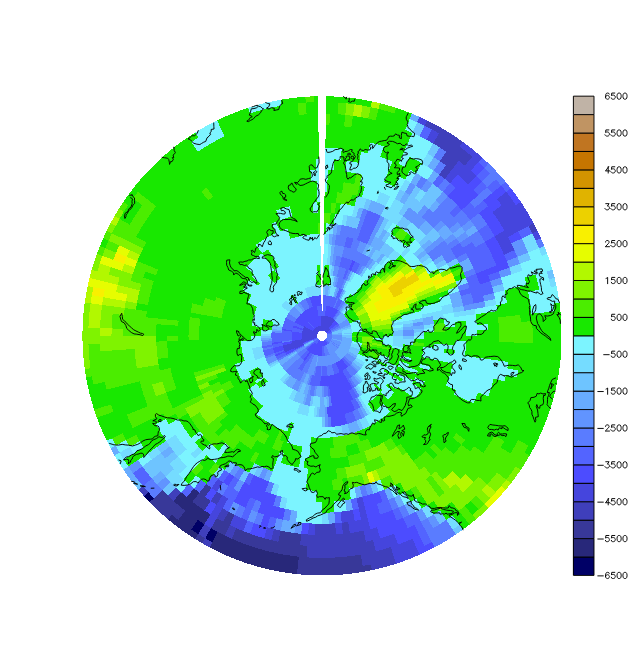
I am creating a polar stereographic map of my data, however it is leaving an empty gap on the map where 0 and 360 meet. I've attached an image of my map with the problem. You can't tell in this specific map but the empty section extends all the way to the pole like a pizza slice. Here is my script:
use "../maxmin_prec_GFDL.nc"
set region/Y=45:90
go mp_stereographic_north 0 90
set grid GIU1
go mp_aspect
shade/NOAXES/NOLAB/pal=blue2red/lev=(-inf)(-1500,1500,100)(inf) lo_hi[d=1], x_page, y_page
go mp_land
go mp_graticule
My ferret version info: FERRET v6.842 ; Linux 2.6.32-279.19.1.el6.x86_64 64-bit - 02/01/13
Thank you!
Attachment:
mp_stereographic_wedge.png
Description: PNG image
Attachment:
mp_stereographic_no_wedge.png
Description: PNG image