[Thread Prev][Thread Next][Index]
Re: [ferret_users] Labeling Dates in Shaded Plot
- To: ferret_users@xxxxxxxx
- Subject: Re: [ferret_users] Labeling Dates in Shaded Plot
- From: Ansley Manke <a.c.manke@xxxxxxxxx>
- Date: Wed, 8 Dec 2021 19:22:46 -0800
- Arc-authentication-results: i=4; mx.google.com; dkim=pass header.i=@gmail.com header.s=20210112 header.b=iweU2pq0; arc=pass (i=2 dkim=pass dkdomain=gmail.com); spf=pass (google.com: domain of a.c.manke@xxxxxxxxx designates 209.85.222.200 as permitted sender) smtp.mailfrom=a.c.manke@xxxxxxxxx
- Arc-authentication-results: i=3; mx.google.com; dkim=pass header.i=@gmail.com header.s=20210112 header.b=iweU2pq0; arc=pass (i=2 dkim=pass dkdomain=gmail.com); spf=pass (google.com: domain of a.c.manke@xxxxxxxxx designates 209.85.222.200 as permitted sender) smtp.mailfrom=a.c.manke@xxxxxxxxx
- Arc-authentication-results: i=2; mx.google.com; dkim=pass header.i=@gmail.com header.s=20210112 header.b=iweU2pq0; arc=pass (i=1 spf=pass spfdomain=gmail.com dkim=pass dkdomain=gmail.com dmarc=pass fromdomain=gmail.com); spf=softfail (google.com: domain of transitioning a.c.manke@xxxxxxxxx does not designate 65.153.203.166 as permitted sender) smtp.mailfrom=a.c.manke@xxxxxxxxx
- Arc-authentication-results: i=1; mx.google.com; dkim=pass header.i=@gmail.com header.s=20210112 header.b=iweU2pq0; spf=pass (google.com: domain of a.c.manke@xxxxxxxxx designates 209.85.220.41 as permitted sender) smtp.mailfrom=a.c.manke@xxxxxxxxx; dmarc=pass (p=NONE sp=QUARANTINE dis=NONE) header.from=gmail.com
- Arc-message-signature: i=4; a=rsa-sha256; c=relaxed/relaxed; d=google.com; s=arc-20160816; h=list-archive:list-help:list-post:list-id:mailing-list:precedence :in-reply-to:content-language:references:to:subject:from:user-agent :mime-version:date:message-id:sender:dkim-signature; bh=Q/sdeJHCaCqlw21ZX6Pfc53HoojA7PdTVhaxuFftLgo=; b=bLIIQLleawY1F3sxjtfEMgN2fnJIULkM0f1O4RcJ1IPsVxS6Pn9bfXgfWJblSn2hX0 epBDt2gkczWLFr5kkIo6YKAzZRP3cmk1Hu6CsZKebxAhumCdYH5tDDEfsu8q7YHqsGa9 EOWd9cc6SR3NC2BiH7SC8oRAwrkVUy5WeHL6xO0qeCSZXbQf8EjKjBpVgFjxFYstzt9l 1lyXyJY34CmuZnv0RqvpJbF00bOSaQAQh2c8c+Ocl7zLxr1NQ+uHO4baWx8X/NG6ZQqx Ggj6I+Fh+q9RewzDlK2xwoStqamwh7rHCiYUyG3tkCIaYaGvjYc64oyVtQtJyEJ/R2gW oHtw==
- Arc-message-signature: i=3; a=rsa-sha256; c=relaxed/relaxed; d=google.com; s=arc-20160816; h=in-reply-to:content-language:references:to:subject:from:user-agent :mime-version:date:message-id:dkim-signature; bh=Q/sdeJHCaCqlw21ZX6Pfc53HoojA7PdTVhaxuFftLgo=; b=WNcgO8xaOvYUspLEZt5ZWDuRiGsz0OevF1Fb/Bfg8j/zCiNcJpfqmIcw7PYmBAf62C bI1LqW3PKpIgRrrSoYoCGm+WPUXzo4vV+65cbGGejRwiRTEKbzKjsQMQKMcTaeyWx+EV 0RUrxW5MNZB+6KX6OQaRuEdx5J+u82zNFnuZDL5vUj5kpkE0KxRNo4fzrgAUqqEOkyTr JZRyEpBw7pDUC3R6Rrvngr4yzYJ04fuGMEaqGyyDBZb10SZ4eCX8C6t2EkRQ4IJNqYgq AcM4B/BgX5Wpiy2zCRzSpoT+i03aPVtRMStmHI599PZ79ZRFKHxNmOWIHXTnCDA0HKaw q3Lw==
- Arc-message-signature: i=2; a=rsa-sha256; c=relaxed/relaxed; d=google.com; s=arc-20160816; h=in-reply-to:content-language:references:to:subject:from:user-agent :mime-version:date:message-id:dkim-signature; bh=Q/sdeJHCaCqlw21ZX6Pfc53HoojA7PdTVhaxuFftLgo=; b=oycf12L5TTAGulawKtGPW5fmBThkTGghLMWKDc32mErk2qmZrzR1htOnIGFmZ4o+4Y 5yaMY7XlS5lWdGSQSGaG3OSMqz6tUemEj7nzgdL4A5bn1q8Xd/f1/UAOs4aTlTVNXoKc do0lCI/JtNK/i2PZPHeb+cPwvsvZUAZGKPiZc4kXsXpQvcVOgkEc3caknxithUi5cCwq 8d80BLinSM8rnmJyXtqHIH+bQrTYozgj0btL3AgCvfdlKpbDqXrzLWw5SkgJ+EIhpnnR PYQqXvAB9++JthIOlHfaYpneSWRJ1/8/pA3loVIcP9r289nvm1jkORUqIAfv00CUL7mh xEFQ==
- Arc-message-signature: i=1; a=rsa-sha256; c=relaxed/relaxed; d=google.com; s=arc-20160816; h=in-reply-to:content-language:references:to:subject:from:user-agent :mime-version:date:message-id:dkim-signature; bh=Q/sdeJHCaCqlw21ZX6Pfc53HoojA7PdTVhaxuFftLgo=; b=Y5KJj3gY8tRJ+FacFN2hxFRH6bJct0E9tsq/mGu7pDODQFtdnaK85pHgez3AexKW9g Gjd9kL3gyyZUeGoCKyyA2JRyQ18qP8EUzHhEU2n4u+0lATl2p38CjUqcYrxXqve29Vk+ fllr8dqOzbc98TKA14oEDo1u3Ngl6pJKsF4/B5UHWc4sFZxRYOqy4FxU5Yp9f0g49SA9 qjO2SdFXIYpdKYfJD676eaVP/L9DI3KH+Aux5cpF77lR6IuiHejFHw43UgBwKZ6daNS9 DOrDKhVf89CgBoL8yP84y08rOc7QZuEYZAHeEKoaD7DFa9JgvgLQrfFLxQ/S6SYgsIlv SvLg==
- Arc-seal: i=4; a=rsa-sha256; t=1639020178; cv=pass; d=google.com; s=arc-20160816; b=xaLCSr365h12rRyDX0bMDbO7yfXZUXwbO1l1EIIx4TVS4WIQC9jAA+P55zuq/e1MM5 DsF7J9sFdbnFDQXwrjQo1S61rFkTsx+MQUZq1NicJ1lKc1nuE7Liot5fiSPapXXQK/0c HTQZgpvGvAkKybgkbEFcaJ2/OwPuk5znvlQMUeCB1sWUN5poCKMA/emeu/UR6xs8Tzqv ZWK8Je97S9iS8qp1LT6Ao+L5wRhEmhdtZMVAbgZtCyIDiJdeaA+lupTOcQiDX9Cqoilz ngG2oIGpMD0nwCGbY+ZFPmIdjVQb+sKLj+19ec+qz1gVkZt6wD9rSjjzLXrUxixJbbES gDGg==
- Arc-seal: i=3; a=rsa-sha256; t=1639020177; cv=pass; d=google.com; s=arc-20160816; b=XPx7eYfuJoDc6w87iqVyDaOdifq2OTYv/I9DdffgKLucvklyOq26nvMbJdJOre0KXY eG19o0OTJYuMwvuTO/FRb3CK0YwpjCi5IYajeTABYF/q1AwWTPr5FIzbrDgyH7yqfkKg CfVPopLcGoedZ8SEUAkyd9VsendtYcB+/42FgLipg/Yl0yc+iJeAlOopfeIuJyjGMHNY aw4B0X5A/6IgRxzvSl9TyV3uuMfKXq9qe0zkzTBt5K3+4yMheycekOb7hAPhwmkjxsQd 7o0TJMB3pM0f7U4WUZfO1S67H7zO4NEbyf0xwrpNKkXkL1ADEYqDsshRhalNoqNNcnSF PSLg==
- Arc-seal: i=2; a=rsa-sha256; t=1639020171; cv=pass; d=google.com; s=arc-20160816; b=E3KTeX8tiRjVfG+nzsm6iFTKrFr6weqylfFgE+c2i2AtHRzDKhiV7I42zSRYRGCo8S NgcnTVRXmX4gZYwxNosTlaq24oLI+yrIH4RVsXk6KUYRTF1O9wqd7hUNRpMSY8WkK42n nJzy7txV7QYymcYjwePgQuKHbwJlPWmvN0sjJJBciRbjbU04RUOrbr2YyN4FMoyDh0vf ZuKudFBOEWYx0k5V2pcTlqBflZgkntbYcYIdesl0mLJ0/1BofKEeE4Fvf4yN1nc36Uh/ Z64+AB/z5zPfD1zs9Y8j97CqseFSHkahK5wV9WkO8jjuY6Sd+qhBtbSTULCIXOQMquLe /j4A==
- Arc-seal: i=1; a=rsa-sha256; t=1639020168; cv=none; d=google.com; s=arc-20160816; b=ntuUU9FVxk2R8jcoqgVwgozk/RGF0vvxj+SOyKPybG0PEI/tLWDyXVeust2XfRrzK0 HE3D8iXL5jUpTK9V5eUgEzYWHrN78xLgR8oCizeiIwdtieiz9ITToyT2r+05SbLDDNWr ZJHV4s/6Co6Gt+6SLKs9RknkXEfCq1FPpRU+N20AzfZyIy0qfKBiJkMGYK36ZqpgHTt3 y9h/1jmu2RpFBlhm2ZOiE0A7gGDi1CTV808t2WjEY4+lcMV0tzXWnvub9T1g+xiPE5cx S4ibaGetf8u6yUv3JL9NqdZhbn5PATkrRcW0GC7HNATwuV/f6zAWqbEoqJPfMTD7XHvW udxg==
- Dkim-signature: v=1; a=rsa-sha256; c=relaxed/relaxed; d=noaa.gov; s=google; h=sender:message-id:date:mime-version:user-agent:from:subject:to :references:content-language:in-reply-to:x-original-sender :x-original-authentication-results:precedence:mailing-list:list-id :list-post:list-help:list-archive; bh=Q/sdeJHCaCqlw21ZX6Pfc53HoojA7PdTVhaxuFftLgo=; b=iDfuPlYKMZ3TGqn/OINOpJuhoNXM8SxyFZCtUiGBDHE80cKisspzHL7LV14NRb7Hqe BKuPA3VaxcdJVWNkhf+twY+L3GyCc6n6ocFQ8GlRZgGextLzjZuc/gmgjrXP/WeIZAdW qCDt7UgRV0iRFhMiwdMEI+/xcnd60HvPDPRCuoxH9A3g3DfTmnWnyohjIWrwGJV8jodB 2t9xereV65TDRINThmgetB8Qw7r23D4ZxoDlnjBXyJ657OsXK5OOOCYroao5n2TNPbHz ev8OLD0lOGPxkByqN7FyfSSNnRzbhqfUmkEmHUVzCP+xPyfOpOCsgQdv0ZXe4Tv86vhq Ylbg==
- In-reply-to: <CABugP48aktDeUBvq8g5ghu17cq6HOPiqvW0ksgwj7_0d8iMn-g@mail.gmail.com>
- List-archive: <https://groups.google.com/a/noaa.gov/group/ferret_users/>
- List-help: <https://support.google.com/a/noaa.gov/bin/topic.py?topic=25838>, <mailto:ferret_users+help@noaa.gov>
- List-id: <ferret_users.noaa.gov>
- List-post: <https://groups.google.com/a/noaa.gov/group/ferret_users/post>, <mailto:ferret_users@noaa.gov>
- Mailing-list: list ferret_users@xxxxxxxx; contact ferret_users+owners@xxxxxxxx
- References: <CABugP48aktDeUBvq8g5ghu17cq6HOPiqvW0ksgwj7_0d8iMn-g@mail.gmail.com>
- Sender: owner-ferret_users@xxxxxxxx
- User-agent: Mozilla/5.0 (Windows NT 10.0; Win64; x64; rv:91.0) Gecko/20100101 Thunderbird/91.3.2
Hi Hussen,
This is not a native capability of PyFerret. However there is a
script that is used for plots which color track data according to
time, so that a dataset which represents a set of ship tracks or
other trajectory data can be plotted, showing time along the
tracks. Here is a screenshot showing such a plot.
The script that is called to make the
labeled colorbar for this plot is "colorbar_datekey.jnl" and it
is included in the PyFerret distribution. With a little work it
can be used for a SHADE or FILL plot that shows time. Here is an
example
yes? go/help
color_datekey ! see the details about calling color_datekey.jnl
...
(The examples at the start of the
script could be run using the trajectory dataset currently
included in the Ferret Datasets distribution,
dsg_trajectory_example.nc. In that dataset the time coordinate
variable is named "time".)
The color_datekey.jnl script assumes we
are using DSG dataset, so a little more set-up is needed before it
can be used with a 2-D variable.
We need to
specify a 1-dimensional time variable in calling
color_datekey.jnl. This is a 1-dimensional list of the time data
being plotted. The time variable needs to have a units attribute
which is of the form "units since start-date", for instance "days
since 1-jan-2020". In a dsg file, the time coordinate variable
has an attribute called time_origin, so we also need to define
that attribute. Finally, the comments at the start of
color_datekey says the script may only be called when drawing an
overlay plot.
Here is an example that I was able to
create:
! Define a 2-dimensional variable
just for this example, with units of
! time in "days since 1-jan-2020". You will use your time variable, with
! its units defined using this form, and the units and origin
from your data.
DEFINE AXIS/X=20:30:0.5/UNITS=degrees_east
xaxis
DEFINE
AXIS/Y=-10:10:0.5/UNITS=degrees_north yaxis
LET/UNITS="days since 1-jan-2020" my_time =
10*RANDU(i[gx=xaxis]) + 15*RANDU(j[gy=yaxis])
! Define a viewport which leaves extra
space to the right of the plot for the date labels
DEFINE VIEWPORT/X=0:0.8/Y=0:1 xyview
SET VIEW xyview
! Define the 1-dimensonal list of time data
to send to the color_datekey.jnl script.
! Define the time_origin attribute.
LET/UNITS="days since 1-jan-2020" time_list
= TSEQUENCE(my_time)
DEFINE ATTRIBUTE time_list.time_origin =
"01-jan-2020"
! Draw the 2-dimensional plot. This will
be the underlay plot. We will re-draw it
! with the /overlay qualifier when making the date-labeled
color key.
SHADE/NOKEY my_time
! Now re-draw using /OVERLAY/SET and call
the color_datekey script
SHADE/OVER/KEY/SET my_time
GO color_datekey "v" time_list
PPL SHADE/OVER
Either SHADE or FILL will work.
Ansley
On 12/6/2021 10:49 AM, Hussen Seid
wrote:
Dear Ferreters,
I have a netcdf file containing the rainfall onset dates for
a specific rainfall season. The onset dates are calculated
using a different tool. I would like to produce the spatial
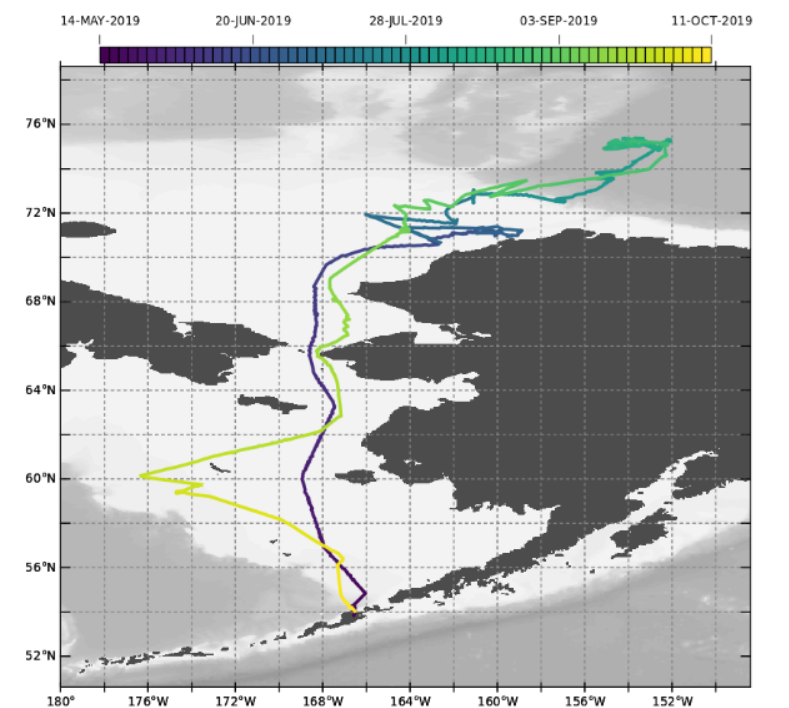
maps of the onset dates in pyferret (similar to the attached
map), but am having difficulties in labeling the dates in
the legend.
Does anyone know how this is done?
Thanks in advance
........................................................................................................................
|
![]()
|
Hussen Seid Endris
(PhD)
CLIMATE MODELING EXPERT
IGAD
Climate
Prediction and
Applications
Centre (ICPAC)
Ngong Town Kibiko A Road, Near KIHBT
P.O.Box
10304-00100, Nairobi,
Kenya
T: +254 792 532 851 Skype: hussen.seid1_1
Follow
us on Facebook | Twitter | Youtube | Website
![]()
|
........................................................................................................................
[Thread Prev][Thread Next][Index]
Contact Us
Dept of Commerce /
NOAA /
OAR /
PMEL /
Ferret
Privacy Policy | Disclaimer | Accessibility Statement