Dear Ferreters,
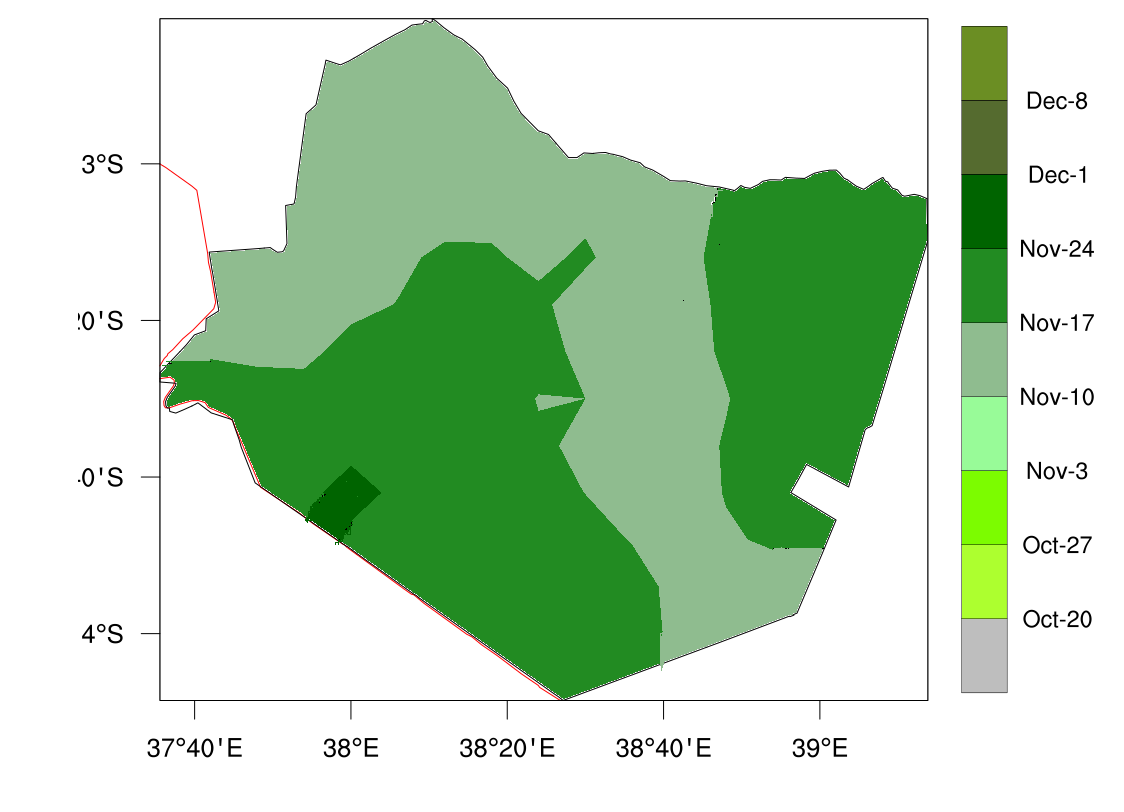
I have a netcdf file containing the rainfall onset dates for a specific rainfall season. The onset dates are calculated using a different tool. I would like to produce the spatial maps of the onset dates in pyferret (similar to the attached map), but am having difficulties in labeling the dates in the legend.
I have a netcdf file containing the rainfall onset dates for a specific rainfall season. The onset dates are calculated using a different tool. I would like to produce the spatial maps of the onset dates in pyferret (similar to the attached map), but am having difficulties in labeling the dates in the legend.
Does anyone know how this is done?
Thanks in advance
Hussen
........................................................................................................................
| Hussen Seid Endris (PhD) CLIMATE MODELING EXPERT IGAD Climate Prediction and Applications Centre (ICPAC) Ngong Town Kibiko A Road, Near KIHBT P.O.Box 10304-00100, Nairobi, Kenya T: +254 792 532 851 Skype: hussen.seid1_1 Follow us on Facebook | Twitter | Youtube | Website |
........................................................................................................................