|
Hi all,
I’m trying to make a plot with 2 time series, each on a separate Y axis (one on the left side and one on the right side of the plot). I’ve tried
left_axis_plot and right_axis_plot.
also tried multi_yaxis_plot1 and multi_yaxis_overlay. Nothing really works well as I can’t find the way to get the 2nd Y axis at the right side of my plot. It’s either on the left of the main axis (using “-“ for multi_yaxis_overlay),
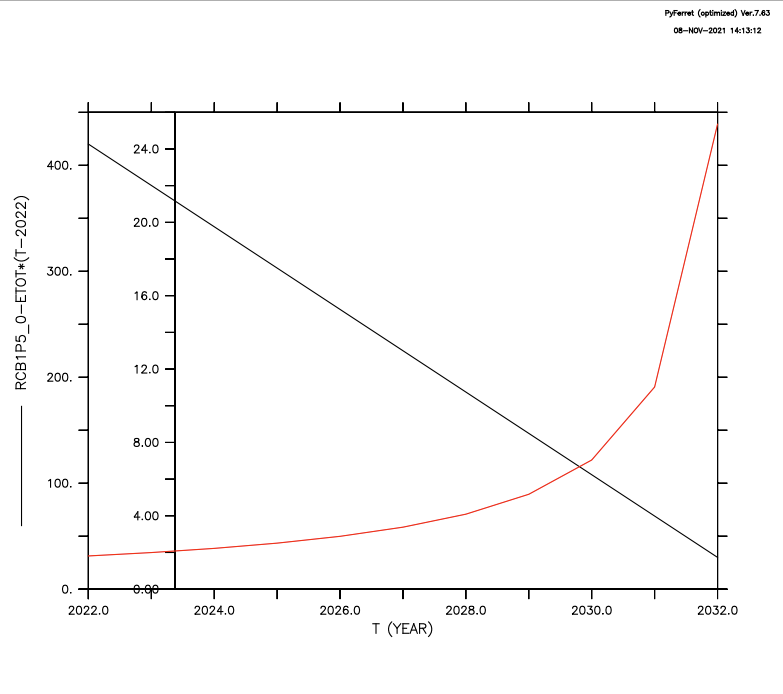
or it’s just at the right of the left plot, ie in the middle of the figure ! (“+” for multi_yaxis_overlay, see screenshot)
Also I don’t know how to control the format of the axis anymore (ppl xfor, yfor, etc…).
I can send my data but essentially, it’s two time series. For example:
DEFINE AXIS/T=2021:2030:1/UNIT=year tax DEFINE GRID/T=tax my_grid SET GRID my_grid Var1 = 500 - 50*(T-2020) Var2 = 25/(10-(T-2020)) Thanks for any help. Pierre Prof. Pierre Friedlingstein http://emps.exeter.ac.uk/mathematics/staff/pf229
|
Attachment:
Screenshot 2021-11-08 at 14.13.50.png
Description: Screenshot 2021-11-08 at 14.13.50.png