Hi Xiaoyu,
On Fri, Jul 23, 2021 at 7:35 AM Xiaoyu Bai <xbai1@xxxxxxxx> wrote:
I see! By the way, do you know how to fix the @DIN cannot be applied correctly after you subtract your data from @AVE?
let comp1=test-mean
let comp2=test-21.16
let bad_din=comp1[I=@DIN,J=@DIN]
let good_din=comp2[I=@DIN,J=@DIN]
It seems to me that what you see is normal (to be expected). Let "ave" be an area average and "din" be the corresponding area integral. Then
ave(q) = din(q) / A,
where A is the area of the integration and average. Therefore
din(q - ave(q)) = din(q) - A ave(q) = din(q) - din(q) = 0.
So, you expect zero for the answer. good_din is very large only because mean ≠ 21.16 ! If you replaced the definition of comp2 with
let comp2 = test - `mean`
then, "bad_din" and "good_din" are much closer.
So, why aren't they zero? Probably because you calculate the average and integral on I and J instead of x and y as in "x=0:360@DIN, y=90S:90N@DIN" but I'm not sure.
Regards,
Ryo
I need to calculate the mass transported by Hadley cells. So my v-wind must be zero when integrating through the whole column. Usually, it can be solved by subtracting the average value of v-wind. During my process of subtracting the average values, I found if you subtract the average value, pyferret does NOT treat your new values as "spatial data" (I don't know how to describe it). For example,set data coads_climatologylet test=SST[L=8] ! just a random monthlet mean=test[I=@AVE,J=@AVE]list mean
VARIABLE : TEST[I=@AVE,J=@AVE]
FILENAME : coads_climatology.cdf
FILEPATH : /home/xbai1/miniconda2/envs/FERRET/share/fer_dsets/data/
LONGITUDE: 20E to 20E(380)
LATITUDE : 90S to 90N
TIME : 16-AUG 07:23
21.16which means the average value is 21.16 Celsius. Then I do:let comp1=test-meanlet comp2=test-21.16let bad_din=comp1[I=@DIN,J=@DIN]let good_din=comp2[I=@DIN,J=@DIN]list bad_din, good_din
DATA SET: /home/xbai1/miniconda2/envs/FERRET/share/fer_dsets/data/coads_climatology.cdf
LONGITUDE: 20E to 20E(380)
LATITUDE: 90S to 90N
TIME: 16-AUG 07:23
Column 1: BAD_DIN is COMP1[I=@DIN,J=@DIN]
Column 2: GOOD_DIN is COMP2[I=@DIN,J=@DIN]
BAD_DIN GOOD_DIN
I / *: -91.65 -2.954E+11To me, the E+11 value makes more sense considering we are integrating over a large area. Earlier, we thought this problem was a bug in Show Grid and it was fixed. (https://www.pmel.noaa.gov/maillists/tmap/ferret_users/fu_2019/msg00495.html). However, this problem was not solved after the show grid bug was fixed:show grid comp1, comp2
GRID GSQ1
name axis # pts start end subset
COADSX LONGITUDE 180mr 21E 19E(379) full
COADSY LATITUDE 90 r 89S 89N full
normal Z
TIME TIME 12mr 16-JAN 06:00 16-DEC 01:20 1 pt
GRID GSQ1
name axis # pts start end subset
COADSX LONGITUDE 180mr 21E 19E(379) full
COADSY LATITUDE 90 r 89S 89N full
normal Z
TIME TIME 12mr 16-JAN 06:00 16-DEC 01:20 1 ptLooks like to me, the new value after subtracting @AVE was treated like pure numeric values. But it's not @SUM type of calculation.list comp1[I=@SUM,J=@SUM], comp2[I=@SUM,J=@SUM]
DATA SET: /home/xbai1/miniconda2/envs/FERRET/share/fer_dsets/data/coads_climatology.cdf
LONGITUDE: 20E to 20E(380) (XY summed)
LATITUDE: 90S to 90N (XY summed)
TIME: 16-AUG 07:23
Column 1: COMP1 is TEST-MEAN
Column 2: COMP2 is TEST-21.16
COMP1 COMP2
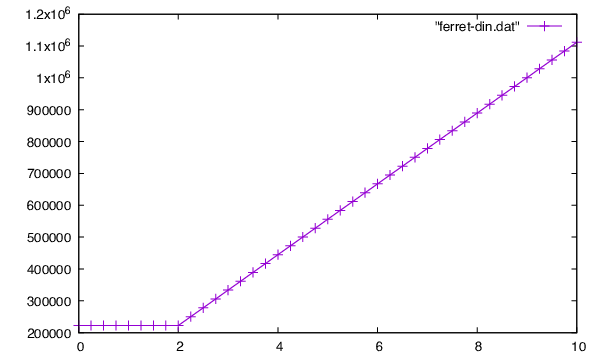
I / *: -17139. -17147.I am puzzled by this issue.Thank you very much and stay healthy,XiaoyuOn Tue, Jul 20, 2021 at 11:06 PM Ryo Furue <furue@xxxxxxxxxx> wrote:Hi Xiayu,On Wed, Jul 21, 2021 at 6:42 AM Xiaoyu Bai <xbai1@xxxxxxxx> wrote:I usually use at least two grids. My understanding is that @DDN [@DIN] needs to apply a weight, most of the time is the cosine effect. If there is only one grid, pyferret will possibly only consider the one grid's value only.Yes, but the point is that the weight is continuous. Suppose that our SST is defined at lat = 1°, 3°, 5°, . . . at an interval of 2° . Then,SST[y=0:yhi@DIN]is a continuous function of yhi. Below is a figure showing this function (when SST is uniformly 1). The horizontal axis of the plot is yhi. If you increase yhi slightly, the integral increases slightly because Ferret adjusts the weight.The problem is that Ferret seems to stop adjusting the weight when yhi < 2° as the figure shows. In particular, one would expect that SST[y=0:0@DIN] is zero.This can be a source of error when you use Ferret programmatically to calculate integrals. For example, I can imagine a calculation like thisrepeat/range=1:`iend`/name=ii (let yhi = curvey[i=`ii`]let xx = xvals[i=`ii`]list/append/nohead/file=integral.txt/format=(G0,1X,G0) xx, SST[i=`ii`, y=0:`yhi`@DIN])to calculate the integral of SST from the equator to a curve (x, curvey(x) ) as a function of x.Regards,Ryo-------------------------------------------------! --- script to generate the data for the plot below ---set data coads_climatology ! grid spacing is 2°let _ones_ = 1 + 0*y[gy=SST]repeat/range=0:40/name=yy (let yhi=`yy/4`; let val = ones[y=0:`yhi`@DIN]; say/quiet `yhi` `val`)Stay healthy,XiaoyuOn Thu, Jul 15, 2021 at 10:02 PM Ryo Furue <furue@xxxxxxxxxx> wrote:[Caution: Email from External Sender. Do not click or open links or attachments unless you know this sender.]
Dear Ferreters,Does @DIN have a minimum range? It seems that it stops shrinking when the integration range shrinks below the gridsize.For a test, I define a variable which is always one and print the values of the integration over y=0:ylim, where ylim = 0, 0.5, 1, 1.5, . . . .set data coads_climatology ! grid spacing is 2°
let _ones_ = 1 + 0*y[gy=SST]repeat/range=0:8/name=yy (let val = ones[y=0:`yy/2`@DIN]; say `val`)I find that the value of the integral is constant when ylim <= dely and then it starts to linearly grow after that.Perhaps this isn't intended?Best regards,Ryo--Xiaoyu--Xiaoyu