Hi Ansley,
Thank you for your help! I also get your other message about the nessesity of NOAX on plot/vs .
This does look like a bug, but apparently only when the PLOT/VS is done as an overlay. Try this script - you'd need to clean up the axis labeling of course but this is the idea.
---- example.jnl ----set mode grat:dash
set text/font=Courier
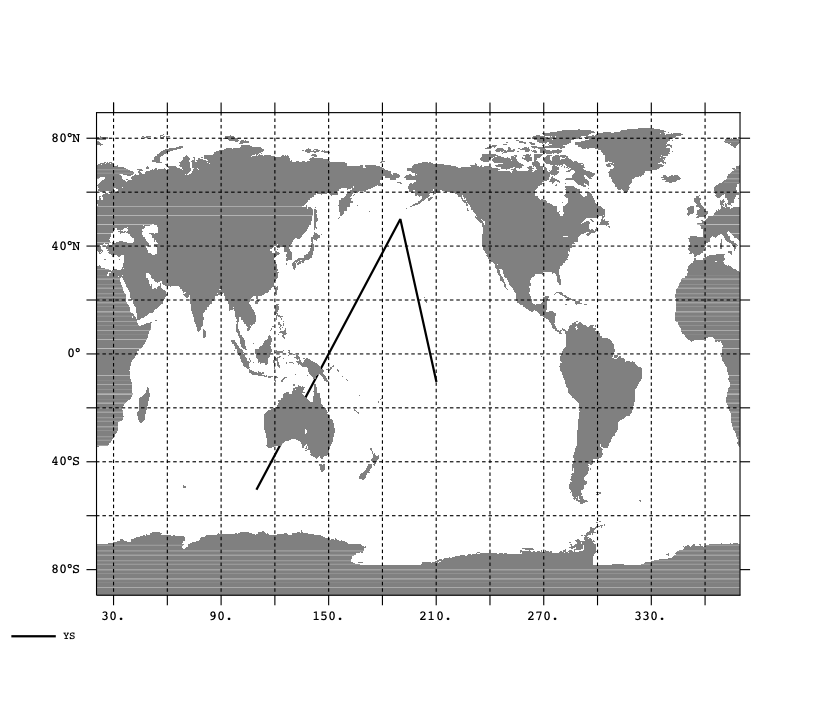
let/units=degrees_east xs = {110,190,210}
let/units=degrees_north ys = {-50, 50, -10}
plot/vs/hlim=20:380/vlim=-90:90/line/thick=2 xs,ys
go fland 20, , , , , , axes
Yes. That's indeed a nice solution to the problem I posted. I didn't need to set up the axes with an empty plot.
Unfortunately, the code above crashes PyFerret on my machine and I'm unable to test it. (Since this is too technical, I just submitted my report directly to github.) I can try another machine, perhaps Linux, later.
Now this doesn't help if what you really want is to overlay the line on some non-blank plot, but it might get you a step further on.
I overlay many separate lines using PLOT/VS/OV and so the second plot/vs command would interfere with the longitude axis . . . which makes me realize I can use the following solution!
let xs = {110,190,210, -1e34, 30, 40, 60, -1e34, . . . }
let ys = . . .
plot/vs/noax/hlimits= . . . /vlimits= . . . xs, ys
So, I would assemble all the lines and curves into a single curve with interruptions and plot everything at once!
Perhaps that's the way to go.
(By the way your example script has a typo where it assigns units to xs and ys, but it doesn't seem to affect this issue.)
Indeed. Thanks.
Ryo
-Ansley
On 6/7/2021 9:24 PM, Ryo Furue wrote:
Dear Ferret users and developers,
I'm trying to plot a land mask (with fland) over an open polygon, but the numeric labels of the x axis miss the longitude labels, "E" or "W".
This is because the PLOT/VS command somehow alters some x-axis properties. POLYGON command, on the other hand, doesn't do this, but I need an open line, not a closed polygon.
Below I paste a self-contained example. Here is its skeleton:
fill/noaxis/nolabel . . . missingdata !--- (1) Set up the axesplot/vs/ov xpoly, ypoly !--- (2) plot the linego fland 20, , , , , , axes !--- (3) plot the land, axes, and gridlines
I need to plot the axes at the last command because I need the gridlines to show over the land. (Also, in my real code, I plot the ticks inward and I need them to show over the land.)
I plot the line before the land because the land must partially cover the line.
I tried getting another overlay to plot the x axis (fill/ov missingdata) after "go fland 20", but the resultant x axis is the same, that is, still missing "E" and "W". So, the impact of the PLOT/VS command remains.
Does somebody know a simple solution?
Regards,
Ryo---- example.jnl ----set mode grat:dash
set text/font=Courier
set data levitus_climatology
let allmissing = temp[k=1] + 0/0
cancel mode nodata_lab
fill/nolabel/noax allmissing
let xs = {110,190,210}
let ys = {-50, 50, -10}
set var/units=degrees_east xs
set var/units=degrees_north xs
plot/vs/line/thick=2/ov xs,ys
!polygon/line/thick=2/ov xs,ys
go fland 20, , , , , , axes
frame/file=sample.png