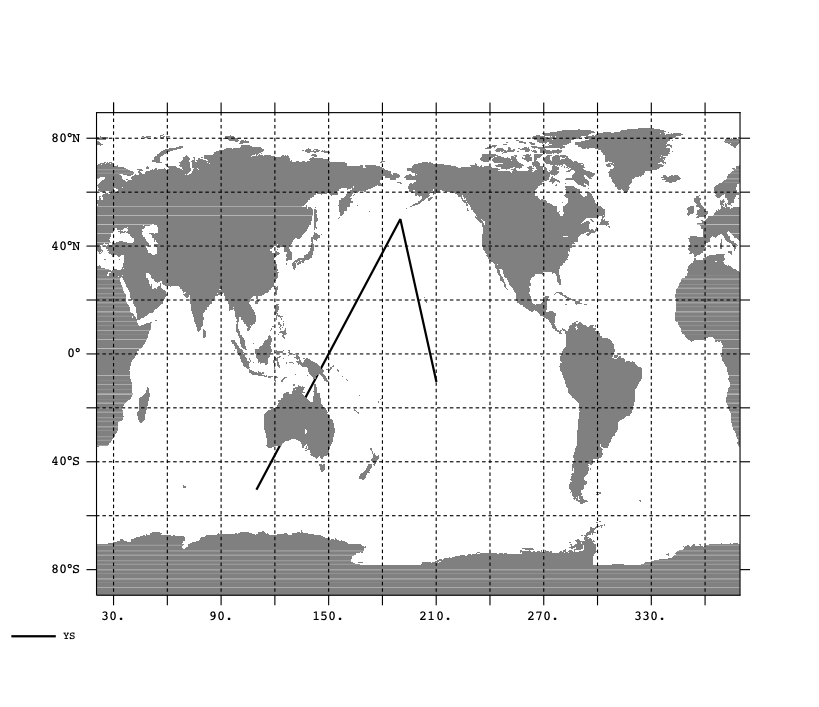
I'm trying to plot a land mask (with fland) over an open polygon, but the numeric labels of the x axis miss the longitude labels, "E" or "W".
This is because the PLOT/VS command somehow alters some x-axis properties. POLYGON command, on the other hand, doesn't do this, but I need an open line, not a closed polygon.
Below I paste a self-contained example. Here is its skeleton:
fill/noaxis/nolabel . . . missingdata !--- (1) Set up the axes
plot/vs/ov xpoly, ypoly !--- (2) plot the line
go fland 20, , , , , , axes !--- (3) plot the land, axes, and gridlines
I need to plot the axes at the last command because I need the gridlines to show over the land. (Also, in my real code, I plot the ticks inward and I need them to show over the land.)
I plot the line before the land because the land must partially cover the line.
I tried getting another overlay to plot the x axis (fill/ov missingdata) after "go fland 20", but the resultant x axis is the same, that is, still missing "E" and "W". So, the impact of the PLOT/VS command remains.
Does somebody know a simple solution?
Regards,
Ryo
---- example.jnl ----
set mode grat:dash
set text/font=Courier
set data levitus_climatology
let allmissing = temp[k=1] + 0/0
cancel mode nodata_lab
fill/nolabel/noax allmissing
let xs = {110,190,210}
let ys = {-50, 50, -10}
set var/units=degrees_east xs
set var/units=degrees_north xs
plot/vs/line/thick=2/ov xs,ys
!polygon/line/thick=2/ov xs,ys
go fland 20, , , , , , axes
frame/file=sample.png