[Thread Prev][Thread Next][Index]

[ferret_users] WIRE PLOT (axis labeling)


Dear Ferret users,

I'm making 3-D plot by using wire command. It seems PPLUS axis commands are not working for a wire plot.

 yes? use etopo120

 yes? WIRE/view=1800,380,10000 rose


wire_fig.PNG
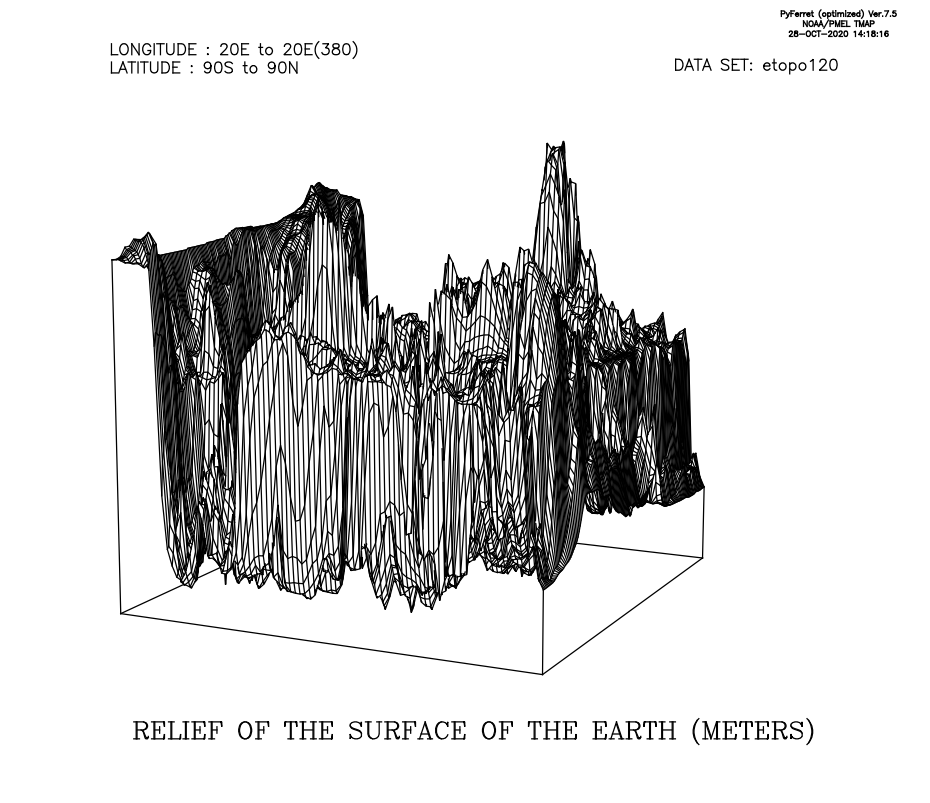
How can we format axis (including ticks and labels) in wire plot? Also, it would great if we could use palette/ribbon. Does anyone have experience in this stuff?

Best Regards
Pratik 

[Thread Prev][Thread Next][Index]
Contact Us
Dept of Commerce / NOAA / OAR / PMEL / Ferret

Privacy Policy | Disclaimer | Accessibility Statement