Good day to all,
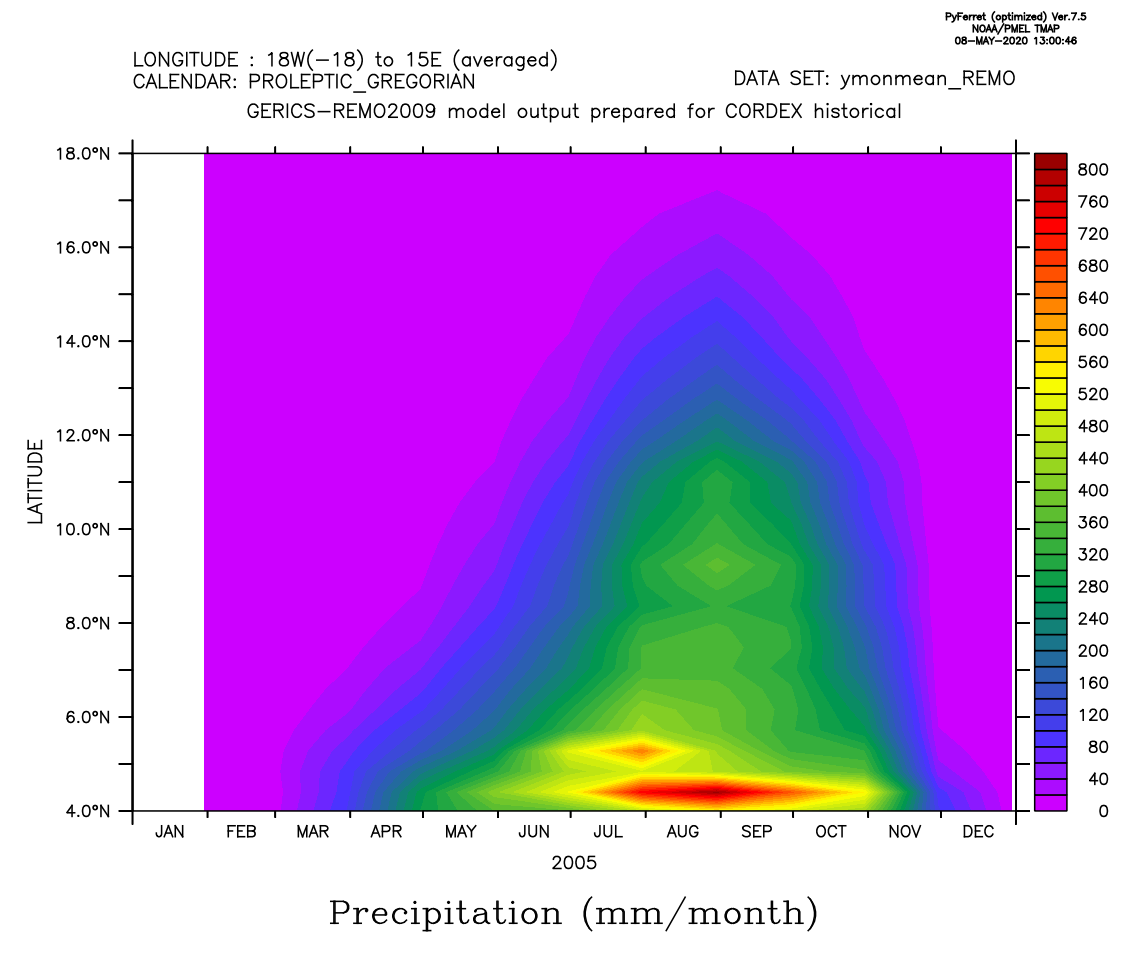
hope this email finds you well. I've been trying to do latitude-time cross-section plot with data obtained from CORDEX with below code line but when ever I performed fill operation I noticed a clear white space at the beginning and end of the time plot. I have tried to overlay fill over the "shade" that did not give white space but with no success as the white space from the fill overlay the color from shade operation.
NOAA/PMEL TMAP
PyFerret v7.5 (optimized)
Linux 4.15.0-1064-azure - 12/16/19
8-May-20 12:56
yes? use ymonmean_REMO.nc
yes? sh d/v
yes? palette rainbow
yes? shade pr[x=-18:15@ave,y=4:18,l=1:12]
yes? fill/over pr[x=-18:15@ave,y=4:18,l=1:12]
yes? frame/file=remo.png
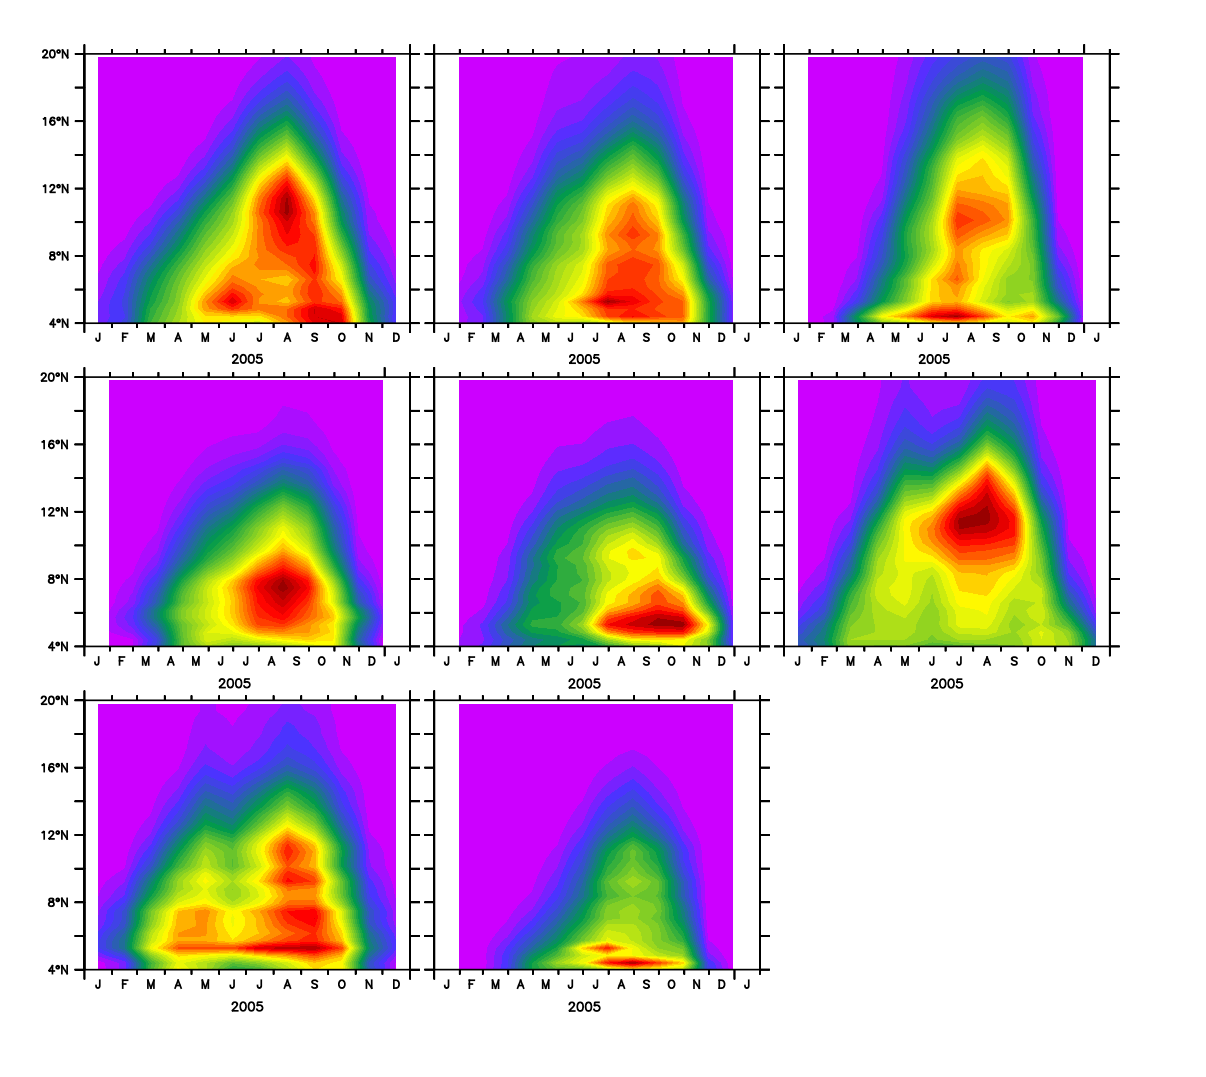
Attached are my data sample and plots.
Your kind suggestions and correction will be highly appreciated.
--
OLUWASEUN ILORI
M.Tech in Meteorology and climate science
Phone: +2347031000687 +2348069154213
Federal University of Technology Akure. Nigeria.