That is an excellent point, and it led me inadvertently to find the problem (which was different, and associated with the setup of the ERA5 NetCDF). When I performed that weighted average calculation in excel, I again got a value different from the @AVG regridding value. This included accounting for the leap years 1984.
However, rereading this piece of the user's manual: regridding with @AVE, and then looking at the length of the months in my original ERA5 data I realized that the original data came in strange T-boxes. For example, the measurement for January was centered on January 1st and extended from mid-December to mid-January. As defined then, when I regridded into December-February time boxes, I was getting 1/2December, January, February, and 1/2 of March. (It also defines February and March as 29.5 days each). I honestly don't know what calendar ERA5 comes on!!
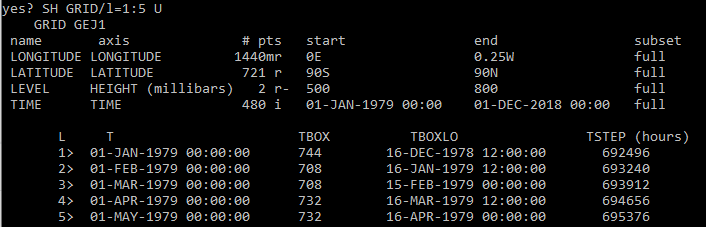
The full fix would probably be to first regrid it into proper 1-month time slots using the @ASN transformation as described in the above link, then regrid it a second time into the seasonal 3 months using the @AVG. However, as a rough check, I just redefined the seasonal axis to start November 15 and end February 15th in order to mostly catch the three months of interest (again November 15-December 15th would add >95% December values to my three month average as apposed to November or January values). The results were very close to my excel weighted averages, and were more correct than either of my first two sets of averages.
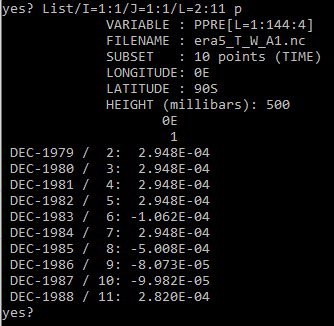
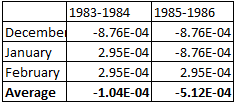
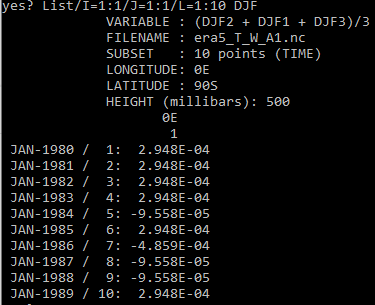
I also realized that my screenshots in my first post were confusing because using method 1 (regridding using @AVG into 3 month timeslots) the years were listed according to the January time, while using method 2 (manually averaging the values, it listed the years as the previous year as it started with the December month. Although not consistent with the above screenshot since the seasonal axis is there centered on December 31st, I have corrected that below for the reader's convenience.
Method 1:
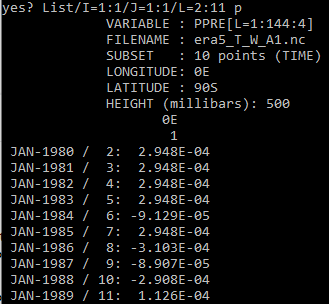
Method 2:
Alexander Audet