[Thread Prev][Thread Next][Index]
[ferret_users] cumulative distribution curve
- To: "ferret_users@xxxxxxxx" <ferret_users@xxxxxxxx>
- Subject: [ferret_users] cumulative distribution curve
- From: gopika suresh <gopikasurvay@xxxxxxxxx>
- Date: Sun, 1 Dec 2019 08:00:09 +0530
- Arc-authentication-results: i=4; mx.google.com; dkim=pass header.i=@gmail.com header.s=20161025 header.b=XnqaP3uz; arc=pass (i=2 dkim=pass dkdomain=gmail.com); spf=softfail (google.com: domain of transitioning gopikasurvay@xxxxxxxxx does not designate 52.222.5.176 as permitted sender) smtp.mailfrom=gopikasurvay@xxxxxxxxx; dmarc=pass (p=NONE sp=QUARANTINE dis=NONE) header.from=gmail.com
- Arc-authentication-results: i=3; mx.google.com; dkim=pass header.i=@gmail.com header.s=20161025 header.b=XnqaP3uz; arc=pass (i=2 dkim=pass dkdomain=gmail.com); spf=softfail (google.com: domain of transitioning gopikasurvay@xxxxxxxxx does not designate 52.222.5.176 as permitted sender) smtp.mailfrom=gopikasurvay@xxxxxxxxx; dmarc=pass (p=NONE sp=QUARANTINE dis=NONE) header.from=gmail.com
- Arc-authentication-results: i=2; mx.google.com; dkim=pass header.i=@gmail.com header.s=20161025 header.b=XnqaP3uz; arc=pass (i=1 spf=pass spfdomain=gmail.com dkim=pass dkdomain=gmail.com dmarc=pass fromdomain=gmail.com); spf=softfail (google.com: domain of transitioning gopikasurvay@xxxxxxxxx does not designate 65.153.203.169 as permitted sender) smtp.mailfrom=gopikasurvay@xxxxxxxxx
- Arc-authentication-results: i=1; mx.google.com; dkim=pass header.i=@gmail.com header.s=20161025 header.b=XnqaP3uz; spf=pass (google.com: domain of gopikasurvay@xxxxxxxxx designates 209.85.220.41 as permitted sender) smtp.mailfrom=gopikasurvay@xxxxxxxxx; dmarc=pass (p=NONE sp=QUARANTINE dis=NONE) header.from=gmail.com
- Arc-message-signature: i=4; a=rsa-sha256; c=relaxed/relaxed; d=google.com; s=arc-20160816; h=list-archive:list-help:list-post:list-id:mailing-list:precedence :message-id:to:subject:date:from:in-reply-to:references:mime-version :sender:dkim-signature; bh=bc7z7qTF5+qyc3XeeXtdQMute9dnXUG7/DsqaXQGcVE=; b=jSy8peG4eZ8E5ldpf4FXMOiteXoT72QsDkC/5dHWIh/OxHM+z6/zHRcEk9d689sRbc TVEw4WG088HT7IiRQUf2BEkS1LbQPwWLNNeSzr1vhaHikp7pyMB4a2IAgcWHUgHcfydT cM6CmJ9hBGkXgG/seN0KCgbX8nfJ5OtuM72F7/pdRW/VgXxHOGrNHq5kSSyDkL0+is5G bDuDdsNnCnCqmR41rsTlHG6ePkx7dpCuaGoTMSjbyzcsOv29KKxtAWICAj2t28SNerNQ pWdnwAIfs/fshM6O3OVQ4SDJTWNPSkTvjRAWp79w1URO6U5vlkpLMwJT/JAkrUb7YlQ7 /iWg==
- Arc-message-signature: i=3; a=rsa-sha256; c=relaxed/relaxed; d=google.com; s=arc-20160816; h=message-id:to:subject:date:from:in-reply-to:references:mime-version :dkim-signature; bh=bc7z7qTF5+qyc3XeeXtdQMute9dnXUG7/DsqaXQGcVE=; b=AUBAXEfKUEOVlKPI1yY1SSgHQh14+gjhOR6YJ4yaLE21iGxhYed4qjZCH3gxlY4It5 rZKWvYmsYsHTaEKKKht4x99YaCXT83J43ELlIikqEcmuDmbPb7EPdxmZyJYmFOH+nKnM Ckm5JxnkSZaRR0nVUBHtkLh6rJWf8cM+mQEr1g209Q9TACawVzEoISeQlOQSopTh0RLI rEOpyzq6GBsxRXD2juHgZ6KsykFSc/JYT+J5hIbu8OuGzAa+Q7AIh/UcoBKx9nMKM7mr r7jCzt6xCOFTvQwQKCibY6r1inwB5WJkkI8JSmWwf6kwNM2sLxx3odDidZQ/eqeRRZbV 65kA==
- Arc-message-signature: i=2; a=rsa-sha256; c=relaxed/relaxed; d=google.com; s=arc-20160816; h=to:subject:message-id:date:from:in-reply-to:references:mime-version :dkim-signature; bh=bc7z7qTF5+qyc3XeeXtdQMute9dnXUG7/DsqaXQGcVE=; b=j+0X1RZ77JGEnYiyQfu6qP8vCN3oWw9A+NdswuaJCJmagrXS82YS4TQl2oDK5W9rbt n39TQO7WVLKbBwwFTW0bbHnKIvke9lPp5oE9Q68NTbhEGphyI8NSVgEs5aqUkjjxOlru WJeEmI04FDVm4tIQWz0Rn0A3V/M1RrbC+q+tl229IsqR18El1JXBxxLIzuHm6yjhgOIo a2CRPa1/AwIrK3iYEGRpJCb79lyoWYsRmAm3pub88l8lU9xLXrKbWS3Tx1JEiVqGcsHw 8dqfhTxbXuFPfi5lCFapoHtXdyJco81Ez3Lgn2GWfj0AqYAfdgPuUc0J8gdl9odQJ0wf 0iSA==
- Arc-message-signature: i=1; a=rsa-sha256; c=relaxed/relaxed; d=google.com; s=arc-20160816; h=to:subject:message-id:date:from:in-reply-to:references:mime-version :dkim-signature; bh=bc7z7qTF5+qyc3XeeXtdQMute9dnXUG7/DsqaXQGcVE=; b=m9mXD9x8seUzXKbyJtscHF9lTkFCelcYQo1sOp0G/MP0dDeeNmnAC7ZoH11mD5hPpP jLUwi/pRd8YsBYFEFeUZluC2oaB8VT3GD+Zg7Nal1dQbInMxH+2aJzXrS/aYHoROCrfz FpUDjpNeuYFSLlsJ/iVeDLU43bokGPz54FyG6F96jgfroaMfChfAgbZW21+oO+ZQUR10 J8CY26A7ySvUmDU/U/pqoIyhpQtblmq9MyFPQR03xWpbp0fcN1x3fADnK49gYi0CXfK/ gIcSrCav7BkZq7f1JesBYMK/lPT6WDPmBU5x9Tw85jk5/xC5SxwSriFnVoFxLYMsxKpa +Pwg==
- Arc-seal: i=4; a=rsa-sha256; t=1575167431; cv=pass; d=google.com; s=arc-20160816; b=W/Mw5zjJVqeroa4IPL5nRfJkA0Yk90W/x1G5rBTYZwzmnXzLEKxeNjixv6NHGIRu/k tv9XUjTSlBUGkaJAudndEx+bMVzcHP6IhOZ9/X/wKN+axiFhyBRhnWSttK0tNG6o4aSH po0ZV3Af5fF0GwWY9TgglZHcQkWyCHfHgqS6pOAw/xqgngxlLcsQSSIMUwyiPloSZyKx ZJ+tkqsnigTy2+pCP4aC8+jXbdCHaHIo+tbquTPHW3Dpd0z/qDzLttx+KEue0OQlfsMY n/TMlEQuh0IjR41PmbDgVv56kdCpl7W7+/Gp7YdiZfxFvu/VTsboXIBrWeiFi//H7Z5N fXwA==
- Arc-seal: i=3; a=rsa-sha256; t=1575167430; cv=pass; d=google.com; s=arc-20160816; b=R3/m6DduQGVPhbmas1XjFAWwj8xXFBmbuhsiRVEMsIuuQpfDKENkjWg05OlfPCelUK 1W4uRBAo2tn6ts6A2Y9DLiOvS7MIVXZTKagtcWg79CbzlHTv8nFNAhQjkZHNYoq+08EH ZNYmiB+ZOUDYqvUFWKdMGtiG2c+4DelPdSrrh6K6A69vFDEiael7pffnSRAj26FVeH// X2yD0Zl/tjQqoVbSPDw5SmsGMucj3O16lzkwnPVB7WmPj+iV9aU/MYEb/wLWEF4QF3Kc FYiBOSPHRk8e4JiMLbEwJiryjPzg47uHtylZdDMsE58Xar50wa5kjj8kq6Do+4bKqZRO uiig==
- Arc-seal: i=2; a=rsa-sha256; t=1575167424; cv=pass; d=google.com; s=arc-20160816; b=o2hYbA4Xz7kJ/wk9F/qTZGWvz4LjPhQZovtb1uiVqwVLVzDcDRv52NYvJusoEacb5Z 6+huFEdQg9Gqnz+JTGH4vSjn0lH4Zh7lkdLLff6LkuhJp8vikxDvx5n+WrlTVkPo8l3P 2RugcK8LshG5KM1lDzZ3qg7LJrHjk6qJlReC8TL+/ySUAqwhdJCheNNO7subH2Qmpq8e ijrq1iqKF8dFUc6T7SY/0i9DRQIX4YpvKVn3c1z+hfy6DHT/qLCrDh3/SNiMEs+BmEjB wFy1wMl4HKdPbRPAofVgfXglYvLyGqFDIjH1MWFR8+NUlVZkbgSY3vePf+/J7rzM0yfH EEfA==
- Arc-seal: i=1; a=rsa-sha256; t=1575167421; cv=none; d=google.com; s=arc-20160816; b=gqJbKr2/pLBrmDQm3Ce2x+WePLSr66vFwR5HbaiZj8iFjnsiqXbagoTRcyM6ii1KJr M2n+ipwBqS1YX04bjX4QSOZg75hgfl44xsFuGuhYAyfevDbWQ3ot2XWgkfWXWpi/w3Ew DqoWzp+YJRlzQAhNIeyAwNcrwdJ7WbHXXX8hig2IR5s2OyojypFfdZrGxNCkwGPbWJIr HUG5EAzhpKSzlJAvQQ3mMGO5h6MLZoM8pyr2mHp/l+HOVk0bQcfmRvdBzOqnmaikjb3b 2YDZlfWrtL1r7IOl668sad5QcIhlDQ90erwGXlDteaDtc0dE48U/iJLjtKx5qd8LWIJP M1Hg==
- Dkim-signature: v=1; a=rsa-sha256; c=relaxed/relaxed; d=noaa.gov; s=google; h=sender:mime-version:references:in-reply-to:from:date:subject:to :message-id:x-original-sender:x-original-authentication-results :precedence:mailing-list:list-id:list-post:list-help:list-archive; bh=bc7z7qTF5+qyc3XeeXtdQMute9dnXUG7/DsqaXQGcVE=; b=JDZN0rJEd2guNnoG23oa8qKF6ULLTFulQxby0XHx3+D6KJd1S1PuhZaczf23V9atTZ +sJgbr8ei3phCiT/aFqwkeGInnZpNkBc9daMOKU/CGHaaugiRy7zZsYbdN2v8Dteg6lc I5SaYlAUxKMleAZ1L+dsprjZHV8vnuwDoTHTDIti4ONFayRAaKF5PD2tVlBwJE1H9v5m 2k+IXE7HC9uNhMb8/Imff62E04jnxWbzburCaqXo3/eWsSQpSyGN+psgZ+YT/KE/xxY3 WFTZixshNzXFJPRqALmxCp4hUuoMIlgrjW2yaEKikHhbkQ55fOdnDz5mVwoFwXgMkBYR qRag==
- In-reply-to: <CAC4D6+-J0tCq4fUVH=r_5LrzFQNKiQ3Ex7jFAqgLs=gR59o9ag@mail.gmail.com>
- List-archive: <https://groups.google.com/a/noaa.gov/group/ferret_users/>
- List-help: <https://support.google.com/a/noaa.gov/bin/topic.py?topic=25838>, <mailto:ferret_users+help@noaa.gov>
- List-id: <ferret_users.noaa.gov>
- List-post: <https://groups.google.com/a/noaa.gov/group/ferret_users/post>, <mailto:ferret_users@noaa.gov>
- Mailing-list: list ferret_users@xxxxxxxx; contact ferret_users+owners@xxxxxxxx
- References: <CAC4D6+9bAV2QsYtJz0zamNiaBhDKj6GG5D4g7Wru=3vQPtAj-g@mail.gmail.com> <CAC4D6+-J0tCq4fUVH=r_5LrzFQNKiQ3Ex7jFAqgLs=gR59o9ag@mail.gmail.com>
- Sender: owner-ferret_users@xxxxxxxx
Dear all,
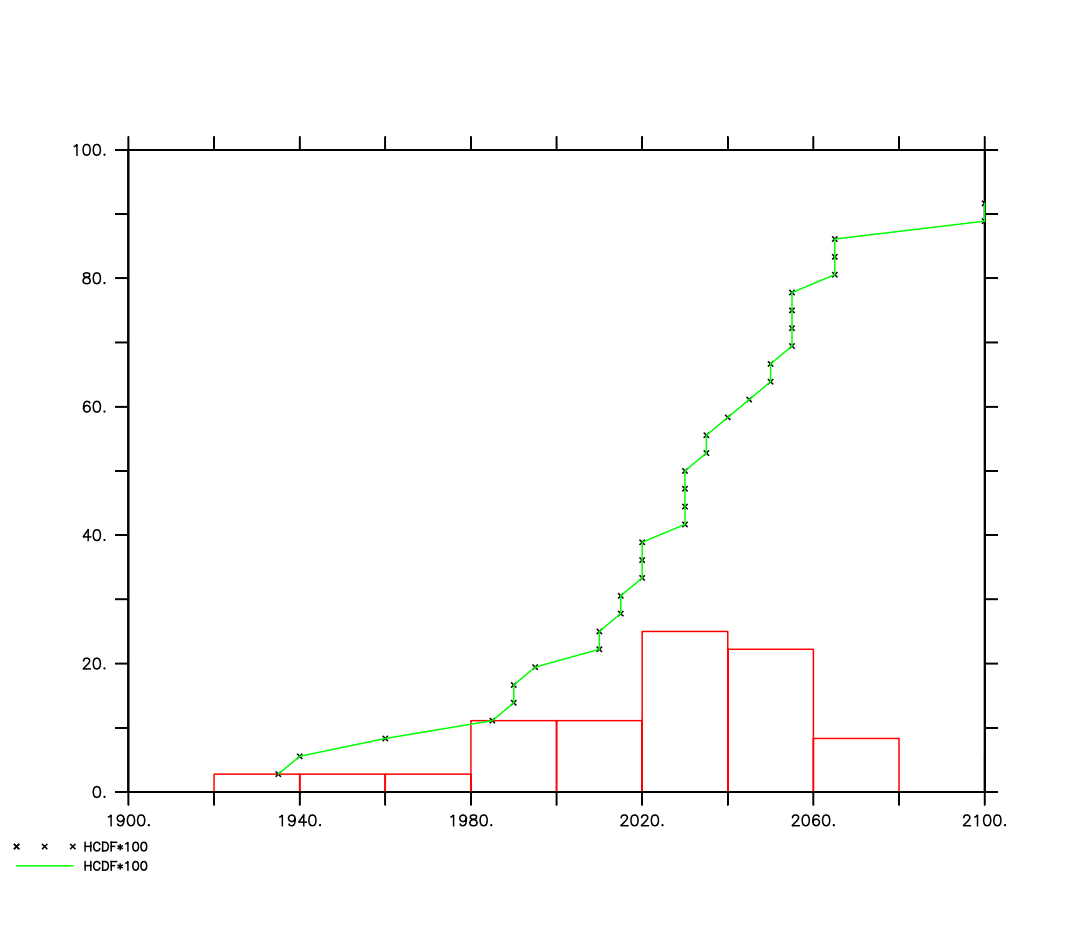
From a 2D dataset, I want to make a cumilative distribution curve, that is my values are between 0 to 100. I want to count the frequency per year from 1900-2100.
 for that i did
the method that have mentioned here (https://www.pmel.noaa.gov/maillists/tmap/ferret_users/fu_2001/msg00631.html)
I tried this way but it is to make frequency distribution, But i would like to plot this in an increasing timeseries ( cumulative distribution).
i have attached my plot here but that Is plotted with all the available values. I want to make it in to per year frequency. That means 1900-2100 (201 years) . If some value is there in any year then it will be increasing otherwise straight line.
do you have any idea about the same?
I am attaching my data here
Thanks in advance
Gopika
--
Attachment:
data.nc
Description: Binary data
[Thread Prev][Thread Next][Index]
Contact Us
Dept of Commerce /
NOAA /
OAR /
PMEL /
Ferret
Privacy Policy | Disclaimer | Accessibility Statement