Hi there,
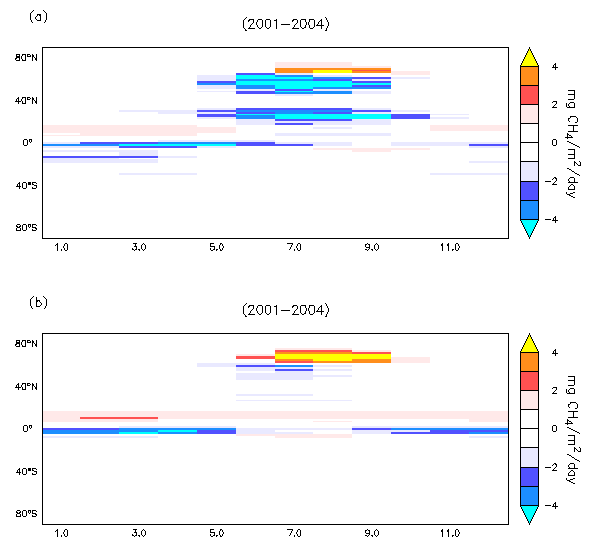
I'm generating maps for zonal anomalies [of wetland methane emissions] over 12 months (see attached image) and I'd like to replace numerical labels for the x-axis (ie. 1, 3, ..., 11) by Jan, Mar, ..., Nov.
Can someone please suggest how to achieve that?
FYI, I'm using FERRET v7.1 (optimized).