Hi,
I am relatively new to ferret and am struggling to plot a regression line on a vs plot. I am using annual mixed layer depth and sea surface temperature data from 1970 – 2099.
This is what im currently doing, following a previous post https://www.pmel.noaa.gov/maillists/tmap/ferret_users/fu_98/msg00121.html –
Yes? Plot/vs mld[i=@ave,j=@ave],sst[I=@ave,j=@ave]
Yes? Let p = sst
Yes? Let q = mld
Yes? Go regresst
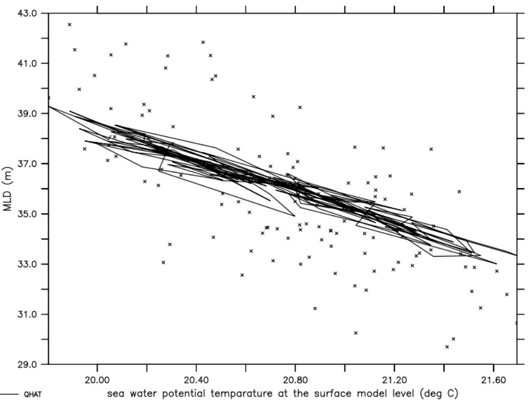
Yes? plot/vs/line/over p[I=@ave,j=@ave],qhat[I=@ave,j=@ave]
However plotting ‘p,qhat’ doesnt give me a single line and also doesn’t look correct - shown in the picture I have attached. I would also like to obtain the rsquared value for this plot and am unsure how to.
Many thanks,
Emma