Dear Ferreters,
G'day
I am facing a problem and I am not sure about the result that I got is right or not. I computed the ocean heat content trend on neutral density axis and now I want to map it back to the standard z-axis (meter/db). I performed zaxreplace function to do that but the result that I got is not showing any value below 1750 m. However, my all data is till 2000 m.
Here is the structure of my data that I use to do this analysis.
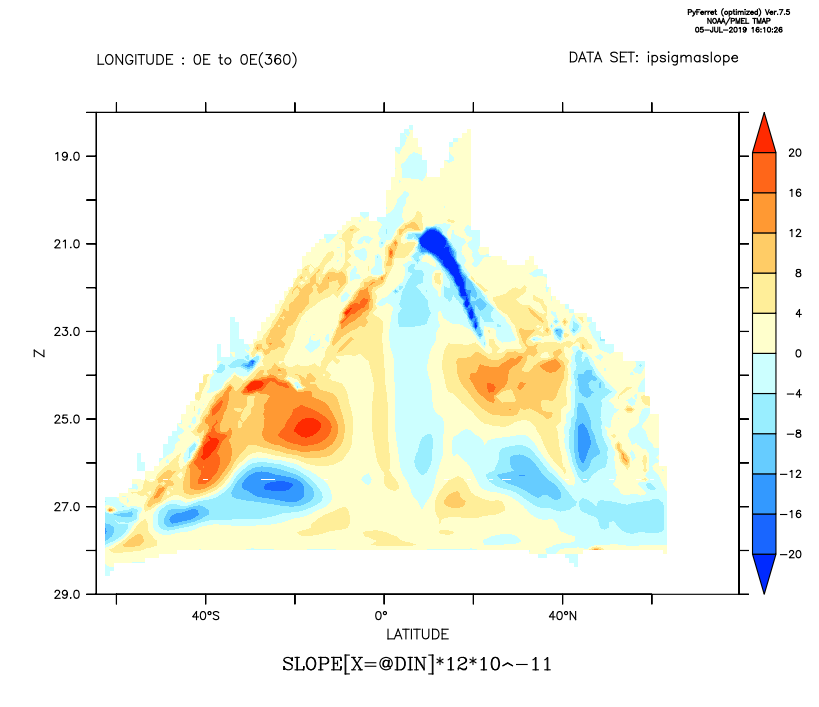
use ipsigmaslope.nc !!!!!!!!!!!!!! data that I want to map back on depth axis (meter) !!!!!!!!!!!!!!!!!!!!!!
sh gr slope
GRID GTO1
name axis # pts start end subset
LON LONGITUDE 360mr 0.5E 0.5W full
LATITUDE LATITUDE 145 r 64.5S 79.5N full
AXDEN Z 112 r 17.879 28.979 full
normal T
GRID GTO1
name axis # pts start end subset
LON LONGITUDE 360mr 0.5E 0.5W full
LATITUDE LATITUDE 145 r 64.5S 79.5N full
AXDEN Z 112 r 17.879 28.979 full
normal T
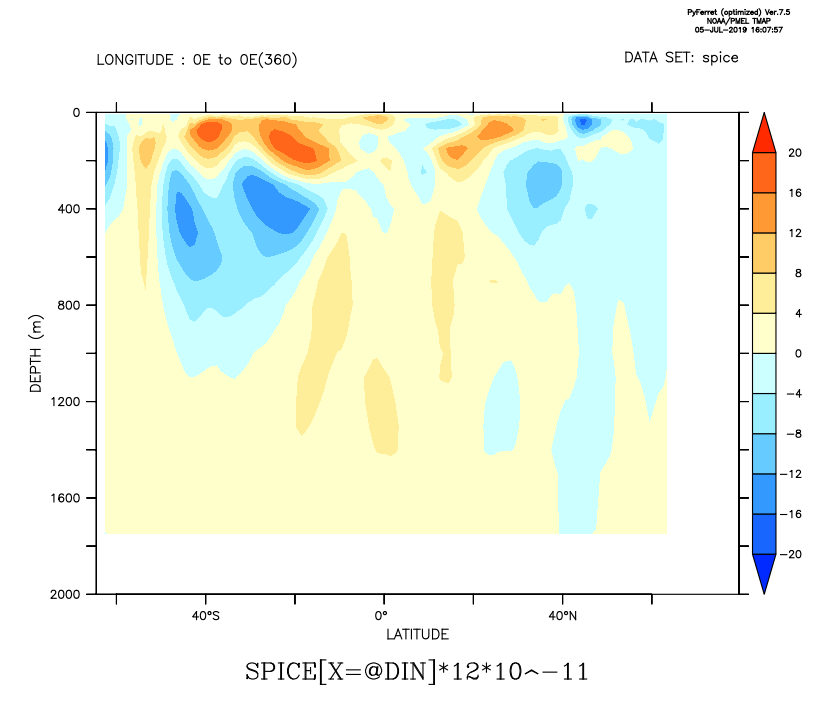
use ipheat.nc
sh gr heat
GRID GCM1
name axis # pts start end subset
LON LONGITUDE 360mr 0.5E 0.5W full
LATITUDE LATITUDE 145 r 64.5S 79.5N full
LEV DEPTH (m) 27 i- 0 2000 full
normal T
name axis # pts start end subset
LON LONGITUDE 360mr 0.5E 0.5W full
LATITUDE LATITUDE 145 r 64.5S 79.5N full
LEV DEPTH (m) 27 i- 0 2000 full
normal T
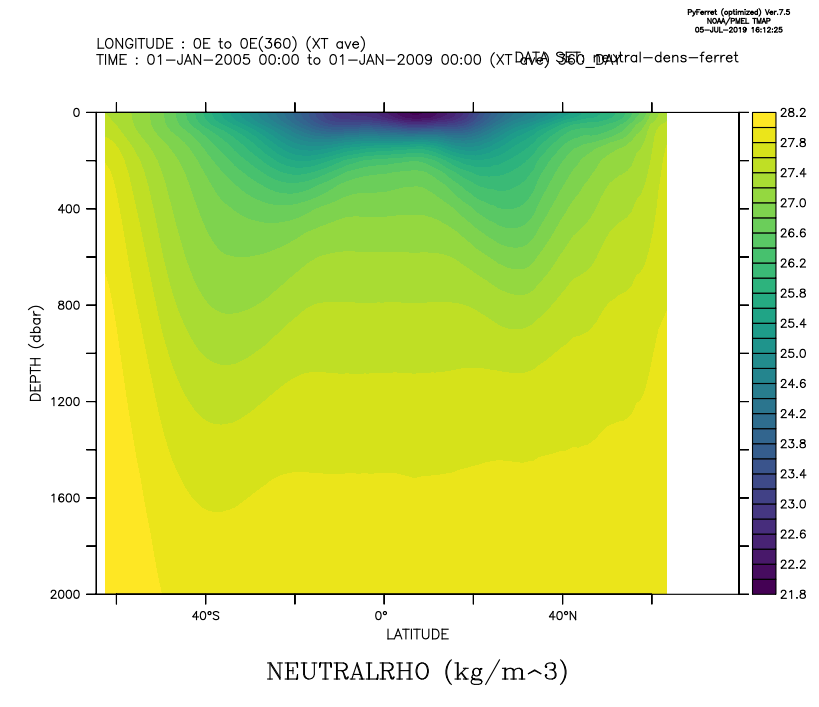
use neutral-dens-ferret.nc !!!!!!!!!!!!!!! data of neutral density !!!!!!!!!!!!!!!!!!!!!!!!!!!!!!!!!
sh gr NEUTRALRHO
GRID GLA1
name axis # pts start end subset
LON LONGITUDE 360 r 0.5E 0.5W full
LAT LATITUDE 145 r 64.5S 79.5N full
LEV DEPTH (dbar) 27 i- 0 2000 full
TMONTHLY TIME 68 r 16-JAN-2005 00:00 16-DEC-2008 00:00 full
GRID GLA1
name axis # pts start end subset
LON LONGITUDE 360 r 0.5E 0.5W full
LAT LATITUDE 145 r 64.5S 79.5N full
LEV DEPTH (dbar) 27 i- 0 2000 full
TMONTHLY TIME 68 r 16-JAN-2005 00:00 16-DEC-2008 00:00 full
here is the code script that I used.
!!!!!!!!!! first I defined the maximum and minimum limits of neutral density !!!!!!!!!!!!!!!!!!!!!!!!!!!!!!!!!!!!!!!!!!
define axis/z=`NEUTRALRHO[d=3,x=@min,y=@min,l=@min,z=@min]`:`NEUTRALRHO[d=3,x=@max,y=@max,l=@max,z=@max]`:.1 axden
!!!!!!!!!!!!!!!!!!!!!!!!!!!! this step is to get depth values for all latitude and longitudes !!!!!!!!!!!!!!!!!!!!!!!!!!!!!!!
let zed=z[gz=heat[d=2]] + 0*heat[d=2]
!!!!!!!!!!!!!!!! now I used zaxreplace to interpolate the depth values on neutral density axis i.e. the each of the zed values (0m ,5m, 100m ..... 2000 m) is having neutral density values as the depth axis !!!!!!!!!!!!!!!!!!
let zedp=zaxreplace(zed, NEUTRALRHO[d=3,gx=slope[d=1],gy=slope[d=1],l=@ave], z[gz=axden])
!!!!!!!!!!!!!!!! now I want to map the variable slope from the neutral density z-axis to meter z-axis !!!!!!!!!!!!!!!!!!!!!!!11
let spice=zaxreplace(slope[d=1],zedp[gx=slope[d=1],gy=slope[d=1]],z[gz=zed])
exit
exit
after plotting spice the data is not plotted below 1750 m but my all data is till 2000 m. What mistake I am doing, I am not able to rectify.
Any help is appreciated.
Cheers, Saurabh
--
Saurabh Rathore
Research Scholar (PhD.)
Centre For Oceans, Rivers, Atmosphere & Land Science Technology
Indian Institute Of Technology, Kharagpur
contact :- 91- 8345984434