|
Hi, This is something we've planned to add for a long time: more flexibility to the legend-line plotting. "go legend" and "go legline" cannot do it; they both use an old capability called "aline" which can only draw lines based on the default line-type numbers, with line 1 always drawn as a thin black line, line 2 a thin red line, and so forth. Please try the attached script "linekey.jnl". It is somewhat similar to "legend.jnl" in that it adds one line to the legend, but it lets you pass in the plot qualifiers you want to use. It will also allow the legend to be placed outside the plot box. Read the comments at the start of the script for some details. Note that this is new and has not been heavily tested - it accounts for the aspect ratio of the plot in positioning and spacing the legend lines, but it may need some adjustments. It will be part of future Ferret/PyFerret releases. The script "test_linekey.jnl" also attached, does a few
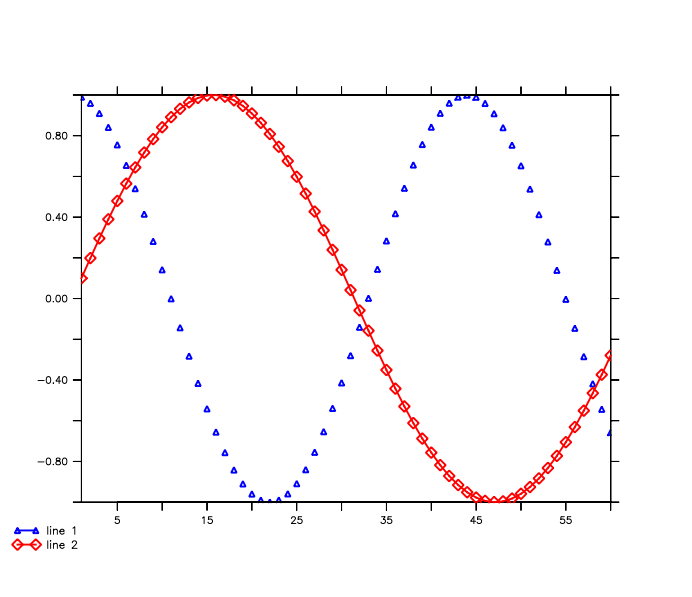
examples. Here is a short example of how it looks, making a
couple of line plots and a legend in the lower left. The
arguments are
! simple example calling the linekey.jnl script yes? cancel mode logo yes? go margins 1.4 1.4 1.2 1.2yes? plot/nolab/i=1:60/thick/sym=20/color=blue cos(i/7) yes? go linekey 1 "line 1" plot/thick/sym=20/color=blue llc yes? frame/file=example_linekey.png
On 5/22/2019 5:17 AM, saurabh rathore
wrote:
--
Ansley Manke NOAA/PMEL Science Data Integration Group 7600 Sand Point Way NE 206-526-6246 |
\cancel mode verify
!
! linekey.jnl
!   Draw a labeled line sample on a plot, a single line in a legend.
!   User-specified PLOT command with qualifiers for line style, color,
!     symbol, thickness.
!
! 5/22/2019
!
! Arguments
!   1  line number
!   2  title
!   3  plot command with thickness, color, symbol, size
!   4  location on the page ul ur ll lr ulc urc llc lrc, where:
!        ul, ur, ll, lr     are upper left, upper right etc, within the plot box
!        ulc, urc, llc, lrc are upper left corner, etc outside the plot box.
!
!  For legends in the plot corners, you may need to increase the margins for them to fit.
!  See the margins script:  yes? GO/HELP margins.jnl
!  To make the legend in the upper right of a page, use "CANCEL MODE LOGO"
!  to remove the ferret-version and date lines.
!
! Example:
!   cancel mode logo
!   go margins 1.4  1.4  1.2  1.2
!
!   plot/i=1:60/thick/sym=20 cos(i/10)
!   plot/over/nolab/i=1:60/thick/size=0.16/line/sym=30/color=red sin(i/10)
!   go linekey 1 "cosine" plot/thick/sym=20/color=black ur
!   go linekey 2 "sine" plot/thick/size=0.16/line/sym=30/color=red ur

! For the legends drawn within the plot box, the first line is drawn nearest
! the upper or lower axis line of the plot, with each new line drawn below that
! for upper-located legends or above for lower-located ones.

! For legends drawn outside the plot box, the first line is drawn nearest the plot
! box. For upper-located legends the first line is drawn just above the upper axis
! with more lines added above that. For lower-located legends the first line is drawn
! just below the bottom axis with more lines added below that.

query/ignore $1%<usage: go linekey line# title plot_command [location]%
query/ignore $2%<usage: go go linekey line# title plot_command [location]%
query/ignore $3%<usage: go go linekey line# title plot_command [location]%
query/ignore $4%1|ul>1|ur>1|ll>1|lr>1|ulc>1|urc>1|llc>1|lrc>1|\
 <location must be ul, ur, ll, lr, ulc, urc, llc or lrc%


DEFINE SYMBOL plot_command = `upcase("($3)")`

IF `substring("($plot_command)", 1,1) NE "P"` THEN
  SAY Argument 3 must be a PLOT command, e.g. PLOT/COLOR=RED
  EXIT/SCRIPT
ENDIF
DEFINE SYMBOL plot_command = ($plot_command)/NOLAB/OVER/VS

! IF it's not explicitly plot/sym=  THEN add /line.  By default plot/vs makes symbol plots
IF `STRINDEX("($plot_command)", "SY") EQ 0` THEN DEFINE SYMBOL plot_command = ($plot_command)/line


LET lk_xrange = ($XAXIS_MAX)-(($XAXIS_MIN))
LET lk_yrange = ($YAXIS_MAX)-(($YAXIS_MIN))

LET lk_aspect = ($PPL$HEIGHT)/($PPL$WIDTH)
LET lk_xdel = 0.04* lk_aspect
LET lk_ydel = 0.03/ lk_aspect


! expand things a bit IF we're in a viewport
LET lk_xdel = `lk_xdel/(($vp_xhi%1%)-($vp_xlo%0%))`
LET lk_ydel = `lk_ydel/(($vp_yhi%1%)-($vp_ylo%0%))`

IF `$4%1|ul>1|*>0|% EQ 1` THEN     ! left top

   LET lk_x1pt = (0.5*lk_xdel)* lk_xrange + (($XAXIS_MIN))
   LET lk_x2pt = lk_xdel*lk_xrange + lk_x1pt

   LET lk_yfac = (1-0.5*lk_ydel) - (($1)-1)* lk_ydel
   LET lk_y1pt = lk_yfac * lk_yrange + ($YAXIS_MIN)

   LET lk_xlabloc = lk_x2pt + 0.02*lk_xrange

   ($plot_command) {`lk_x1pt`,`lk_x2pt`}, {`lk_y1pt`, `lk_y1pt`}
   ANNOTATE/XPOS=`lk_xlabloc`/YPOS=`lk_y1pt`/HALIGN=-1/VALIGN=0/SIZE=0.11 "($2)"


ELIF `$4%1|ur>1|*>0|% EQ 1` THEN   ! right top

   LET lk_x1pt = (1-1.5*lk_xdel)* lk_xrange + (($XAXIS_MIN))
   LET lk_x2pt = lk_xdel*lk_xrange + lk_x1pt

   LET lk_yfac = (1-0.5*lk_ydel) - (($1)-1)* lk_ydel
   LET lk_y1pt = lk_yfac * lk_yrange + ($YAXIS_MIN)

   LET lk_xlabloc = lk_x1pt - 0.02*lk_xrange

   ($plot_command) {`lk_x1pt`,`lk_x2pt`}, {`lk_y1pt`, `lk_y1pt`}
   ANNOTATE/XPOS=`lk_xlabloc`/YPOS=`lk_y1pt`/HALIGN=1/VALIGN=0/SIZE=0.11 "($2)"

ELIF `$4%1|ll>1|*>0|% EQ 1` THEN   ! left bottom

   LET lk_x1pt = (0.5*lk_xdel)* lk_xrange + (($XAXIS_MIN))
   LET lk_x2pt = lk_xdel*lk_xrange + lk_x1pt

   LET lk_yfac = 0.5*lk_ydel + (($1)-1)* lk_ydel
   LET lk_y1pt = lk_yfac * lk_yrange + ($YAXIS_MIN)

   LET lk_xlabloc = lk_x2pt + 0.02*lk_xrange

   ($plot_command) {`lk_x1pt`,`lk_x2pt`}, {`lk_y1pt`, `lk_y1pt`}
   ANNOTATE/XPOS=`lk_xlabloc`/YPOS=`lk_y1pt`/HALIGN=-1/VALIGN=0/SIZE=0.11 "($2)"

ELIF `$4%1|lr>1|*>0|% EQ 1` THEN   ! right bottom

   LET lk_x1pt = (1-1.5*lk_xdel)* lk_xrange + (($XAXIS_MIN))
   LET lk_x2pt = lk_xdel*lk_xrange + lk_x1pt

   LET lk_yfac = 0.5*lk_ydel + (($1)-1)* lk_ydel
   LET lk_y1pt = lk_yfac * lk_yrange + ($YAXIS_MIN)

   LET lk_xlabloc = lk_x1pt - 0.02*lk_xrange

   ($plot_command) {`lk_x1pt`,`lk_x2pt`}, {`lk_y1pt`, `lk_y1pt`}
   ANNOTATE/XPOS=`lk_xlabloc`/YPOS=`lk_y1pt`/HALIGN=1/VALIGN=0/SIZE=0.11 "($2)"

ENDIF

! legends in the plot corners.

! set up to draw outside the plot box
IF `$4%|ulc>1|urc>1|llc>1|lrc>1|*>0|% EQ 1` THEN PPL WINDOW,OFF

IF `$4%1|ulc>1|*>0|% EQ 1` THEN     ! left top

   LET lk_x1pt = (0.5*lk_xdel)* lk_xrange + (($XAXIS_MIN) - 4*lk_xdel*lk_xrange)
   LET lk_x2pt = lk_xdel*lk_xrange + lk_x1pt

   LET lk_yfac = (1-0.5*lk_ydel) + (($1)-1)* lk_ydel
   LET lk_y1pt = lk_yfac * lk_yrange + (($YAXIS_MIN) + 2*lk_ydel*lk_yrange)

   LET lk_xlabloc = lk_x2pt + 0.02*lk_xrange

   ($plot_command) {`lk_x1pt`,`lk_x2pt`}, {`lk_y1pt`, `lk_y1pt`}
   ANNOTATE/XPOS=`lk_xlabloc`/YPOS=`lk_y1pt`/HALIGN=-1/VALIGN=0/SIZE=0.11 "($2)"


ELIF `$4%1|urc>1|*>0|% EQ 1` THEN   ! right top

   LET lk_x1pt = (1-1.5*lk_xdel)* lk_xrange + (($XAXIS_MIN) + 4*lk_xdel*lk_xrange)
   LET lk_x2pt = lk_xdel*lk_xrange + lk_x1pt

   LET lk_yfac = (1-0.5*lk_ydel) + (($1)-1)* lk_ydel
   LET lk_y1pt = lk_yfac * lk_yrange + (($YAXIS_MIN) + 2*lk_ydel*lk_yrange)

   LET lk_xlabloc = lk_x1pt - 0.02*lk_xrange

   ($plot_command) {`lk_x1pt`,`lk_x2pt`}, {`lk_y1pt`, `lk_y1pt`}
   ANNOTATE/XPOS=`lk_xlabloc`/YPOS=`lk_y1pt`/HALIGN=1/VALIGN=0/SIZE=0.11 "($2)"

ELIF `$4%1|llc>1|*>0|% EQ 1` THEN   ! left bottom

   LET lk_x1pt = (0.5*lk_xdel)* lk_xrange + (($XAXIS_MIN) - 4*lk_xdel*lk_xrange)
   LET lk_x2pt = lk_xdel*lk_xrange + lk_x1pt

   LET lk_yfac = 0.5*lk_ydel - (($1)-1)* lk_ydel
   LET lk_y1pt = lk_yfac * lk_yrange + (($YAXIS_MIN) - 2.5*lk_ydel*lk_yrange)

   LET lk_xlabloc = lk_x2pt + 0.02*lk_xrange

   ($plot_command) {`lk_x1pt`,`lk_x2pt`}, {`lk_y1pt`, `lk_y1pt`}
   ANNOTATE/XPOS=`lk_xlabloc`/YPOS=`lk_y1pt`/HALIGN=-1/VALIGN=0/SIZE=0.11 "($2)"

ELIF `$4%1|lrc>1|*>0|% EQ 1` THEN   ! right bottom

   LET lk_x1pt = (1-1.5*lk_xdel)* lk_xrange + (($XAXIS_MIN) + 4*lk_xdel*lk_xrange)
   LET lk_x2pt = lk_xdel*lk_xrange + lk_x1pt

   LET lk_yfac = 0.5*lk_ydel - (($1)-1)* lk_ydel
   LET lk_y1pt = lk_yfac * lk_yrange + (($YAXIS_MIN) - 2.5*lk_ydel*lk_yrange)

   LET lk_xlabloc = lk_x1pt - 0.02*lk_xrange

   ($plot_command) {`lk_x1pt`,`lk_x2pt`}, {`lk_y1pt`, `lk_y1pt`}
   ANNOTATE/XPOS=`lk_xlabloc`/YPOS=`lk_y1pt`/HALIGN=1/VALIGN=0/SIZE=0.11 "($2)"

ENDIF

ppl window,on
cancel variale lk_*
! test_linekey.jnl
! Examples using the "linekey.jnl" script for legend lines.


cancel mode logo
go margins 1.4  1.4  1.2  1.2

! Draw an example pair of lines, and show all of the different legend
! locations

plot/i=1:60/thick/sym=20 cos(i/10)
plot/over/nolab/i=1:60/thick/size=0.16/line/sym=30/color=red sin(i/10)

go linekey.jnl 1 "title one" plot/thick/sym=20/color=black ur
go linekey.jnl 2 "title two" plot/thick/size=0.16/line/sym=30/color=red ur

go linekey.jnl 1 "title one" plot/thick/sym=20/color=black ul
go linekey.jnl 2 "title two" plot/thick/size=0.16/line/sym=30/color=red ul

go linekey.jnl 1 "title two" plot/thick/size=0.16/line/sym=30/color=red ll
go linekey.jnl 2 "title one" plot/thick/sym=20/color=black ll

go linekey.jnl 1 "title two" plot/thick/size=0.16/line/sym=30/color=red lr
go linekey.jnl 2 "title one" plot/thick/sym=20/color=black lr

! Now the legends outside the plot box
go linekey.jnl 1 "title one" plot/thick/sym=20/color=black urc
go linekey.jnl 2 "title two" plot/thick/size=0.16/line/sym=30/color=red urc

go linekey.jnl 1 "title one" plot/thick/sym=20/color=black ulc
go linekey.jnl 2 "title two" plot/thick/size=0.16/line/sym=30/color=red ulc

go linekey.jnl 1 "title one" plot/thick/sym=20/color=black llc
go linekey.jnl 2 "title two" plot/thick/size=0.16/line/sym=30/color=red llc

go linekey.jnl 1 "title one" plot/thick/sym=20/color=black lrc
go linekey.jnl 2 "title two" plot/thick/size=0.16/line/sym=30/color=red lrc

message now show the example as in test_legend.jnl that used the older legend.jnl script

cancel mode logo

let one=3*x+2
let two=x*x-5
let three=0*x+3

set region /x=-10:10

set viewport ul
go margins 1.4  1.4  1.2  1.2
plot/title="test plot" one,two,three

go linekey 1 "Variable one" plot/color=black ul
go linekey 2 "Variable two"  plot/color=red ul
go linekey 3 "Variable three" plot/color=green ul


set viewport ur
go margins 1.4  1.4  1.2  1.2
plot/title="test plot" one,two,three

go linekey 1 "Variable one" plot/color=black ur
go linekey 2 "Variable two"  plot/color=red ur
go linekey 3 "Variable three" plot/color=green ur


set viewport ll
go margins 1.4  1.4  1.2  1.2
plot/title="test plot" one,two,three

go linekey 1 "Variable one" plot/color=black ll
go linekey 2 "Variable two"  plot/color=red ll
go linekey 3 "Variable three" plot/color=green ll

set viewport lr
go margins 1.4  1.4  1.2  1.2
plot/title="test plot" one,two,three

go linekey 1 "Variable one" plot/color=black lr
go linekey 2 "Variable two"  plot/color=red lr
go linekey 3 "Variable three" plot/color=green lr

message now draw legends outside the plot boxes.
cancel view

set viewport ul
go margins 1.4  1.4  1.2  1.2
plot/title="test plot" one,two,three

go linekey 1 "Variable one" plot/color=black ulc
go linekey 2 "Variable two"  plot/color=red ulc
go linekey 3 "Variable three" plot/color=green ulc


set viewport ur
go margins 1.4  1.4  1.2  1.2
plot/title="test plot" one,two,three

go linekey 1 "Variable one" plot/color=black urc
go linekey 2 "Variable two"  plot/color=red urc
go linekey 3 "Variable three" plot/color=green urc


set viewport ll
go margins 1.4  1.4  1.2  1.2
plot/title="test plot" one,two,three

go linekey 1 "Variable one" plot/color=black llc
go linekey 2 "Variable two"  plot/color=red llc
go linekey 3 "Variable three" plot/color=green llc

set viewport lr
go margins 1.4  1.4  1.2  1.2
plot/title="test plot" one,two,three

go linekey 1 "Variable one" plot/color=black lrc
go linekey 2 "Variable two"  plot/color=red lrc
go linekey 3 "Variable three" plot/color=green lrc
Attachment:
example_linekey.png
Description: PNG image