Hi,
I would like to propose a simpler way to produce maps where cell boundaries are visible.
it uses the polygon command so not as mentionned in https://ferret.pmel.noaa.gov/Ferret/faq/how-can-i-show-the-grid-on-my-map-projection-plots).
Here are for example the different configurations of our ESM at IPSL
plotted with that approach. Variables on regular grids and geodesic grid are correctly plotted.
So by trying to explain this in the simplest way,
I have encountered a problem that seems to be a bug.
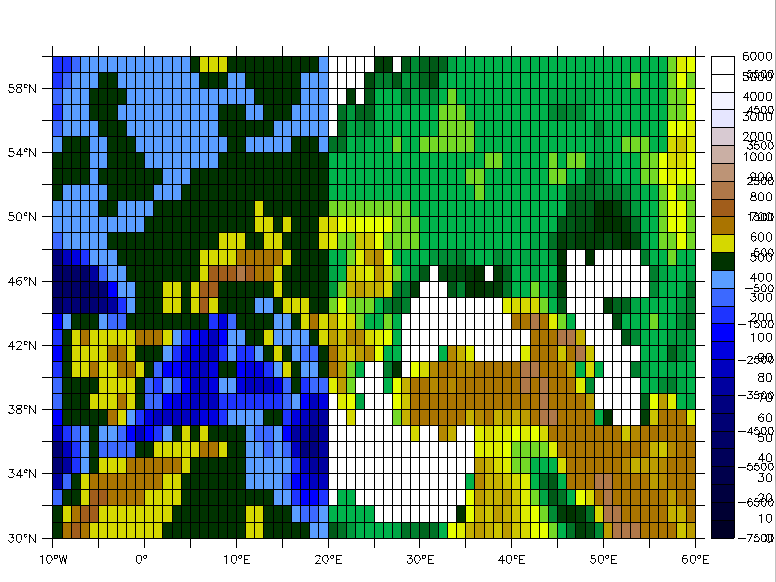
My conclusion is that when /modulo qualifier is used with /lev qualifiers, an overlay appears.
yes? polygon/modulo/hlim=-10:60/vlim=30:60/nolab/line/fill/pal=topo/lev=(0,100,10)(100,1000,100)(1000,6000,1000) xlon, xlat, xvar
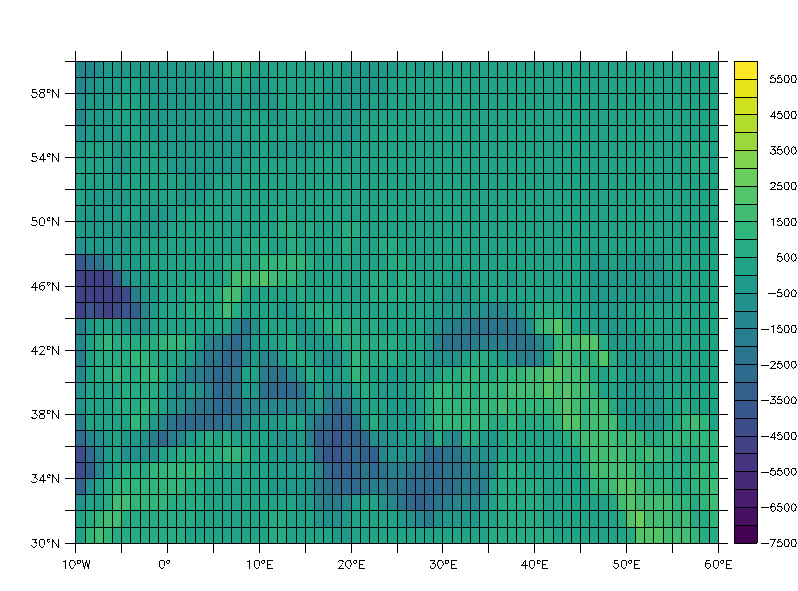
but the plot is correct when you use /lev=25 so free levels
yes? polygon/modulo/hlim=-10:60/vlim=30:60/nolab/line/fill/pal=default/lev=25 xlon, xlat, xvar
Tested with ferret 7.44
Best regards
Patrick
--
Data Analysis and Visualization Engineer / Project Manager
LSCE/IPSL, CEA-CNRS-UVSQ laboratory
LSCE - Climate and Environment Sciences Laboratory
IPSL - Institut Pierre Simon Laplace
--
Data Analysis and Visualization Engineer / Project Manager
LSCE/IPSL, CEA-CNRS-UVSQ laboratory
LSCE - Climate and Environment Sciences Laboratory
IPSL - Institut Pierre Simon Laplace
--