|
Hi Andy, I hope others will write with their particular experience with the cube-sphere grids. Here's one idea, not using the 3-argument SHADE or Fill command,
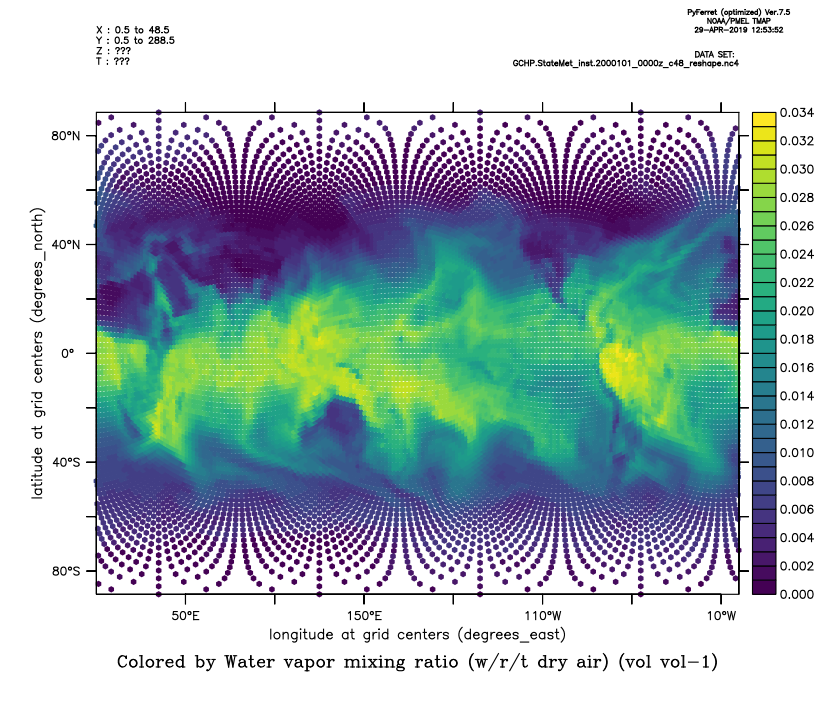
but with the PLOT/VS/RIBBON command for a versus plot colored by
value. This illustrates how stretched out the grid is when shown
in a flat rectangular plot. It works in Ferret or PyFerret, but in
PyFerret we have some nice-looking filled plot-symbols. In
Ferret, you'd give a symbol number, maybe
PLOT/VS/RIBBON/SYM=25/THICK. yes? use GCHP.StateMet_inst.2000101_0000z_c48_reshape.nc4 yes? plot/vs/ribbon/sym=hexfill lon, lat, Met_AVGW[k=1]
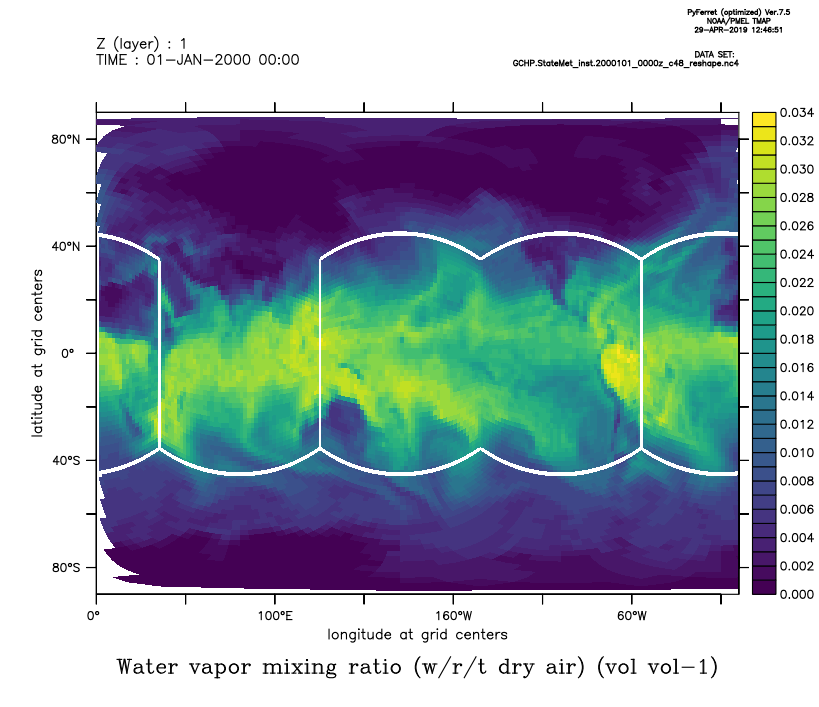
When Ferret or PyFerret draws curvilinear plots with grid-cell
centers it doesn't know what to do with the corners or sometimes
edges, in grids where there are various cuts and poles. It's doing
a purely graphical method, making shapes out of the lon/lat values
in the grids. Here's a way to break up the plot into the different faces and keep the location data for each of them within its own space. I found these sub-regions using non-curvilinear SHADE plots of the lon variable, seeing where it has jumps. You could probably do better using the grid edges, and avoid the
white space - I haven't worked out how that would go. You can give
the 3-argument plot commands using either center or edge values. The first plot here is used to set up the command color levels that will represent all the colors in the entire plot and then each overlay plot say /LEV with no argument to ask Ferret/PyFerret to reuse the color specification from the previous plot.
yes? use GCHP.StateMet_inst.2000101_0000z_c48_reshape.nc4 yes? ! get color levels for the whole map
Ansley On 4/27/2019 6:35 AM, Andy Jacobson
wrote:
Hi All, --
Ansley Manke NOAA/PMEL Science Data Integration Group 7600 Sand Point Way NE 206-526-6246 |
Attachment:
GCHP_plot_vs.png
Description: PNG image
Attachment:
GCHP_curvi.png
Description: PNG image