Yes, that would work, I just do not know how to deal with the z-interpolation. I tried the following below w/o much success.
To simplify things I regrid to data points in 3D (no time axis), which coordinates are "datlon", "datlat", and "datzzz". My gridded modeled variable at a given time is var_mod and I first interpolate in the horizontal, that is,
let var_mod=D13C[L=1]
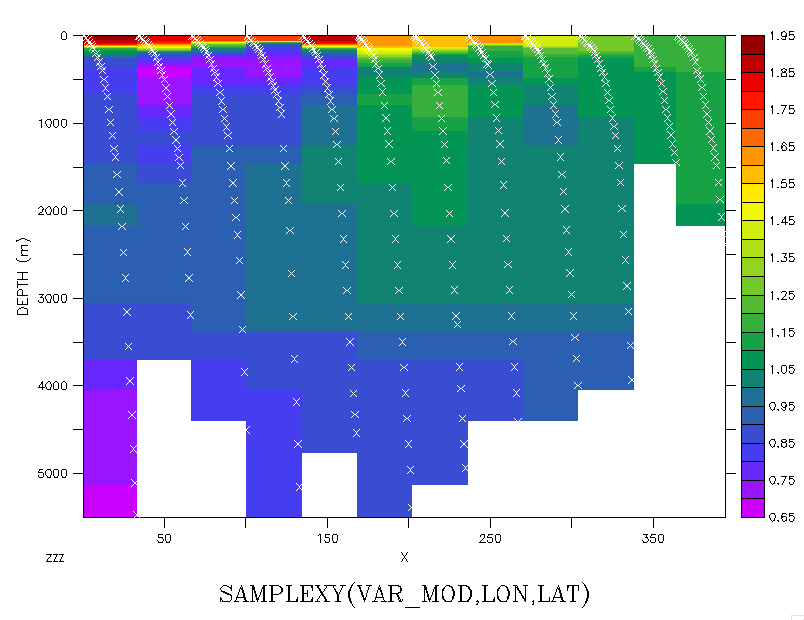
let var_mod_xy=SAMPLEXY(var_mod,DATLON,DATLAT)
Then I need to interpolate along the vertical at the white crosses in the figure in PS, which I plotted as:
sha var_mod_xy
let ipts=x[g=var_mod_xy]
plot/vs/ov/sym=2/color=w ipts[i=1:394],datzzz
Any help on how to do this z-interpolation will be much appreciated, at any rate. I tried
let var_mod_xyz=var_mod_xy[gz=datzzz]
but gives me the same 2D field as var_mod_xy.
Thanks,
Mariona
PS:
On 11/5/18 12:05 PM, Ansley C. Manke wrote:
Hi Mariona,
It should work to use SAMPLEXYT and then either regridding operation to your chosen z locations or SAMPLEK if you want a subset of the z axis of the original grid. Would these get you what you need?
Ansley
On 11/2/2018 3:37 PM, Mariona Claret wrote:
Dear Ferreters,
I would like to interpolate 3D gridded model output with a time dimension to vertical profiles sample during different times. For surface output, I have been using the grid-changing function SAMPLEXYT, but now I need to interpolate also in the vertical. Is there a function such as SAMPLEXYZT? Or SAMPLEXYZ so that I can use SAMPLET_DATE afterwards? Alternatively, could you guide me a bit on how to treat the vertical dimension? I tried a bunch of things without much success.
I will really appreciate any tip you could give me, at any rate.
Thanks,
Mariona Claret
Research Associate
JISAO, University of Washington
3737 Brooklyn Ave NE
Seattle, WA 98105