Hello all,
I’m trying to interpolate observations of NO3 using the function “scat2gridgauss_yz”.
I successfully read in my data, which is structured as 1D column data, which looks like so:
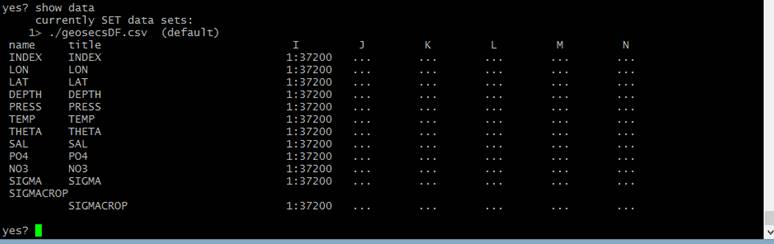
As you can see, I have 37,200 observations.
I now want to select my data from the Indian Ocean, where I eventually would like to do my interpolation using scat2gridgauss_yz.
Plotting the locations it seems like this has worked nicely.
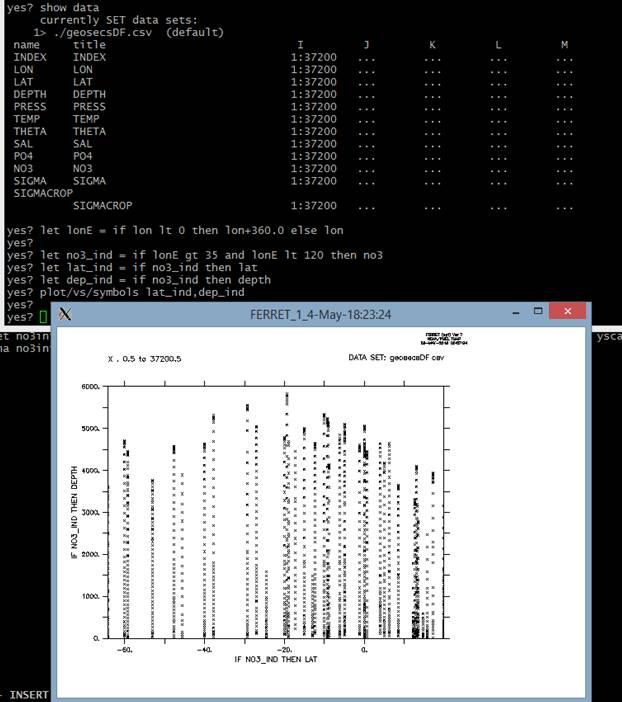
However, the problem then arises when I want to use “scat2gridgauss_yz” to interpolate this data. My command is:
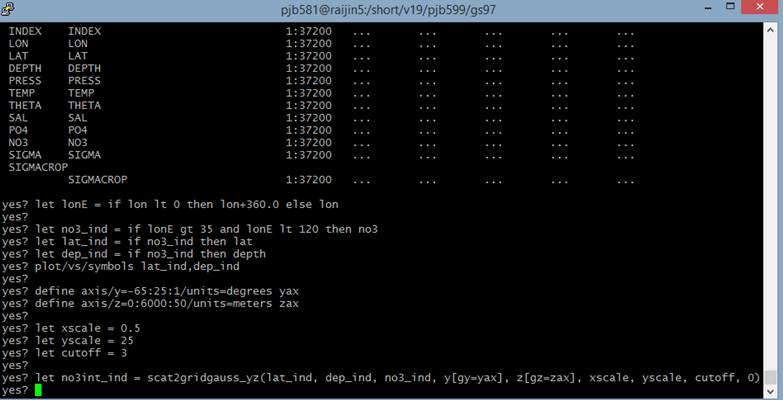
And when trying to plot the data, I have an error. This error is related (I think!) to the fact that my NO3 data is in a 1D form. That is, it doesn’t have y,z coordinates. Scat2gridgauss requires that the variable in the 3rd
argument be of 2 dimensions. Specifically, it must relate to the 2 dimensions of the 1st and 2nd arguments, in this case Latitude and Depth.
My question, therefore, is how to place my 1D NO3 data onto 2 dimensions of the lat,depth coordinates.
Thanks all,
Pearse
Pearse J. Buchanan
Institute for Marine and Antarctic Studies (IMAS), University of Tasmania
PhD Candidate / CSIRO-UTAS Quantitative Marine Science
ARC Centre of Excellence in Climate System Science – UTAS student representative
University of Tasmania Electronic Communications Policy (December, 2014).
This email is confidential, and is for the intended recipient only. Access, disclosure, copying, distribution, or reliance on any of it by anyone outside the intended recipient organisation is prohibited and may be a criminal offence. Please delete if obtained
in error and email confirmation to the sender. The views expressed in this email are not necessarily the views of the University of Tasmania, unless clearly intended otherwise.