Hi Olivier,
In looking further into this, I find that it is due to the graphics portions of Ferret handling the time coordinates a bit differently for line plots and 2-d color plots. In most of Ferret and PyFerret, everything is done in double precision. In most of the graphics routines however, single precision is used.
Line plots handle the time coordinates correctly, so those plots are correct. The color plots are done in a way that loses precision. The time coordinates in this data has time starting in 1918, in seconds since the year 1800, so those data really need double precision in order to be accurate. We have known of this issue, and I am working on a solution to handle time accurately for these cases.
In the meantime a workaround would be to use Ferret to define a time axis which needs less precision to work accurately.
yes? use "https://vesg.ipsl.upmc.fr/thredds/dodsC/work_thredds/p86mart/FERRET_DEBUG/PL01_1ts_thetao_point.nc"
yes? show axis/t/L=1:2 `thetao,return=taxis`
!-> sh axis/t/L=1:2 TIME_COUNTER
name axis # pts start end
TIME_COUNTER TIME 159 r 14-FEB-1918 04:07 19-FEB-1918 02:37
T0 = 01-JAN-1800 00:00:00
Axis span (to cell edges) = 429300
L T TBOX TBOXLO TSTEP (seconds)
1> 14-FEB-1918 04:07:30 2700 14-FEB-1918 03:45:00 3.727484E+09
2> 14-FEB-1918 04:52:30 2700 14-FEB-1918 04:30:00 3.727486E+09
! Make a new definition for the time axis. Redefine the
axis "time_counter",
! so its origin is at the same time as the start of the
data and the coordinates
! start at 0 instead of the previous large value. This
changes only the definition
! of the axis that Ferret stores during the current Ferret
session.
yes? let t1 = tt[L=1]
yes? define axis/t/t0="14-feb-1918:04:07:30"/units=seconds `thetao,return=taxis` = tt - t1
!-> define axis/t/t0="14-feb-1918:04:07:30"/units=seconds TIME_COUNTER = tt - t1
Replacing definition of axis TIME_COUNTER
*** NOTE: grid GCM2 used by data set PL01_1ts_thetao_point
*** NOTE: Redefinition may alter apparent contents of data set
*** NOTE: grid GCM3 used by data set PL01_1ts_thetao_point
*** NOTE: Redefinition may alter apparent contents of data set
! We have changed the time coordinates, "tstep" and the time origin, but the
! coordinates still translate to the same dates and times as the axis in the file.
yes? show axis/t/L=1:2 `thetao,return=taxis`
!-> sh axis/t/L=1:2 TIME_COUNTER
name axis # pts start end
TIME_COUNTER TIME 159 r 14-FEB-1918 04:07 19-FEB-1918 02:37
T0 = 14-FEB-1918:04:07
Axis span (to cell edges) = 429300
L T TBOX TBOXLO TSTEP (SECONDS)
1> 14-FEB-1918 04:07:00 2700 14-FEB-1918 03:44:30 0
2> 14-FEB-1918 04:52:00 2700 14-FEB-1918 04:29:30 2700
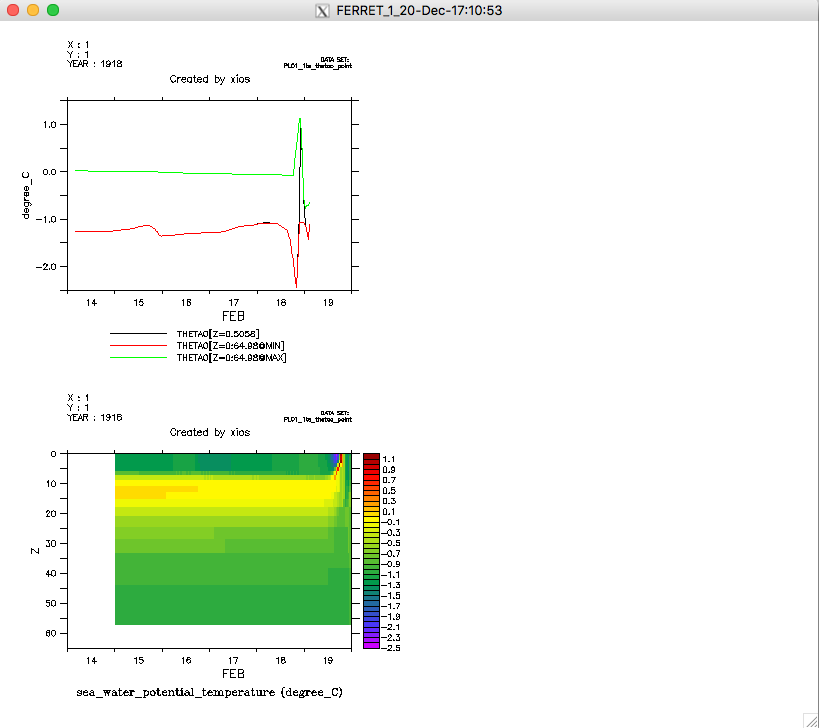
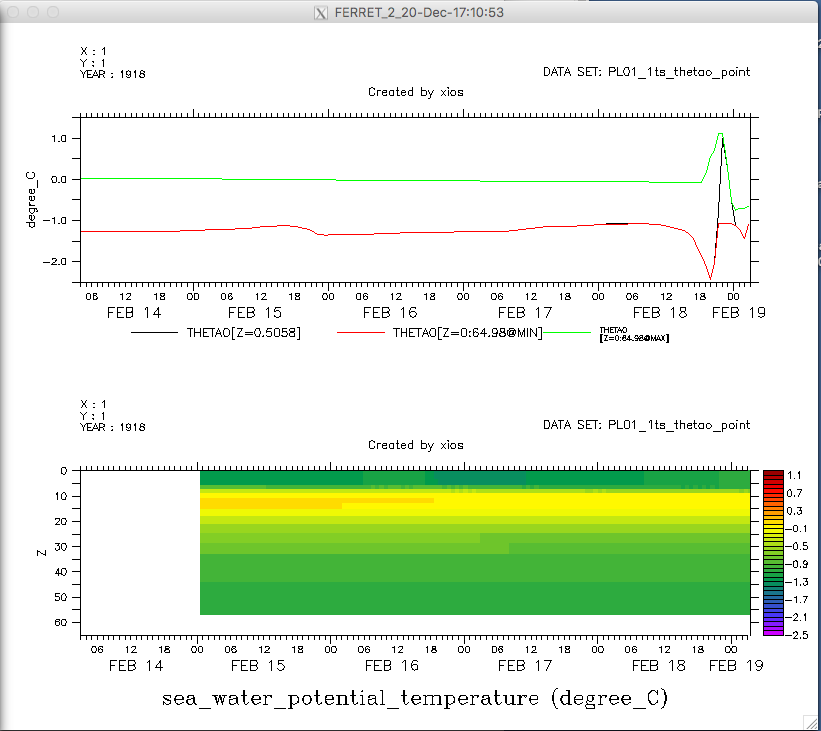
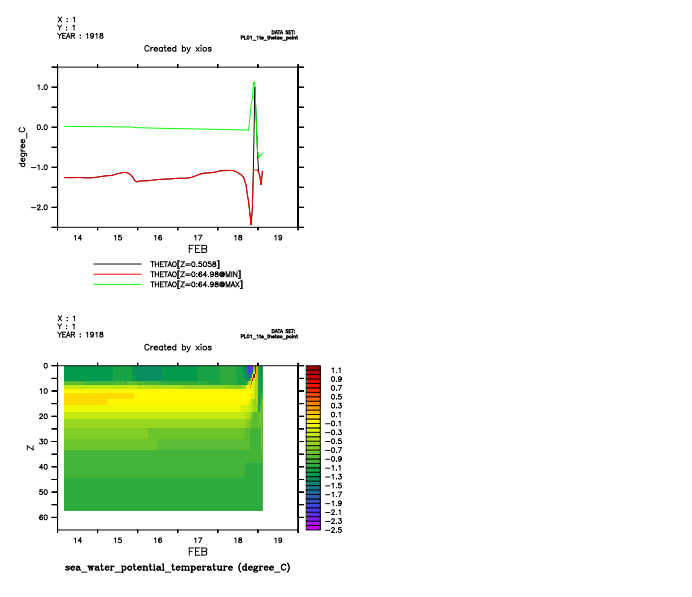
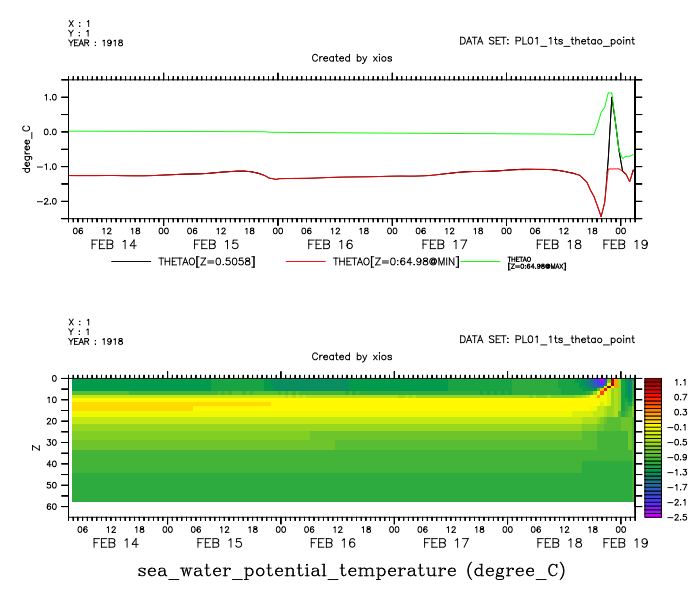
Now continue with the script. The plots drawn in the smaller viewports are still drawn on an axis with entire days at each end, and perhaps that is correct. The axis labeled with hours would be too crowded. I have attached the plots from the script with the above axis redefinition.
-Ansley
Hello Olivier,
Thank you for the example.
Ferret is deciding which time-axis style to use, based both on the length of time requested and on the actual length of the axis on the page. Then, for each style of time axis labeling, it makes the axis with an integer number of the time increments on the page, so the axis labeled with days makes a plot in 1-day increments. It seems that the SHADE plots are drawing in 1-day increments even on the time-axis plots which have finer divisions within one day.
Both of these behaviors seem to me to be bugs. Ferret should draw the same time-axis style for a given time range, regardless of the length of the axis line on the page; and it should be filling in the shade plots back to the start of the time axis. We will look into all of this.
Ansley
On 12/20/2017 2:17 AM, Olivier Marti wrote:
Hi everybody
The following has been tested on Ferret 7.1 on Mac OSX 10.12, Ferret 6.9.3 on RedHat 2.6.32 and PyFerret 7.1 on RedHat 2.6.32
Several questions :
- Why PLOT and SHADE do not show the same time axes ?- Why is there a empty part on the right of the PLOT ?- Why is there a empty part on the left on the SHADE ?- Why the SHADE is cropped on the right part ?- Why this behavior is depending on the viewport definition ?
But the real question is : can I find a workaround to have matching time axes between SHADE and PLOT ?
Thank you for any kind of help !
Olivier
USE "https://vesg.ipsl.upmc.fr/thredds/dodsC/work_thredds/p86mart/FERRET_DEBUG/PL01_1ts_thetao_point.nc"
CANCEL WINDOW/ALL
SET WINDOW 1DEFINE VIEWPORT/X=0.0,0.5/Y=0.5,1.0 v1DEFINE VIEWPORT/X=0.0,0.5/Y=0.0,0.5 v2
SET VIEW v1 ; PLOT/K=1:20/LINE thetao[K=1], thetao[K=@MIN], thetao[K=@MAX]SET VIEW v2 ; SHADE/K=1:20 thetao
SET WINDOW 2DEFINE VIEWPORT/X=0.0,1.0/Y=0.5,1.0 v1DEFINE VIEWPORT/X=0.0,1.0/Y=0.0,0.5 v2
SET VIEW v1 ; PLOT/K=1:20/LINE thetao[K=1], thetao[K=@MIN], thetao[K=@MAX]SET VIEW v2 ; SHADE/K=1:20 thetao
--Laboratoire des Sciences du Climat et de l'EnvironnementInstitut Pierre Simon LaplaceLaboratoire CEA-CNRS-UVSQ - UMR 8212Tel : +33 1 69 08 77 27 - Mob : +33 6 45 36 43 74Fax : +33 1 69 08 30 73